My Account
My Slides
Search by Category
Templates
View All Templates
Download Template Slides
Leave Feedback
Login
Logout
Get Started
Browse all Slides
Browse all Slides
Create a FREE Account
Instant access to 1,000+ real slides from top companies like McKinsey, BCG, Goldman Sachs, Google and many more!
First Name
Last Name
Email
Password
I agree to all
Terms & Privacy Policy
Thank you! Your submission has been received!
Oops! Something went wrong while submitting the form.
Have an account?
Sign in
Spark Your Next Big Idea with New Presentation Templates
VIEW ALL Templates
Welcome,
Welcome
PRO
Show Featured Only
Checkbox 8
Companies
Mckinsey
Bain
BCG
EY
Deloitte
Accenture
PwC/Strategy&
JP Morgan
Goldman Sachs
Morgan Stanley
Citigroup
Deutsche Bank
Barclays
LEK
KPMG
Kearney
Oliver Wyman
Booz Allen Hamilton
Gartner
IPSOS
Nielsen
Slide type
Text Only
Linear Flow
Vertical Flow
Single Chart
Header Horizontal
Mixed Chart
Header Vertical
Pillar
Multiple Chart
Graphic
Agenda
Title
Table
Framework
Industry
Technology & Software
Artificial Intelligence
Financial Services
Retail & E-commerce
Consumer Goods
Industrial & Manufacturing
Transportation & Logistics
Telecommunications
Real Estate & Construction
Hospitality & Tourism
Professional Services
Education & Training
Media & Entertainment
Agriculture & Food Production
Healthcare & Pharmaceuticals
Environmental Services & Sustainability
Government & Public Sector
Use Case
Mergers and Acquisitions
Performance Metrics and KPIs
Client Case Studies
Competitive Landscape
Corporate Finance and Valuation
Product and Service Analysis
Customer and Market Segmentation
Organizational Structure and Change
Industry Overview
Regulatory and Compliance
Risk Assessment and Management
Investment Analysis
Organizational Structure and Change
Human Resources and Talent Management
Financial Performance
Market Analysis and Trends
Sales and Business Development
Human Resources and Talent Management
Clear all
Thank you! Your submission has been received!
Oops! Something went wrong while submitting the form.
Tag
View slide
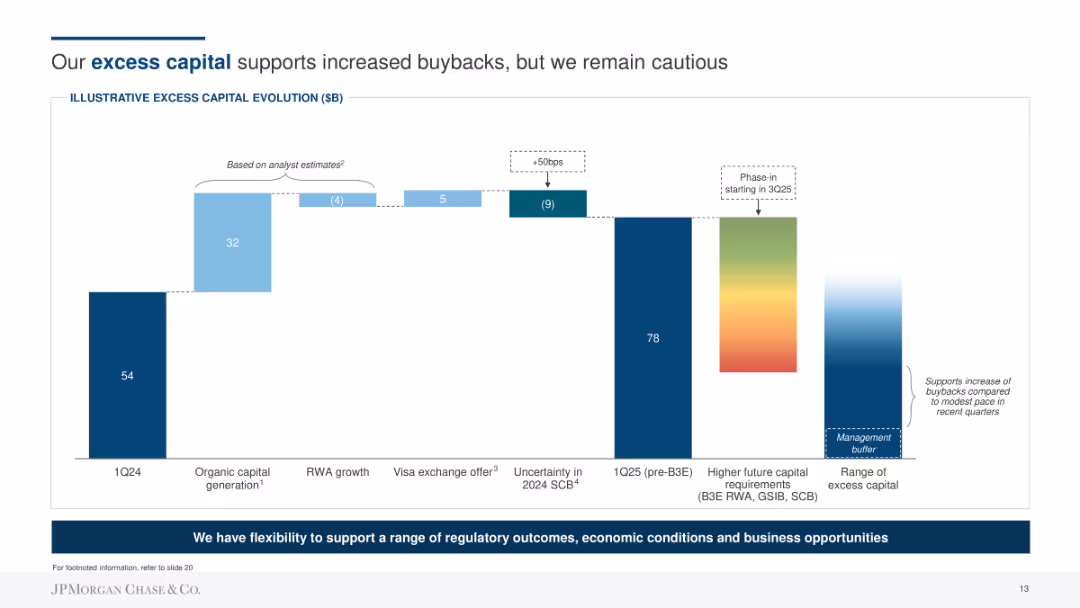
Bar chart showing the evolution of excess capital from 1Q24 to 1Q25, including organic capital generation, RWA growth, and other factors. Uses a color gradient to show different stages and contributions.
Strategic Planning
Financial Services
Describes how JP Morgan plans to use excess capital to support buybacks, considering various regulatory outcomes and economic conditions. Shows projected capital figures and factors influencing changes.
Capital, Buybacks, Excess, Strategy, Planning, Growth, Financial
false
Strategic Planning
Financial Services financial-services
Single Chart
JP Morgan
View slide
Displays column charts showing changes in capital metrics like CET1 ratio and leverage ratio, alongside MREL/TLAC requirements with surplus figures.
Performance Metrics and KPIs
Financial Services
Provides an update on the bank's capital position, detailing changes in capital ratios and requirements, key for regulatory compliance and stability assessment.
Capital, CET1 ratio, leverage, compliance
false
Performance Metrics and KPIs
Financial Services financial-services
Multiple Chart
Deutsche Bank
View slide
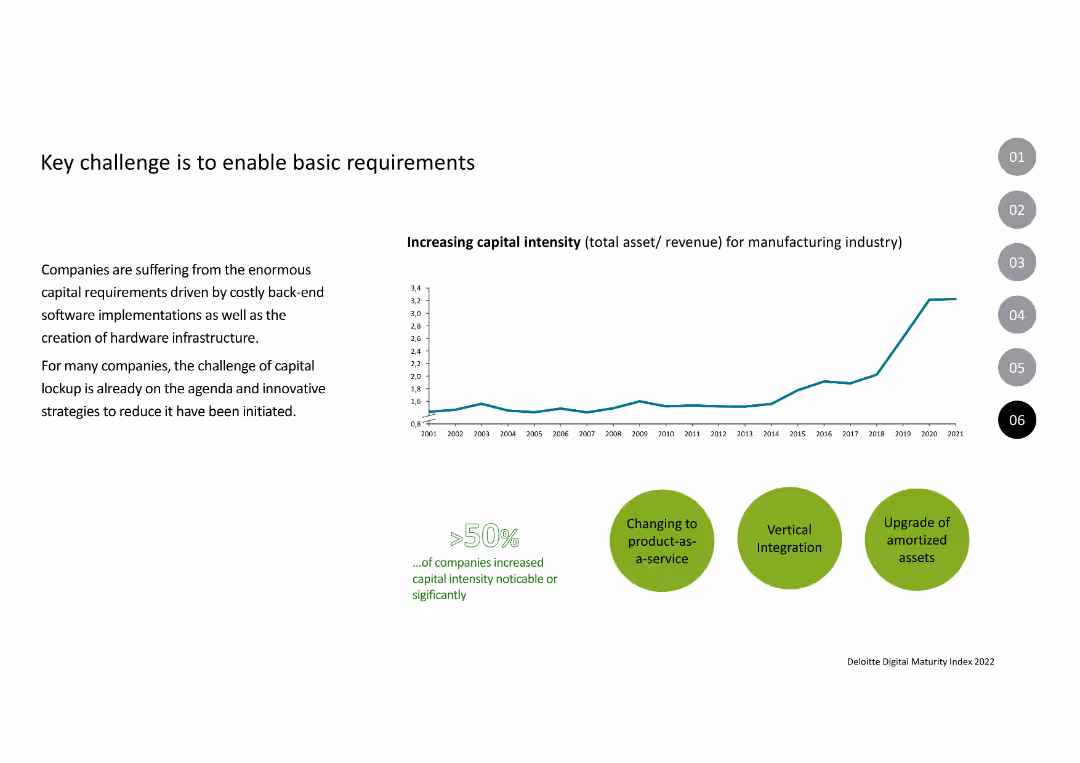
Features a line chart showing the increase in capital intensity for the manufacturing industry from 2001 to 2021. Below the chart, there are three key strategies illustrated with icons: changing to product-as-a-service, vertical integration, and upgrading amortized assets.
Operational Efficiency
Industrial & Manufacturing
Highlights the rising capital intensity in the manufacturing industry and the strategies being adopted to manage this challenge. It emphasizes the need for innovative approaches like product-as-a-service models and vertical integration to unlock capital and drive efficiency.
Capital, Intensity, Manufacturing, Strategy, Integration
false
Operational Efficiency
Industrial & Manufacturing industrial-and-manufacturing
Mixed Chart
Deloitte
View slide
The slide presents stacked column charts representing capital movement with labels for dates and financial segments. It uses a color gradient to differentiate segments within the bars.
Financial Performance
Financial Services
This slide shows capital movement within Macquarie Capital over two time points, highlighting changes across different financial sectors like debt and various types of energy investments.
Capital, Investments, Realizations, FX, Debt
false
Financial Performance
Financial Services financial-services
Single Chart
Morgan Stanley
View slide
The slide features column charts and text. It presents capital and leverage ratios, showing total loss-absorbing capacity and other key financial metrics.
Financial Performance
Financial Services
This slide provides an overview of capital and leverage ratios, including total loss-absorbing capacity, essential for understanding financial stability and regulatory compliance.
Capital, Leverage, Ratios, Financial, Metrics
false
Financial Performance
Financial Services financial-services
Multiple Chart
UBS
View slide
Column charts for capital metrics, column charts for assets and liabilities, text boxes
Financial Performance
Financial Services
Detailed capital and liquidity metrics, balance sheet overview of a financial firm
Capital, Liquidity, Balance Sheet, Bar Chart, Column Chart, Financials
false
Financial Performance
Financial Services financial-services
Multiple Chart
Citigroup
View slide
Contains several column charts and tables that provide an overview of capital metrics, liquidity ratios, and balance sheet components.
Regulatory and Compliance
Financial Services
Summarizes key financial ratios and metrics critical for regulatory compliance and financial analysis. Focuses on liquidity, leverage, and capital adequacy, crucial for assessing the institution's stability and adherence to regulatory standards.
Capital, Liquidity, Compliance, Financial, Balance Sheet
false
Regulatory and Compliance
Financial Services financial-services
Multiple Chart
Citigroup
View slide
Slide with multiple graphs detailing Citigroup's capital metrics, liquidity, and balance sheet summaries as of Q4 2021.
Financial Performance
Financial Services
Offers a comprehensive overview of Citigroup's capital adequacy, liquidity positions, and overall financial health at the end of 2021.
Capital, Liquidity, Financial, Banking, Health
false
Financial Performance
Financial Services financial-services
Multiple Chart
Citigroup
View slide
This slide includes column charts and a pie chart, providing a visual representation of net profit contributions and income by region. It utilizes a straightforward layout with complementary colors for clarity.
Financial Performance
Financial Services
Analyzes financial contributions and regional income distribution for Macquarie Capital. It conveys financial growth and geographic market influence, useful for discussing strategic regional focus or investment decisions.
Capital, Profit Contribution, Regional Income, Financial Growth, Strategy
false
Financial Performance
Financial Services financial-services
Multiple Chart
Goldman Sachs
View slide
Slide contains multiple horizontal bars showing percentages of Lloyd’s capital providers by source and location.
Risk Assessment and Management
Financial Services
Discusses the diverse sources of Lloyd's capital, with a focus on the contributions by the Bermudian and UK insurance industries, among others. Highlights unexpected sources.
Capital, Providers, Insurance, International, Sources
false
Risk Assessment and Management
Financial Services financial-services
Single Chart
PwC/Strategy&
View slide
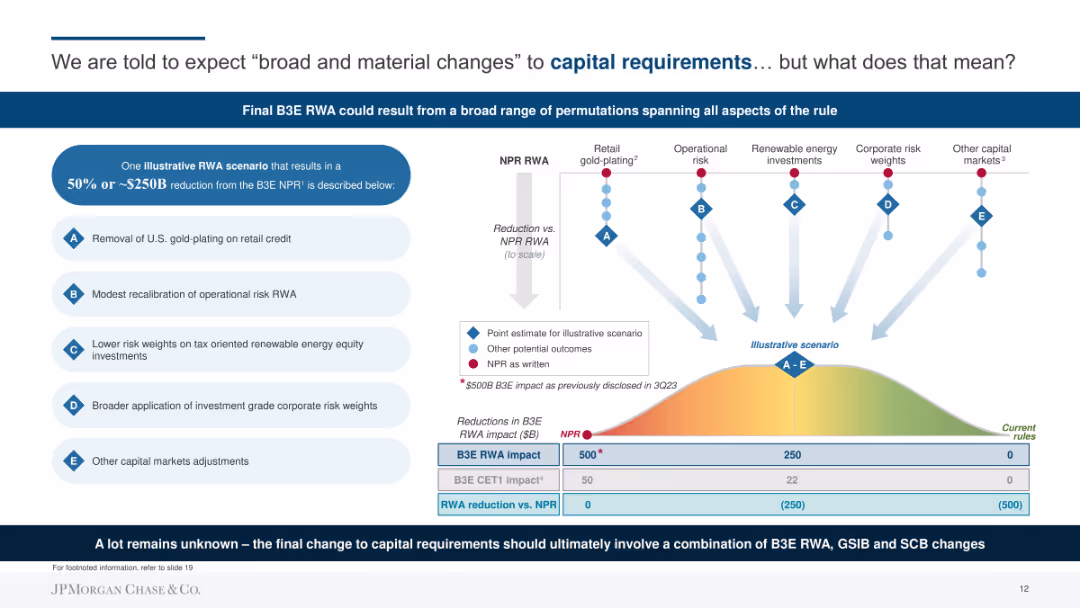
Diagram illustrating possible changes to capital requirements with multiple scenarios and their impacts. Uses arrows and color-coded sections to depict different aspects like operational risk, renewable energy investments, and corporate risk weights.
Regulatory and Compliance
Financial Services
Explains potential changes in capital requirements, highlighting a scenario where B3E RWA could be reduced by 50% or ~$250B. Includes details on operational risk recalibration and other adjustments.
Capital, Requirements, RWA, Risk, Compliance, Regulatory, Financial
false
Regulatory and Compliance
Financial Services financial-services
Diagram
JP Morgan
View slide
The slide presents multiple donut charts comparing the return on equity and asset growth across different banking divisions, with textual analysis on the side.
Financial Performance
Financial Services
This slide analyzes the capital allocation and returns on equity across various banking divisions, projecting significant financial growth and detailing the drivers behind these projections, which are essential for understanding strategic financial management within the bank.
Capital, RoTE, Banking Divisions, Growth, Assets
false
Financial Performance
Financial Services financial-services
Multiple Chart
Barclays
View slide
The slide features a line graph depicting capital deployment and TSR performance, along with bar graphs for dividends.
Financial Performance
Financial Services
This slide presents Booz Allen's financial performance in terms of capital deployment and shareholder dividends. It’s useful for financial reviews and showcasing company growth.
Capital, TSR, Dividends, Performance, Value
false
Financial Performance
Financial Services financial-services
Multiple Chart
Booz Allen Hamilton
View slide
Column charts showing car-buying intent and timing; segmented by new and used cars
Market Analysis and Trends
Consumer Goods
Analyzes the intent to buy cars among respondents, highlighting trends and timelines for new and used cars
Car-buying, intent, new cars, used cars, trends
false
Market Analysis and Trends
Consumer Goods consumer-goods
Multiple Chart
EY
View slide
This slide features bar charts comparing carbon emissions across different regions using both accounting methods. The bar charts are displayed side-by-side, with clear labels and distinct color coding for consumption-based and production-based emissions.
Market Analysis and Trends
Government & Public Sector
The slide compares regional carbon emissions under production-based and consumption-based accounting methods, highlighting the differences in reported emissions. It underscores how consumption-based accounting reveals higher emissions for regions like the US and EU due to their imported goods, advocating for more comprehensive emissions tracking.
Carbon Emissions, Accounting, Regional Comparison, Consumption, Production
false
Market Analysis and Trends
Government & Public Sector government-and-public-sector
Multiple Chart
EY
View slide
This slide includes a text section on the left discussing carbon pricing as a commodity and two column charts on the right. One chart shows trades in CO2 emissions, and the other displays CO2 emissions intensity by region, both with clear color distinctions.
Market Analysis and Trends
Government & Public Sector
It argues for the benefits of treating carbon as a tradable commodity to drive global emissions reduction. The slide presents data on CO2 trades between regions and the carbon intensity of goods production, highlighting how regions can leverage carbon pricing to achieve more significant environmental and economic benefits.
Carbon Pricing, CO2 Emissions, Trades, Commodity, Intensity
false
Market Analysis and Trends
Government & Public Sector government-and-public-sector
Multiple Chart
EY
View slide
The slide is a content slide featuring a combination of text and a large pie chart illustrating the share of global GHG emissions by ETSs in 2022. The background is dark, with highlighted sections for emphasis on key points.
Regulatory and Compliance
Government & Public Sector
It explains the principles of carbon pricing, comparing ETS and carbon taxes, and discusses their implementation challenges and benefits. The slide includes data on the global GHG emissions covered by ETSs and insights into various countries' carbon pricing strategies to foster sustainability and emissions reduction.
Carbon Pricing, ETS, GHG Emissions, Regulatory, Compliance
false
Regulatory and Compliance
Government & Public Sector government-and-public-sector
Mixed Chart
EY
View slide
This slide shows a horizontal bar chart comparing the levelized cost of energy for renewable and conventional energy sources under different carbon pricing scenarios.
Regulatory and Compliance
Energy & Utilities
The slide evaluates the impact of carbon pricing on the cost competitiveness of various energy sources, highlighting the influence of carbon costs on renewable and conventional energy generation.
Carbon Pricing, Energy Costs, LCOE, Regulation, Comparison
false
Regulatory and Compliance
Energy & Utilities energy-and-utilities
Single Chart
Roland Berger
View slide
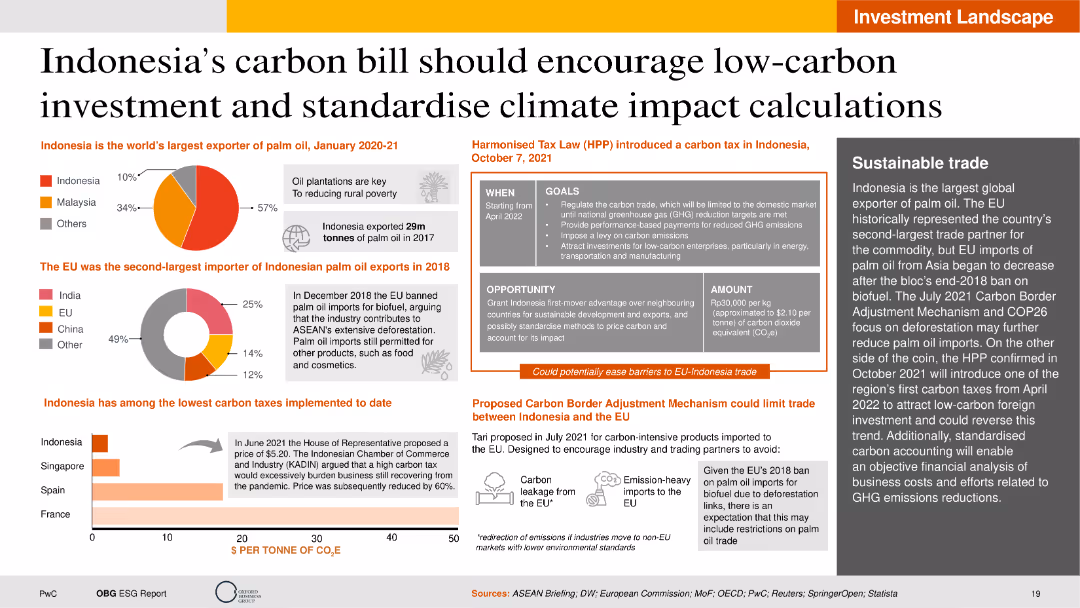
This slide contains pie charts, column charts, and tables, providing visual representations of Indonesia's carbon bill, global palm oil exportation data, and carbon tax implementations. The layout is detailed, with varied graphical data and supporting text.
Regulatory and Compliance
Energy & Utilities
The slide explains the implications of Indonesia's carbon bill in encouraging low-carbon investments and standardizing climate impact calculations. It details the global export of palm oil, EU import bans, and the harmonized tax law for carbon taxation in Indonesia. It also presents a comparative analysis of carbon taxes implemented by different countries and the potential effects of the carbon border adjustment mechanism.
Carbon bill, low-carbon investment, palm oil export, carbon tax, EU ban
false
Regulatory and Compliance
Energy & Utilities energy-and-utilities
Multiple Chart
PwC/Strategy&
View slide
Features a detailed diagram of the integration of CCS with SMR, listing various options for CO2 capture, their descriptions, maturity, and capture rates.
Technology and Digital Transformation
Energy & Utilities
Explains how combining carbon capture and storage (CCS) with steam methane reforming (SMR) can reduce CO2 emissions, detailing different capture options and efficiencies.
Carbon capture, CCS, SMR, CO2 emissions, production integration
false
Technology and Digital Transformation
Energy & Utilities energy-and-utilities
Diagram
Kearney
View slide
Includes a flow diagram illustrating the CCS value chain, from CO2 capture to transport and storage, with text explanations for each stage.
Regulatory and Compliance
Energy & Utilities
Describes the carbon capture and storage (CCS) process, detailing the stages from capturing CO2 emissions to transporting and storing them, emphasizing abatement technologies.
Carbon capture, storage, CCS, CO2 emissions, value chain
false
Regulatory and Compliance
Energy & Utilities energy-and-utilities
Linear Flow
Kearney
View slide
Features a world map highlighting the top five carbon-emitting countries, using color coding and percentages to show the proportion of emissions each country contributes.
Regulatory and Compliance
Environmental Services & Sustainability
Analyzes the carbon emission contributions of the top five countries, highlighting the significant role of major economies in global emissions. Useful for discussions on international cooperation and policy-making for emission reduction.
Carbon emissions, Countries, Global share, Climate policy
false
Regulatory and Compliance
Environmental Services & Sustainability environmental-services-and-sustainability
Multiple Chart
BCG
View slide
The slide features infographics and charts predicting future carbon farming benefits in Maranoa, including additional ACCUs generated, revenue, and supported jobs.
Client Case Studies
Agriculture & Food Production
This slide forecasts the potential future of Maranoa through carbon farming, estimating additional ACCUs generated, revenue growth, and job support from 2021 to 2030. It highlights various carbon farming practices and their economic impact.
Carbon farming, Maranoa, Future projections, Revenue, Jobs
false
Client Case Studies
Agriculture & Food Production agriculture-and-food-production
Mixed Chart
EY
View slide
Similar to the previous slide, this one presents data for Great Britain, showing the mean estimate of CO2 emissions from a beef burger and the percentage of respondents who couldn't estimate the distance.
Market Analysis and Trends
Environmental Services & Sustainability
This slide focuses on the British respondents' awareness of the carbon footprint of beef burgers, highlighting that 83% couldn't estimate the distance, with an average estimate of 24 miles.
Carbon footprint, beef burger, emissions, Great Britain, public perception
false
Market Analysis and Trends
Environmental Services & Sustainability environmental-services-and-sustainability
Mixed Chart
IPSOS
View slide
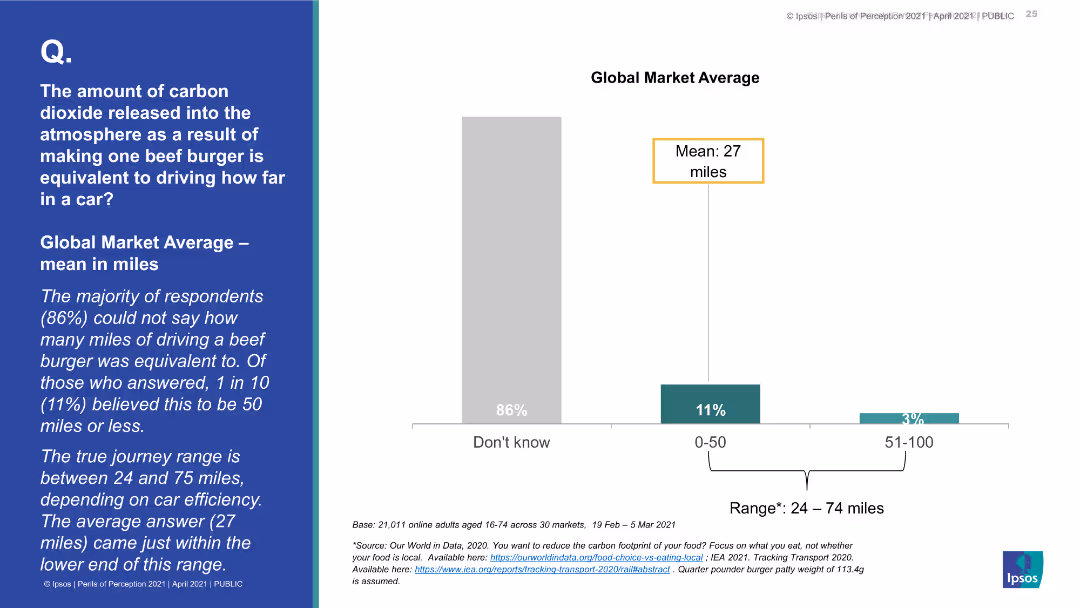
This slide features a column chart showing the percentage of respondents who could estimate the distance equivalent of CO2 emissions from a beef burger. The chart includes 'Don't know', '0-50 miles', and '51-100 miles' categories.
Market Analysis and Trends
Environmental Services & Sustainability
The slide illustrates the lack of knowledge among respondents about the carbon footprint of beef burgers, with most unable to estimate the distance. The mean estimate given is 27 miles.
Carbon footprint, beef burger, emissions, public perception, environmental impact
false
Market Analysis and Trends
Environmental Services & Sustainability environmental-services-and-sustainability
Mixed Chart
IPSOS
View slide
Contains multiple line graphs comparing the carbon intensity and emissions per capita for several countries, with projections for 2050 under current policies and ideal targets for a 2°C warming scenario. Each country's trajectory is marked distinctly.
Regulatory and Compliance
Environmental Services & Sustainability
Compares the carbon intensity and emissions per capita of key countries, projecting their future paths and comparing them to the required levels for meeting the 2°C warming limit. Highlights disparities in emissions intensity and the challenges different countries face in achieving climate goals.
Carbon intensity, Emissions, GDP, 2050, Country comparison
false
Regulatory and Compliance
Environmental Services & Sustainability environmental-services-and-sustainability
Single Chart
BCG
View slide
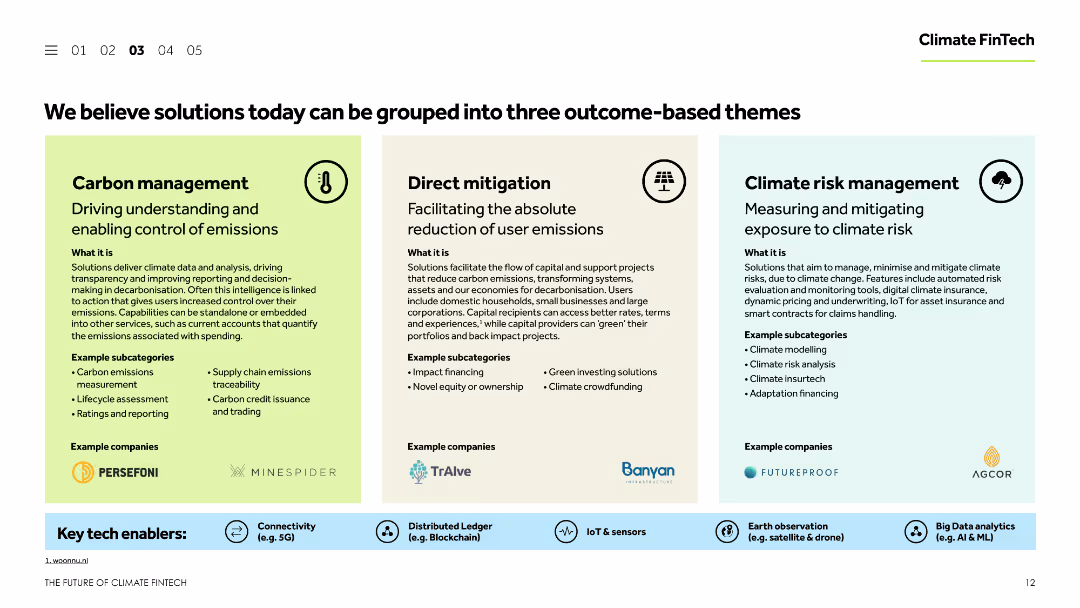
This slide is organized into three columns, each representing a different theme: carbon management, direct mitigation, and climate risk management. Each column includes textual descriptions and example companies, supported by relevant icons and colors.
Strategic Planning
Environmental Services & Sustainability
The slide categorizes Climate FinTech solutions into three main themes: carbon management, direct mitigation, and climate risk management. It provides detailed descriptions of each theme, including example subcategories and companies involved in these areas.
Carbon management, direct mitigation, climate risk management, Climate FinTech, themes
false
Strategic Planning
Environmental Services & Sustainability environmental-services-and-sustainability
Pillar
Barclays
View slide
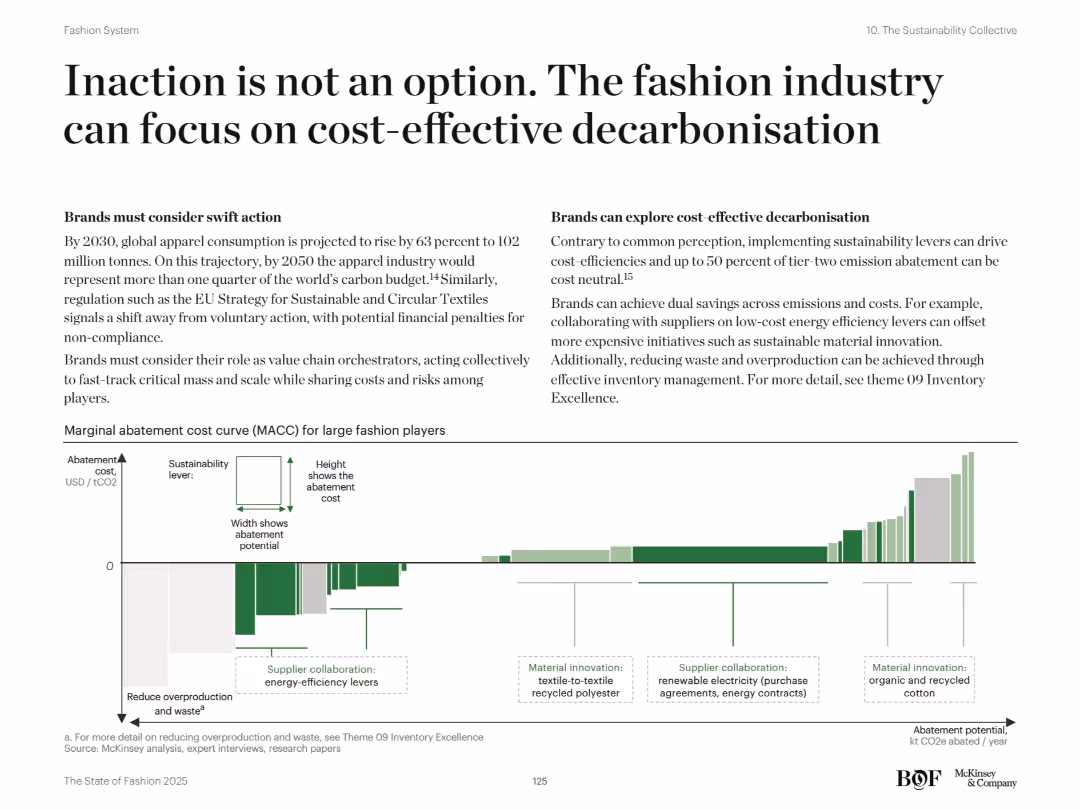
Two-column layout: left focuses on urgency and collective action, right promotes cost-efficient abatement strategies. Bottom shows a marginal abatement cost curve (MACC) chart.
Risk Assessment and Management
Retail & E-commerce
This slide promotes cost-effective approaches to decarbonization in the fashion industry. It underscores the financial and regulatory risks of inaction and showcases how low-cost measures like energy efficiency and inventory optimization can deliver high sustainability impact.
Carbon reduction, decarbonisation, energy efficiency, inventory waste, cost abatement, ESG, sustainability levers, supply chain emissions, MACC, fashion regulation
false
Risk Assessment and Management
Retail & E-commerce retail-and-e-commerce
Mixed Chart
McKinsey
View slide
The slide presents a diagram categorizing different carbon separation technologies. It uses a hierarchical structure with boxes and arrows, featuring both text and colored elements.
Technology and Digital Transformation
Energy & Utilities
The slide categorizes various CO₂ separation technologies, detailing methods like absorption, adsorption, membranes, liquid/supercritical CO₂, and novel technologies.
Carbon separation, absorption, adsorption, membranes, CO₂ technologies, energy, utilities, chemical processes
false
Technology and Digital Transformation
Energy & Utilities energy-and-utilities
Diagram
Kearney
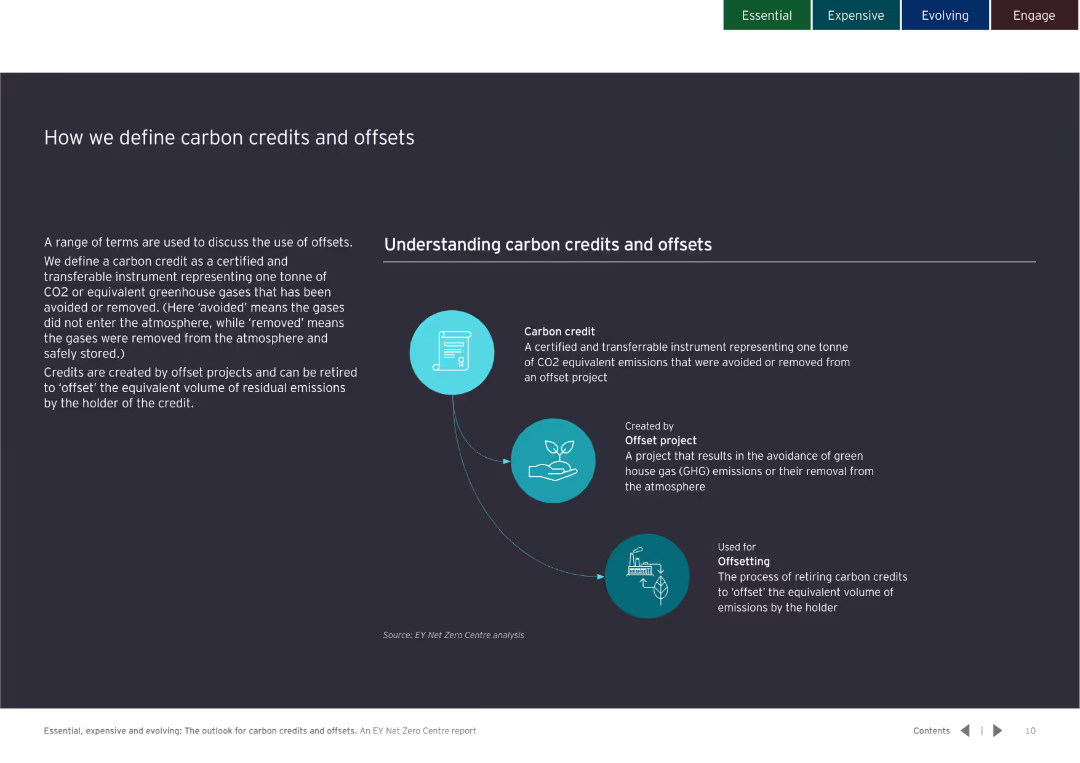
View slide
Contains detailed text definitions and an infographic explaining carbon credits and offsets, including creation and use.
Regulatory and Compliance
Environmental Services & Sustainability
Defines carbon credits as instruments for avoided or removed CO2 emissions, explaining their creation through offset projects and usage in emission reductions.
Carbon, credit, offset, definition, regulation, compliance, CO2, emissions, reduction
false
Regulatory and Compliance
Environmental Services & Sustainability environmental-services-and-sustainability
Diagram
EY
Previous
Loading...
Hold On!
We are searching in our database
If nothing, comes up, please try different filters!
Column Chart
Heatmap
Chevron
Org Chart
Infographic
Callouts
Timeline
List
Graphic
Picture
Process Flow
Diagram
Paragraph
Map
Table
Framework
Subtitle
Takeaway Box
Icon
Other Chart
Radar Chart
Waterfall Chart
Mekko Chart
Pie Chart
Scatter Plot
Line Chart
Bar chart
Bullet points
Create a FREE account to continue browsing
Receive Instant Access to 1,000+ slides from companies like McKinsey, Google, and Goldman Sachs
First Name
Last Name
Email
Password
I agree to all
Terms & Privacy Policy
Thank you! Your submission has been received!
Oops! Something went wrong while submitting the form.
Have an account?
Sign in
Upgrade to PRO to Save slides
Advanced Search and Filters
Access to 15,000+ slides
Access to Category Pages
Save/Bookmark Slides
PowerPoint Template Library
Pick a Plan
MONTHLY
$12/month
Billed every month, Cancel anytime.
YEARLY
$9/year
Billed $108 annually, Cancel anytime.
Checkout for $12/month
Checkout for $108/yr
Secured by Stripe | AES-256 bit encryption