My Account
My Slides
Search by Category
Templates
View All Templates
Download Template Slides
Leave Feedback
Login
Logout
Get Started
Browse all Slides
Browse all Slides
Create a FREE Account
Instant access to 1,000+ real slides from top companies like McKinsey, BCG, Goldman Sachs, Google and many more!
First Name
Last Name
Email
Password
I agree to all
Terms & Privacy Policy
Thank you! Your submission has been received!
Oops! Something went wrong while submitting the form.
Have an account?
Sign in
Spark Your Next Big Idea with New Presentation Templates
VIEW ALL Templates
Welcome,
Welcome
PRO
Show Featured Only
Checkbox 8
Companies
Mckinsey
Bain
BCG
EY
Deloitte
Accenture
PwC/Strategy&
JP Morgan
Goldman Sachs
Morgan Stanley
Citigroup
Deutsche Bank
Barclays
LEK
KPMG
Kearney
Oliver Wyman
Booz Allen Hamilton
Gartner
IPSOS
Nielsen
Slide type
Text Only
Linear Flow
Vertical Flow
Single Chart
Header Horizontal
Mixed Chart
Header Vertical
Pillar
Multiple Chart
Graphic
Agenda
Title
Table
Framework
Industry
Technology & Software
Artificial Intelligence
Financial Services
Retail & E-commerce
Consumer Goods
Industrial & Manufacturing
Transportation & Logistics
Telecommunications
Real Estate & Construction
Hospitality & Tourism
Professional Services
Education & Training
Media & Entertainment
Agriculture & Food Production
Healthcare & Pharmaceuticals
Environmental Services & Sustainability
Government & Public Sector
Use Case
Mergers and Acquisitions
Performance Metrics and KPIs
Client Case Studies
Competitive Landscape
Corporate Finance and Valuation
Product and Service Analysis
Customer and Market Segmentation
Organizational Structure and Change
Industry Overview
Regulatory and Compliance
Risk Assessment and Management
Investment Analysis
Organizational Structure and Change
Human Resources and Talent Management
Financial Performance
Market Analysis and Trends
Sales and Business Development
Human Resources and Talent Management
Clear all
Thank you! Your submission has been received!
Oops! Something went wrong while submitting the form.
Tag
View slide
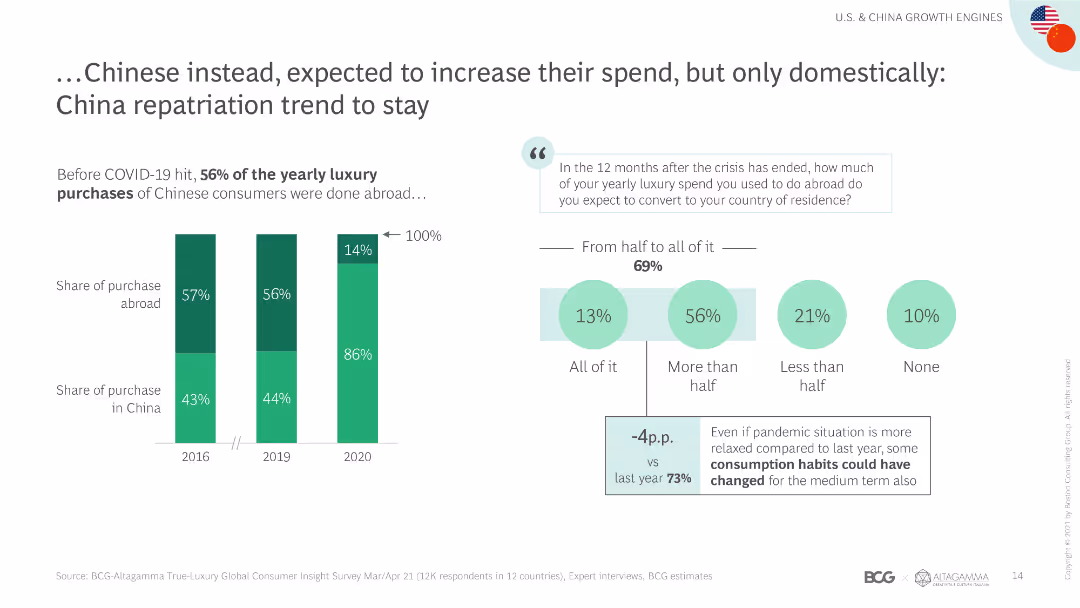
The slide includes a column chart showing the shift in luxury spending by Chinese consumers from abroad to domestic markets, with accompanying text explaining the trend.
Market Analysis and Trends
Retail & E-commerce
The slide highlights the trend of Chinese consumers increasing their luxury spending domestically, driven by repatriation and changing consumption habits post-COVID-19.
Chinese consumers, domestic spending, repatriation, luxury market, spending shift, consumption habits, market trends, COVID-19 impact, spending patterns
false
Market Analysis and Trends
Retail & E-commerce retail-and-e-commerce
Mixed Chart
BCG
View slide
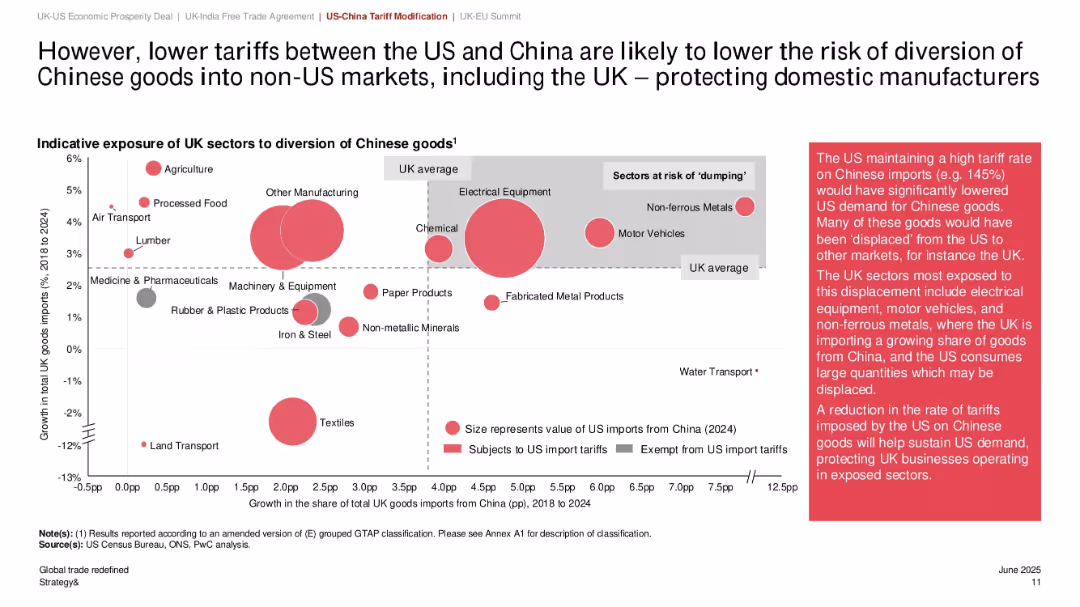
Bubble chart showing UK sectors exposed to Chinese import diversion; bubble size reflects import value; shaded zones highlight sectoral risk; annotation box explains implications.
Risk Assessment and Management
Government & Public Sector
This slide highlights how reduced US tariffs on Chinese imports lower the risk of goods being diverted into the UK market, mitigating the dumping risk for domestic manufacturers. Sectors like electrical equipment and motor vehicles are most exposed. Bubble sizes represent 2024 import values.
Chinese imports, sector exposure, dumping risk, UK manufacturing, tariff reduction, import diversion, bubble chart, global trade, domestic protection
false
Risk Assessment and Management
Government & Public Sector government-and-public-sector
Mixed Chart
PwC/Strategy&
View slide
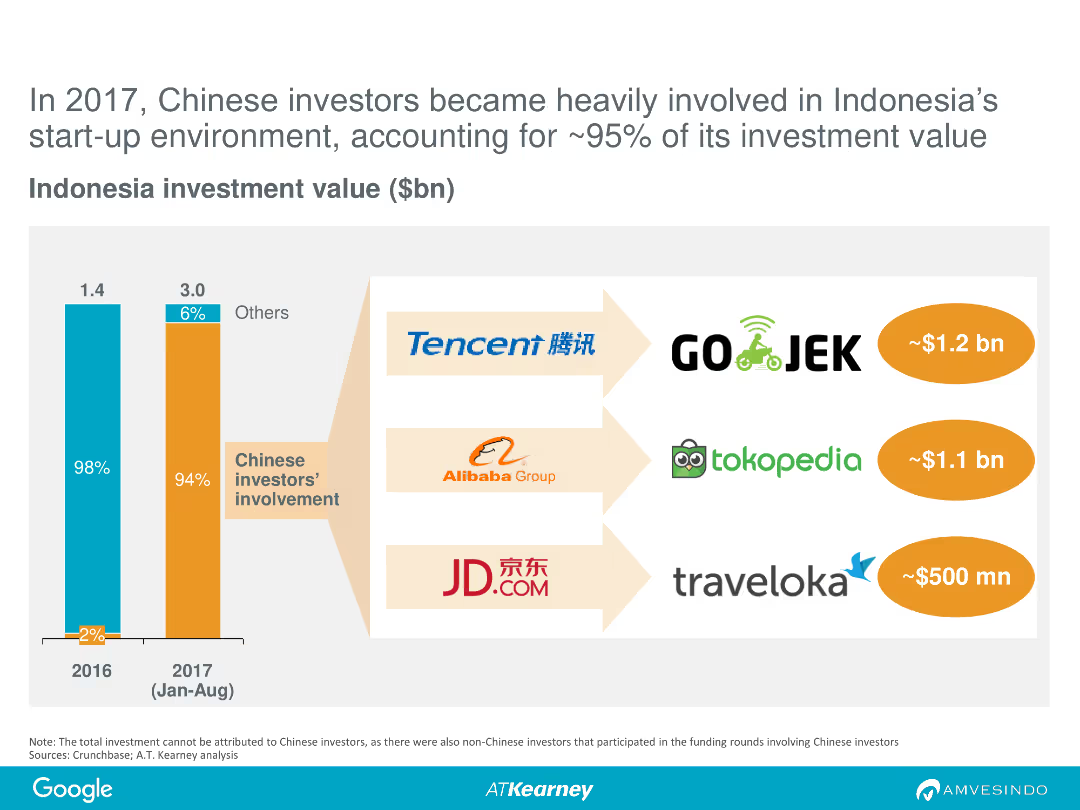
The slide features a column chart comparing investment values in Indonesia in 2016 and January-August 2017. It highlights the involvement of Chinese investors, with logos of major companies like Tencent, Alibaba, and JD.com.
Investment Analysis
Financial Services
This slide shows the significant involvement of Chinese investors in Indonesian start-ups, accounting for approximately 95% of investment value in 2017, showcasing major investment amounts from companies like Tencent and Alibaba.
Chinese investors, Indonesia, start-ups, investment, 2017, Tencent, Alibaba, JD.com
false
Investment Analysis
Financial Services financial-services
Multiple Chart
Kearney
View slide
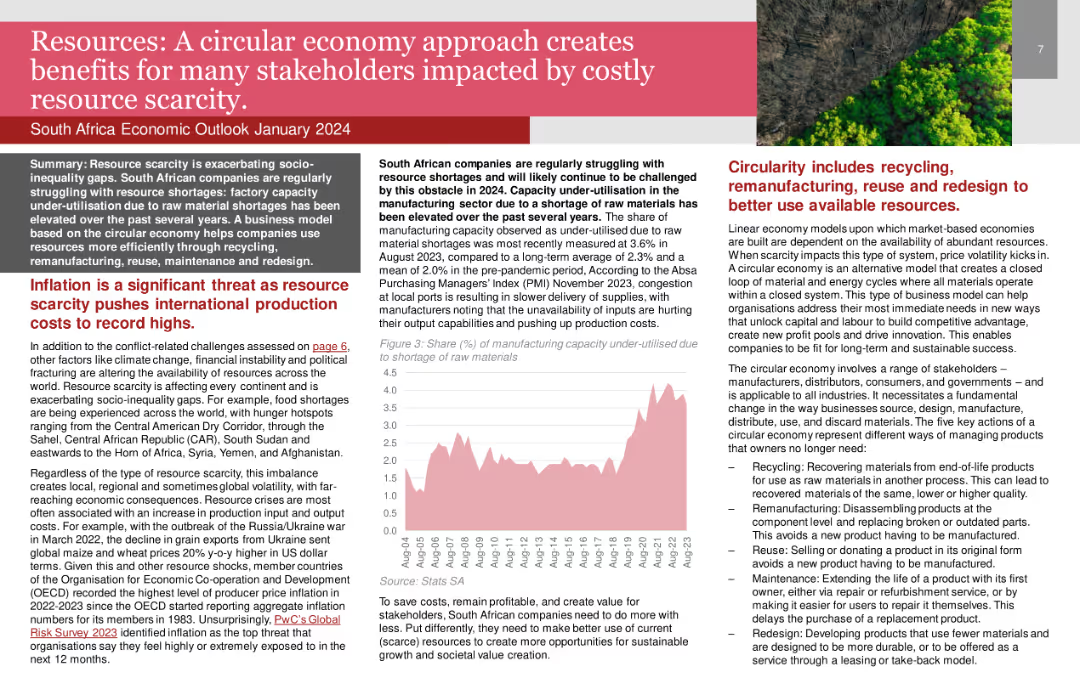
Line chart showing the share of manufacturing capacity under-utilised due to raw material shortages.
Strategic Planning
Environmental Services & Sustainability
Advocates for a circular economy approach to address resource scarcity and enhance sustainability in South Africa.
Circular Economy, Resource Scarcity, Sustainability, Manufacturing, South Africa
false
Strategic Planning
Environmental Services & Sustainability environmental-services-and-sustainability
Mixed Chart
PwC/Strategy&
View slide
The slide includes text explaining the circular carbon economy concept and a diagram illustrating the four Rs.
Technology and Digital Transformation
Energy & Utilities
This slide explains the circular carbon economy concept, including reducing, reusing, recycling, and removing carbon.
Circular carbon economy, GCC, hydrogen, policy, energy
false
Technology and Digital Transformation
Energy & Utilities energy-and-utilities
Diagram
Kearney
View slide
Displays diagrams and lists integrating circular intelligence into business operations, with focus areas like "Target & Performance Management" and "Measure & Monitor."
Technology and Digital Transformation
Environmental Services & Sustainability
Highlights how integrating circular intelligence can drive business value across various operational aspects. This slide is particularly useful for discussions on implementing circular strategies in business processes, enhancing data integration, and driving operational efficiencies.
Circular economy, Business intelligence, Data integration, Operational efficiency, Performance management, Sustainability, Technology integration, Business drivers, Monitoring, Reporting
false
Technology and Digital Transformation
Environmental Services & Sustainability environmental-services-and-sustainability
Linear Flow
Accenture
View slide
Lists key activities in making a product fully circular, with a case example of Timberland's transformation journey.
Product and Service Analysis
Environmental Services & Sustainability
Provides a roadmap for making a product fully circular, emphasizing the importance of starting small, learning, and scaling. Ideal for use in product development meetings or sustainability strategy sessions, focusing on practical steps and high-impact strategies for circular product design.
Circular economy, Timberland, Product design, Sustainability, High-impact strategy, Scaling, Learning, Circular transformation, Product lifecycle, Innovation
false
Product and Service Analysis
Environmental Services & Sustainability environmental-services-and-sustainability
Linear Flow
Accenture
View slide
The slide features a detailed process flow diagram illustrating the circular fashion ecosystem, with icons, text boxes, and arrows showing material flows and stages in the lifecycle of fashion products.
Strategic Planning
Retail & E-commerce
The slide provides an overview of the circular fashion ecosystem, detailing various stages from brands and designers to recycling, aiming to maximize utilization and reduce demand.
Circular fashion, Ecosystem, Recycling, Material flows, Fashion lifecycle
false
Strategic Planning
Retail & E-commerce retail-and-e-commerce
Diagram
Roland Berger
View slide
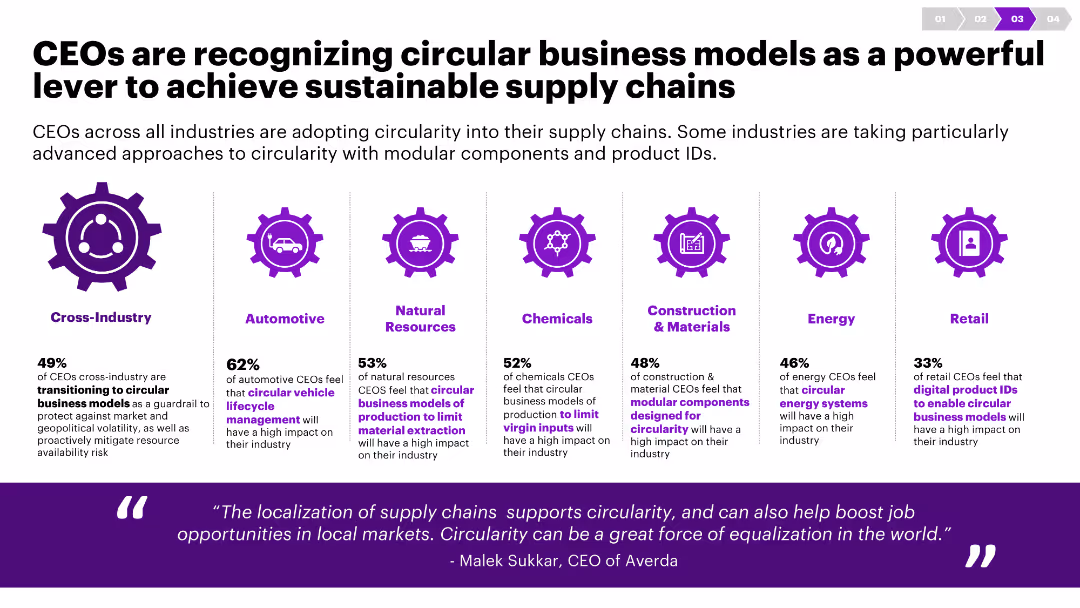
The slide uses icons and column charts to show data on the adoption of circular business models across various industries. It has a clean, balanced layout.
Strategic Planning
Environmental Services & Sustainability
This slide discusses how CEOs from different industries are integrating circular business models into their supply chains to enhance sustainability.
Circularity, CEOs, supply chain, sustainability, industry, business models, modular components, product IDs, transition, approach
false
Strategic Planning
Environmental Services & Sustainability environmental-services-and-sustainability
Pillar
Accenture
View slide
A title slide with a deep blue abstract background. Prominently features the Citi logo, title for the 'Earnings Results Presentation', and the date 'Third Quarter 2023'.
Industry Overview
Financial Services
Introduces Citigroup's earnings results for the third quarter of 2023, setting the stage for a detailed financial review and analysis to follow in the presentation.
Citi, earnings report, Q3 2023, financial services, presentation title, abstract background, company logo, date.
false
Industry Overview
Financial Services financial-services
Title
Citigroup
View slide
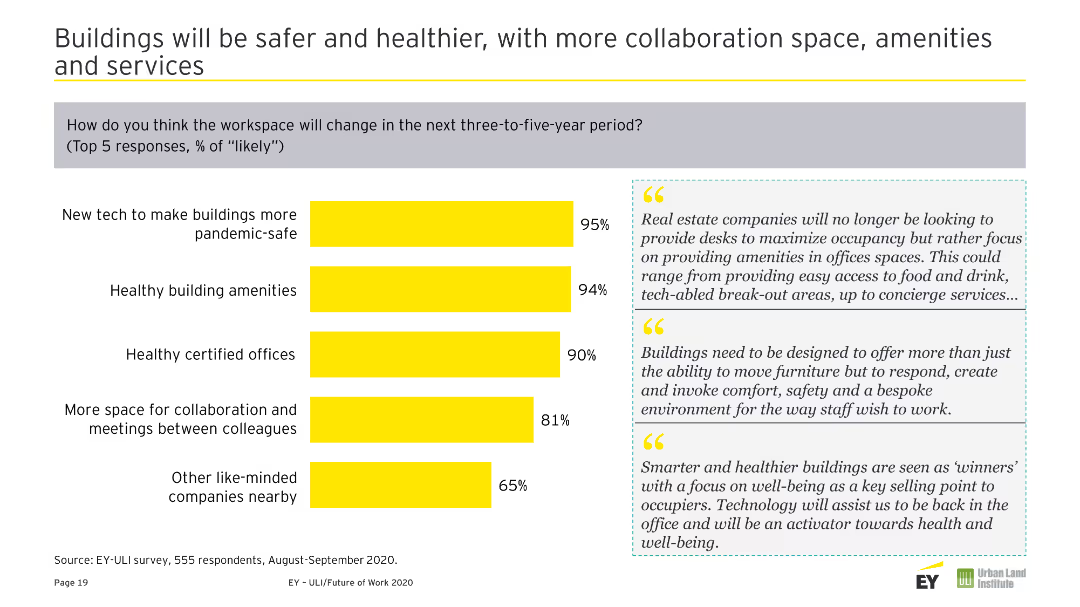
Column chart showing changes accelerated by COVID-19 on society. Includes two text quotes on the right in gray boxes. The slide is dominated by yellow and gray colors.
Strategic Planning
Real Estate & Construction
Discusses how the Future of Work puts pressure on urban development, necessitating better infrastructure and efficient local supply chains.
Cities, Communities, Infrastructure, Urban Development, COVID-19, Changes, Society, Future of Work, Pressures
false
Strategic Planning
Real Estate & Construction real-estate-and-construction
Mixed Chart
EY
View slide
Uses column charts to detail the growth in affluent client households and their deposits at Citi. The slide is clean and effectively uses color to differentiate data points, enhancing readability.
Market Analysis and Trends
Financial Services
Analyzes the expansion and deepening of Citigold services among affluent clients, showing growth in client numbers and investments over time, underlining successful market penetration and relationship deepening strategies at Citi.
Citigold, affluent clients, growth strategy, Citi, market penetration, investments, client relationships
false
Market Analysis and Trends
Financial Services financial-services
Multiple Chart
Citigroup
View slide
This slide features a column chart and bullet points detailing the CET1 ratio changes over time. The color scheme is consistent with previous slides, using shades of blue to represent different financial periods.
Regulatory and Compliance
Financial Services
This slide analyzes Citigroup's CET1 capital ratio, detailing the factors influencing its recent changes and regulatory requirements. It is aimed at investors and regulators to demonstrate compliance with capital adequacy standards and Citigroup's ongoing financial health.
Citigroup, CET1 Ratio, Regulatory Compliance, Capital Management, Financial Health, QoQ Analysis, Capital Adequacy, Governance
false
Regulatory and Compliance
Financial Services financial-services
Multiple Chart
Citigroup
View slide
The slide consists of various data visualizations including column charts, and a balance sheet summary. It utilizes blue and black colors for the graphics, and the layout is segmented to display different financial metrics.
Corporate Finance and Valuation
Financial Services
This slide offers an in-depth look at Citigroup's capital adequacy and balance sheet status, highlighting key financial ratios and the composition of assets and liabilities. It is instrumental for conveying the company's financial stability and capital management strategies to informed stakeholders.
Citigroup, Capital Overview, Balance Sheet, Risk-based Metrics, Liquidity, Leverage, Assets, Liabilities, Financial Stability
false
Corporate Finance and Valuation
Financial Services financial-services
Multiple Chart
Citigroup
View slide
A comprehensive slide with pie charts and data points that break down credit distribution by segments, FICO scores, and regional exposure. The use of blue and black color segments in the charts aligns with Citigroup's branding.
Risk Assessment and Management
Financial Services
The slide presents an overview of Citigroup's consumer and corporate credit distribution, showcasing the company's credit risk management strategies and the diversity of its credit portfolio. It is designed to communicate credit risk profiles to stakeholders and illustrate the company's financial resilience.
Citigroup, Credit Overview, Consumer Credit, Corporate Lending, FICO Score, Regional Exposure, Credit Management, Risk Analysis
false
Risk Assessment and Management
Financial Services financial-services
Multiple Chart
Citigroup
View slide
This slide has a mix of text and data presentations, including a column chart and several key financial metrics listed in a blue and white theme. The chart visualizes financial trends over quarters, with annotations for significant changes or highlights.
Financial Performance
Financial Services
A detailed review of Citigroup's financial results for the quarter, including revenue, expenses, and net income. It is likely intended for stakeholders interested in understanding the company's financial health and performance over time, with a focus on quarterly trends and key financial highlights.
Citigroup, Financial Overview, Q2, Revenues, Expenses, Net Income, Diluted EPS, RoE, RoTCE, Capital Ratio, Performance Analysis
false
Financial Performance
Financial Services financial-services
Mixed Chart
Citigroup
View slide
A slide dense with column charts and statistical data comparing net interest income, average loans, and deposits over multiple quarters. It has a clear label for each chart and section, using contrasting colors to distinguish between different financial aspects.
Financial Performance
Financial Services
This slide provides detailed financial data on Citigroup's net interest income, loan distributions, and deposit trends. It is a tool for financial analysis, giving stakeholders insight into the company's earnings from interest and the status of its loan and deposit portfolios.
Citigroup, Net Interest Income, Average Loans, Deposits, QoQ, YoY, Financial Data, Banking, Revenue Streams, Portfolio Analysis
false
Financial Performance
Financial Services financial-services
Multiple Chart
Citigroup
View slide
A slide with column chart and bullet points detailing quarter-on-quarter and year-on-year expenses. The slide also includes key investment themes and adds context to the financial figures presented.
Operational Efficiency
Financial Services
Details Citigroup's financial expenditures and investments for Q3 2023, allowing for operational assessment and strategic financial planning.
Citigroup, Q3 2023, expenses, investments, quarter-on-quarter, year-on-year, bar graphs, operational efficiency, bullet points, text.
false
Operational Efficiency
Financial Services financial-services
Mixed Chart
Citigroup
View slide
A column chart and text combine to provide a visual breakdown of expenses and investment themes. Blue bars represent quantitative data while a sidebar lists investment themes with associated icons. The layout is structured to facilitate comparison and trend analysis.
Operational Efficiency
Financial Services
This slide compares quarter-on-quarter and year-on-year expenses for Citigroup, with an emphasis on how investments and strategic initiatives have contributed to these financial figures. It is useful for illustrating financial prudence and investment impact on the company's operations.
Citigroup, QoQ, YoY, Expenses, Investment Themes, Operational Efficiency, Platform Simplification, Security, Client Experience
false
Operational Efficiency
Financial Services financial-services
Mixed Chart
Citigroup
View slide
Complex slide with multiple data points including bar graphs and textual information. Presents financial highlights such as revenues, net income, and EPS, with color-coded sections for different business units.
Financial Performance
Financial Services
Snapshot of Citigroup's financial performance for Q3 2023, including revenue, net income, and earnings per share. Details on various business sectors like ICG, PBWM, and Legacy provide a comprehensive overview for financial analysis.
Citigroup, financial results, Q3 2023, revenue, net income, EPS, business segments, performance snapshot, bar graphs, text.
false
Financial Performance
Financial Services financial-services
Table
Citigroup
View slide
Slide featuring a combination of column charts depicting net interest income, average loans, and deposits. Includes numerical data and percentage changes with notes at the bottom for additional context.
Financial Performance
Financial Services
Provides a financial analysis of Citigroup's interest income, loan distribution, and deposit trends for Q3 2023, essential for evaluating the company's financial health and making investment decisions.
Citigroup, net interest income, loans, deposits, Q3 2023, financial analysis, bar graphs, column charts, percentage changes, notes.
false
Financial Performance
Financial Services financial-services
Multiple Chart
Citigroup
View slide
A text-heavy slide divided into three sections titled 'Transformation', 'Strategic Execution', and 'Culture and Talent'. Bullet points describe key achievements and strategic actions within each area.
Strategic Planning
Financial Services
Showcases Citigroup's strategic priorities and progress made in the third quarter of 2023, touching on technology, strategic partnerships, and talent management. Intended for corporate strategy development and stakeholder communication.
Citigroup, strategic priorities, Q3 2023, transformation, strategic execution, culture, talent management, bullet points, text.
false
Strategic Planning
Financial Services financial-services
Table
Citigroup
View slide
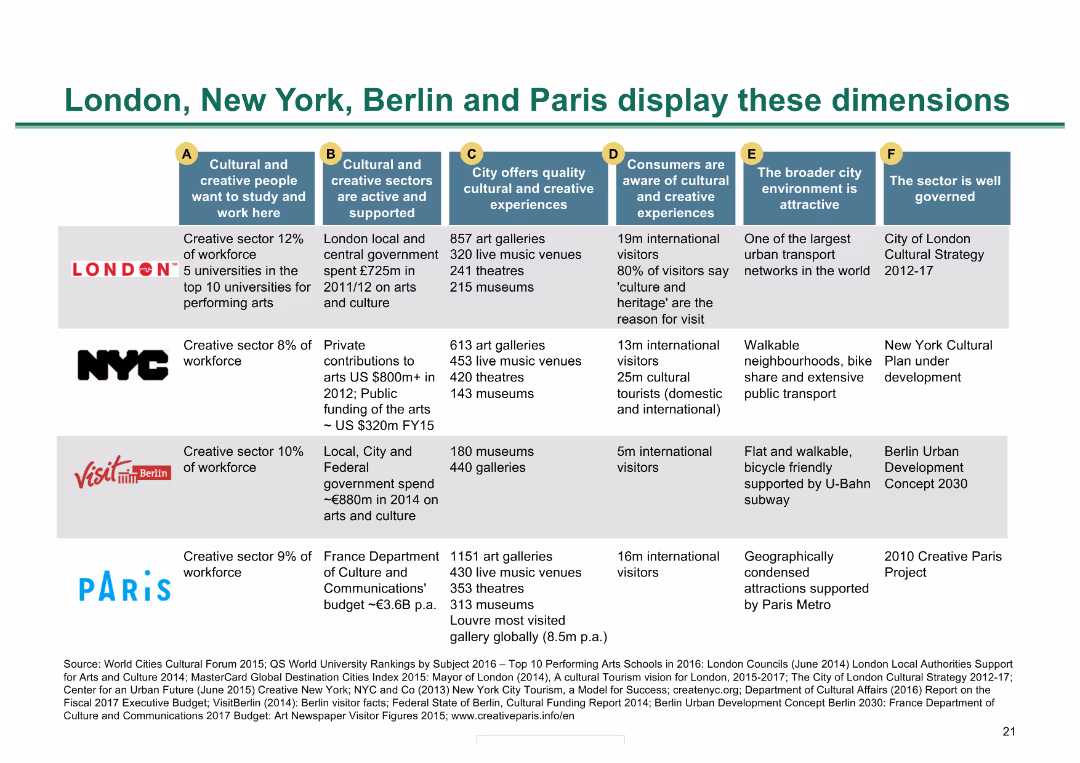
Table comparing cultural metrics across four major cities; color-coded for clarity
Market Analysis and Trends
Hospitality & Tourism
Compares cultural and creative metrics of London, New York, Berlin, and Paris, showing strengths and metrics
City comparison, cultural metrics, global cities, creative sectors, cultural experiences
false
Market Analysis and Trends
Hospitality & Tourism hospitality-and-tourism
Diagram
BCG
View slide
Consists of a world map, key facts list, and a pie chart showing sales distribution. The slide is visually dense with a high level of detail.
Operational Efficiency
Technology & Software
Provides an overview of Clarion's global presence, focusing on sales by region and the distribution of its manufacturing and development centers, emphasizing the company's operational scope.
Clarion, global, sales, manufacturing, development, automotive
false
Operational Efficiency
Technology & Software technology-and-software
Mixed Chart
Deutsche Bank
View slide
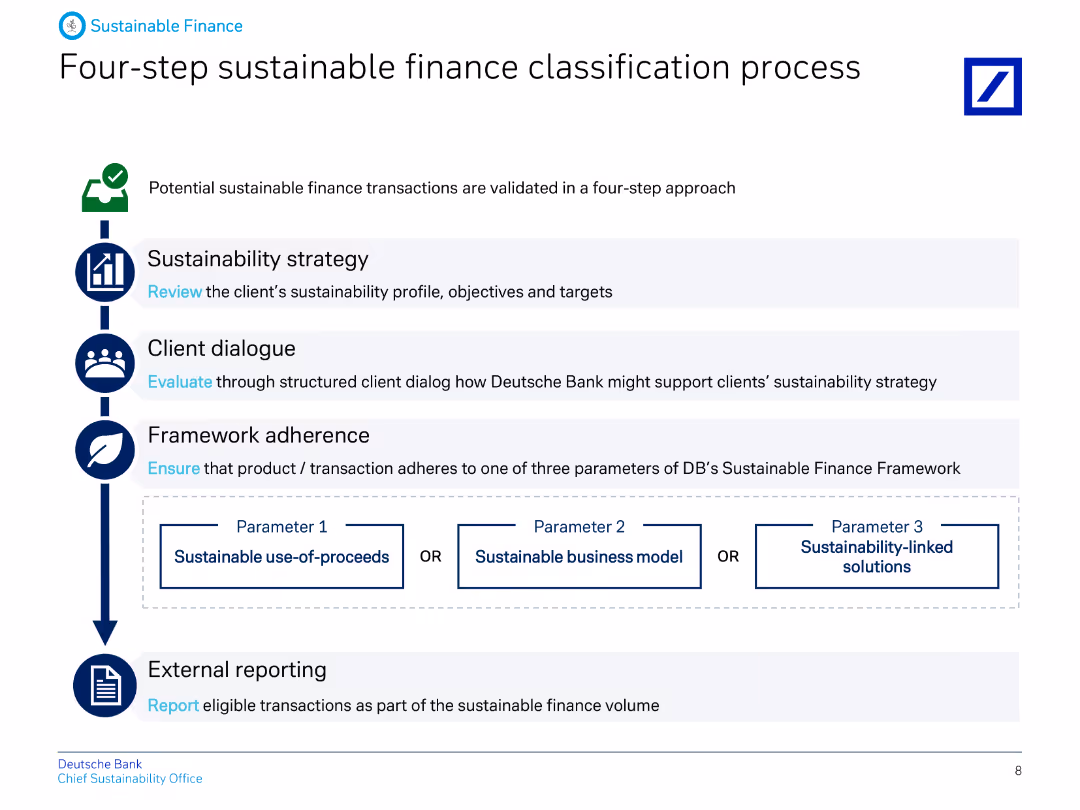
The slide features a flowchart with four steps: Sustainability strategy, Client dialogue, Framework adherence, and External reporting, with icons for each step.
Operational Efficiency
Financial Services
Describes the four-step process for classifying sustainable finance transactions at Deutsche Bank, ensuring adherence to their framework and validating through external reporting.
Classification, sustainable, finance, process, strategy, client, framework, reporting, banking, ESG
false
Operational Efficiency
Financial Services financial-services
Vertical Flow
Deutsche Bank
View slide
Three pie charts depict the composition of IBKR’s client base, commissions, and client equity.
Client Case Studies
Financial Services
Exhibits the diversity of IBKR’s client base and revenue sources, using pie charts to show the distribution of accounts, commissions, and equity.
Client Base, Interactive Brokers, Commissions, Client Equity, Pie Charts, Diversification, Revenue Sources, Market Segments
false
Client Case Studies
Financial Services financial-services
Multiple Chart
Goldman Sachs
View slide
Features a central hub-and-spoke diagram linking various strategies and tools aimed at enhancing client coverage, surrounded by relevant data points.
Operational Efficiency
Financial Services
Discusses the development and enhancement of JPMorgan’s client coverage team, emphasizing training, tools, and insights that lead to increased productivity and market understanding.
Client Coverage, Training, Productivity, Banking, Tools, Insights, Market Understanding
false
Operational Efficiency
Financial Services financial-services
Framework
JP Morgan
View slide
Includes a column chart with a 1.0 and 1.4 ratio, surrounded by a circular arrow diagram, and includes key performance ranks.
Performance Metrics and KPIs
Financial Services
Emphasizes the franchise collaboration model's success and its impact on generating additional revenue from clients.
Client Experience, Collaboration, Revenue Growth, IB Corporate Clients, Multiplier Effect
false
Performance Metrics and KPIs
Financial Services financial-services
Single Chart
JP Morgan
View slide
Contains a circular diagram with icons representing the firm's strengths, supplemented by text descriptions around the diagram's perimeter.
Strategic Planning
Financial Services
Articulates the unique position of the firm to support clients with their strengths, emphasizing on client experience.
Client Experience, Differentiation, Talent, Balance Sheet, Innovation, Strategic Integration
false
Strategic Planning
Financial Services financial-services
Linear Flow
JP Morgan
View slide
Central diamond-shaped diagram with four quadrants, each labeling a business division, paired with a side panel listing client types.
Financial Performance
Financial Services
Highlights the company's comprehensive approach to client services across different business divisions, aligning with strategic client management.
Client Focus, Goldman Sachs, Business Divisions, Client Services, Strategy, Diagram
false
Financial Performance
Financial Services financial-services
Framework
Goldman Sachs
Previous
Loading...
Hold On!
We are searching in our database
If nothing, comes up, please try different filters!
Column Chart
Heatmap
Chevron
Org Chart
Infographic
Callouts
Timeline
List
Graphic
Picture
Process Flow
Diagram
Paragraph
Map
Table
Framework
Subtitle
Takeaway Box
Icon
Other Chart
Radar Chart
Waterfall Chart
Mekko Chart
Pie Chart
Scatter Plot
Line Chart
Bar chart
Bullet points
Create a FREE account to continue browsing
Receive Instant Access to 1,000+ slides from companies like McKinsey, Google, and Goldman Sachs
First Name
Last Name
Email
Password
I agree to all
Terms & Privacy Policy
Thank you! Your submission has been received!
Oops! Something went wrong while submitting the form.
Have an account?
Sign in
Upgrade to PRO to Save slides
Advanced Search and Filters
Access to 15,000+ slides
Access to Category Pages
Save/Bookmark Slides
PowerPoint Template Library
Pick a Plan
MONTHLY
$12/month
Billed every month, Cancel anytime.
YEARLY
$9/year
Billed $108 annually, Cancel anytime.
Checkout for $12/month
Checkout for $108/yr
Secured by Stripe | AES-256 bit encryption