My Account
My Slides
Search by Category
Templates
View All Templates
Download Template Slides
Leave Feedback
Login
Logout
Get Started
Browse all Slides
Browse all Slides
Create a FREE Account
Instant access to 1,000+ real slides from top companies like McKinsey, BCG, Goldman Sachs, Google and many more!
First Name
Last Name
Email
Password
I agree to all
Terms & Privacy Policy
Thank you! Your submission has been received!
Oops! Something went wrong while submitting the form.
Have an account?
Sign in
Spark Your Next Big Idea with New Presentation Templates
VIEW ALL Templates
Welcome,
Welcome
PRO
Show Featured Only
Checkbox 8
Companies
Mckinsey
Bain
BCG
EY
Deloitte
Accenture
PwC/Strategy&
JP Morgan
Goldman Sachs
Morgan Stanley
Citigroup
Deutsche Bank
Barclays
LEK
KPMG
Kearney
Oliver Wyman
Booz Allen Hamilton
Gartner
IPSOS
Nielsen
Slide type
Text Only
Linear Flow
Vertical Flow
Single Chart
Header Horizontal
Mixed Chart
Header Vertical
Pillar
Multiple Chart
Graphic
Agenda
Title
Table
Framework
Industry
Technology & Software
Artificial Intelligence
Financial Services
Retail & E-commerce
Consumer Goods
Industrial & Manufacturing
Transportation & Logistics
Telecommunications
Real Estate & Construction
Hospitality & Tourism
Professional Services
Education & Training
Media & Entertainment
Agriculture & Food Production
Healthcare & Pharmaceuticals
Environmental Services & Sustainability
Government & Public Sector
Use Case
Mergers and Acquisitions
Performance Metrics and KPIs
Client Case Studies
Competitive Landscape
Corporate Finance and Valuation
Product and Service Analysis
Customer and Market Segmentation
Organizational Structure and Change
Industry Overview
Regulatory and Compliance
Risk Assessment and Management
Investment Analysis
Organizational Structure and Change
Human Resources and Talent Management
Financial Performance
Market Analysis and Trends
Sales and Business Development
Human Resources and Talent Management
Clear all
Thank you! Your submission has been received!
Oops! Something went wrong while submitting the form.
Tag
View slide
This introductory slide features a circular diagram with four segments around a central label 'Clients', designed with shades of blue and black. Brief texts accompany icons symbolizing trust, client-centricity, and global reach.
Organizational Structure and Change
Financial Services
Introduces the company's focus on client relationships and outlines the core areas of service. It sets the stage for discussions on company values, structure, or strategic direction.
Client Relations, Core Services, Company Values
false
Organizational Structure and Change
Financial Services financial-services
Framework
Goldman Sachs
View slide
Column charts, detailing client relationship data.
Strategic Planning
Financial Services
Discusses improvement in client share and ranking in global financial markets.
Client Relationships, Market Ranking, Financial Markets, Improvement, Analysis
false
Strategic Planning
Financial Services financial-services
Multiple Chart
Barclays
View slide
Slide with title, with an arrow, and three sections of text outlining the initial phase, client feedback, and the forward plan for expanding client relationships.
Strategic Planning
Financial Services
Showcases the strategic plan to enhance client service by identifying complex needs, gathering feedback, and planning for client expansion, supported by dedicated professionals.
Client Service, Strategic Plan, Feedback, Expansion, Professional Support
false
Strategic Planning
Financial Services financial-services
Linear Flow
Goldman Sachs
View slide
The slide presents text boxes with services offered, such as managing investments and navigating financial markets, paired with simple icons.
Client Case Studies
Professional Services
It showcases the range of client services provided, likely for marketing or sales presentations.
Client Services, Investments, Financial Markets, Mortgage, Insurance, Super Funds, Advice
false
Client Case Studies
Professional Services professional-services
Boxed
Goldman Sachs
View slide
Uses a vertical flow diagram to depict the integration and enhancements in client solutions, with emphasis on digital transformation and payment solutions.
Technology and Digital Transformation
Financial Services
Describes JPMorgan’s initiatives to adapt and expand its client solutions, focusing on digital platforms like InstaMed and payment optimization, aimed at enhancing client engagement and satisfaction.
Client Solutions, Digital Transformation, Payments, Innovation, Engagement, Satisfaction
false
Technology and Digital Transformation
Financial Services financial-services
Header Horizontal
JP Morgan
View slide
Featuring pie charts and a column chart, this slide focuses on client transaction frequencies and wallet composition across fee sizes.
Client Case Studies
Financial Services
The slide assesses the frequency of large episodic transactions for clients and the annual wallet composition by transaction size.
Client Transactions, Frequency, Pie Chart, Wallet Composition, Episodic Transactions, Fee Size, Financial Services
false
Client Case Studies
Financial Services financial-services
Multiple Chart
JP Morgan
View slide
Step-by-step bars showing current to future growth in client assets with a goal of $10Tn. Uses blue highlights and a dotted line to indicate the pathway.
Strategic Planning
Financial Services
Depicts Morgan Stanley's strategic goal for client asset growth, presenting a roadmap to reach a $10 trillion long-term target.
Client assets, growth strategy, long-term goals, Morgan Stanley, $10Tn, strategic roadmap, wealth management
false
Strategic Planning
Financial Services financial-services
Single Chart
Goldman Sachs
View slide
This slide features a doughnut chart and a pie chart, with a significant amount of textual information in bullet points. The color scheme is blue and white, and the design is sleek and corporate.
Customer and Market Segmentation
Financial Services
The slide focuses on the engagement levels of Chase's primary business banking clients, illustrating satisfaction rates and product adoption. It’s meant to emphasize the bank's success in maintaining client relationships and fostering loyalty.
Client engagement, Business banking, Chase, Satisfaction rate, Loyalty, Product adoption, Relationship management, Market segmentation
false
Customer and Market Segmentation
Financial Services financial-services
Mixed Chart
JP Morgan
View slide
The slide presents a simple two-column comparison of actions and future directions with respect to the client franchise in FICC and Equities. A dark theme with white and blue text highlights the top 100 clients' attributes and planned actions.
Sales and Business Development
Financial Services
It discusses strategies for strengthening client relationships in FICC and Equities, appropriate for discussions on client management and business development.
Client franchise, FICC, Equities, growth plan
false
Sales and Business Development
Financial Services financial-services
Table
Goldman Sachs
View slide
Slide features a four-section comparison with icons, lists, and a color-coded column chart showing revenue.
Market Analysis and Trends
Financial Services
Highlights the strengths of different client franchises and their market leadership positions.
Client franchises, community banking, investment bank, asset management, revenue
false
Market Analysis and Trends
Financial Services financial-services
Mixed Chart
JP Morgan
View slide
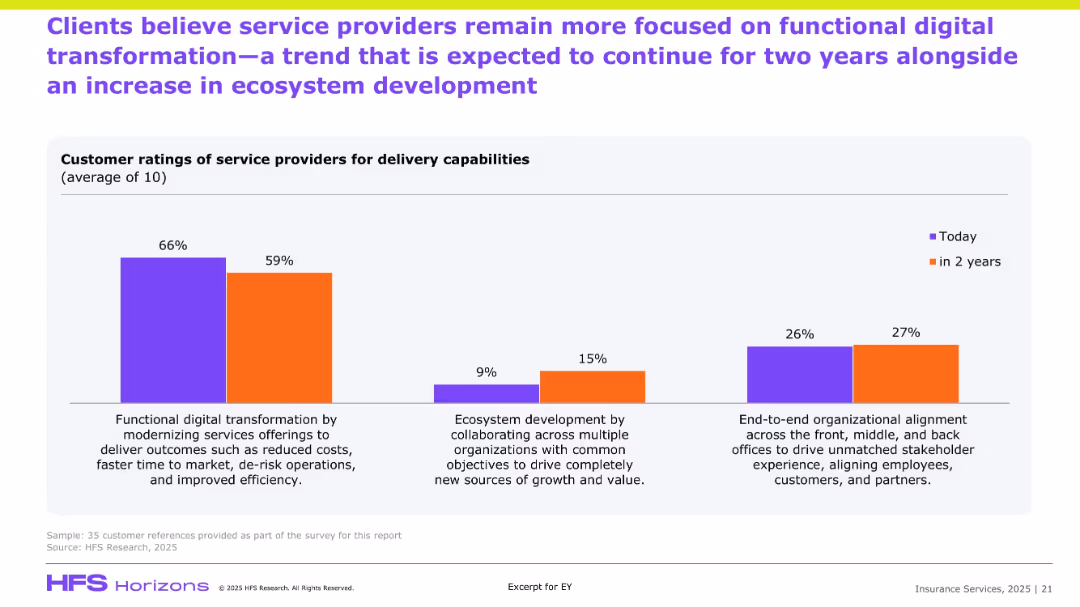
Bar graph comparing “Today” vs “In 2 Years” sentiment; three focus areas; explanatory text at bottom.
Customer and Market Segmentation
Financial Services
The slide presents survey data on clients’ current and expected focus areas for service providers. The data shows a shift from heavy focus on functional digital transformation to increased attention on ecosystem development and organizational alignment. It captures client sentiment on the delivery capabilities expected over the next two years.
Client ratings, delivery, transformation, ecosystem, efficiency, stakeholder alignment
false
Customer and Market Segmentation
Financial Services financial-services
Single Chart
EY
View slide
The slide has a bar chart showing client retention rate, and two pie charts displaying revenue distribution by clients and by country and region.
Client Case Studies
Professional Services
This slide highlights the high client retention rate (>99%) and the distribution of revenue by client and geography for the year 2022.
Client retention, revenue, pie chart, bar chart, geography
false
Client Case Studies
Professional Services professional-services
Multiple Chart
IPSOS
View slide
Contains a circular flow diagram illustrating various aspects of client coverage, such as market insights and workflow optimization, accompanied by icons and a key indicating outcomes like client satisfaction.
Strategic Planning
Financial Services
Depicts the strategy and analytics used in client coverage teams for performance improvement.
Client, coverage, analytics, market, training, insights, performance, banking, strategy
false
Strategic Planning
Financial Services financial-services
Diagram
JP Morgan
View slide
A horizontal process diagram illustrates the client experience from solutioning through onboarding, lending, servicing, to content delivery, complemented by performance and efficiency icons.
Operational Efficiency
Financial Services
Focuses on operational excellence and client experience through various banking services.
Client, experience, KYC, lending, servicing, operational, excellence, onboarding, banking
false
Operational Efficiency
Financial Services financial-services
Linear Flow
JP Morgan
View slide
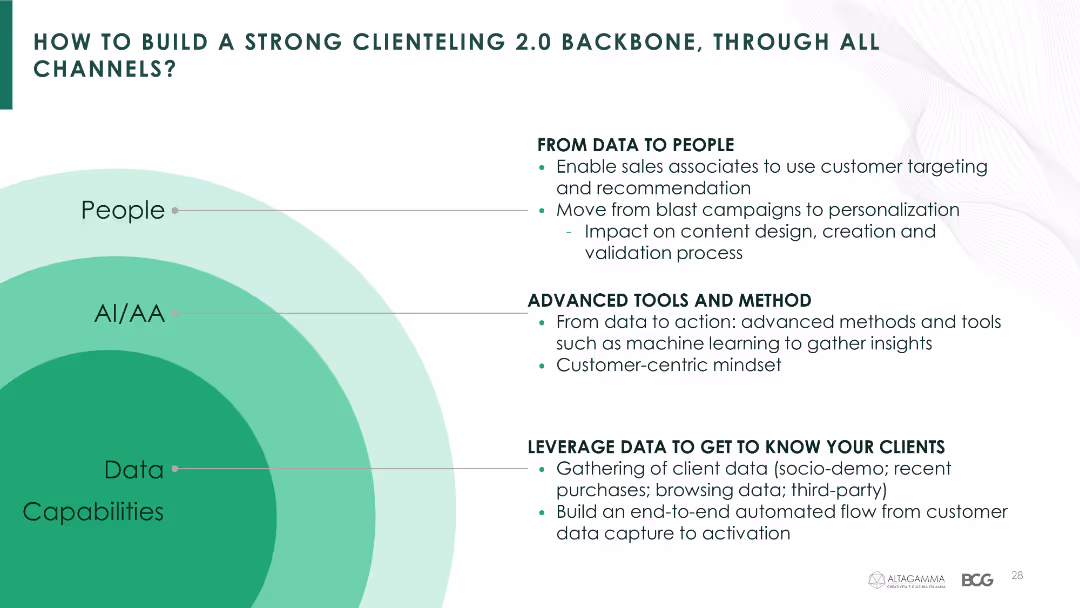
This slide uses a layered diagram with sections labeled 'People', 'AI/AA', and 'Data Capabilities' to illustrate the components of clienteling.
Strategic Planning
Retail & E-commerce
The slide explains how to build a clienteling backbone using data, advanced tools, and personalized recommendations, aimed at improving customer relationships across channels.
Clienteling, data, AI, recommendations, tools, customer-centric, insights, personalization, engagement
false
Strategic Planning
Retail & E-commerce retail-and-e-commerce
Diagram
BCG
View slide
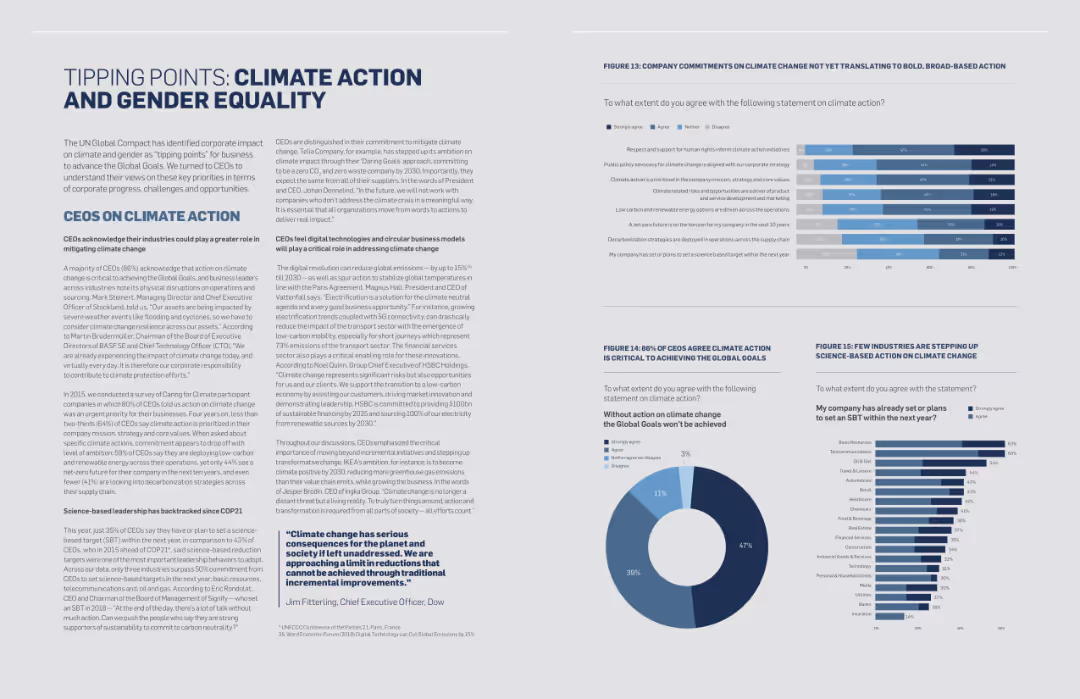
The slide contains text and several column charts depicting survey data on climate action and gender equality. Quotes from CEOs are also included.
Regulatory and Compliance
Environmental Services & Sustainability
The slide addresses the critical points of climate action and gender equality, presenting survey data and CEO quotes to highlight the importance of these issues for sustainable development.
Climate Action, Gender Equality, Sustainability, Survey Data, CEO Quotes, Regulatory Compliance
false
Regulatory and Compliance
Environmental Services & Sustainability environmental-services-and-sustainability
Multiple Chart
Accenture
View slide
Slide is text-heavy with bullet-point recommendations for organizations on climate action. Features three circular green icons, representing different strategies like frameworks, plans, and education.
Strategic Planning
Environmental Services & Sustainability
Provides strategic recommendations for organizations aiming to enhance their environmental sustainability efforts, including planning, education, and framework adoption.
Climate Action, Strategic Recommendations, Sustainability, Organizational Planning, Education, Frameworks
false
Strategic Planning
Environmental Services & Sustainability environmental-services-and-sustainability
Header Vertical
Deloitte
View slide
This slide presents a dense layout with a multi-bar chart comparing global and country-specific data from 2010 and 2020. It has a clear title and captions, with significant use of orange and black to distinguish data points.
Market Analysis and Trends
Environmental Services & Sustainability
This slide provides an analysis of how climate change opportunities are perceived in different economies, with an emphasis on the growing acceptance in China. It offers insights into international views on environmental initiatives and is likely used in global sustainability strategy meetings or environmental impact assessments.
Climate Change, Economies, Global, China, Opportunities, Environment, Strategy, Acceptance, Assessment
false
Market Analysis and Trends
Environmental Services & Sustainability environmental-services-and-sustainability
Single Chart
PwC/Strategy&
View slide
The slide includes text blocks, a supporting image, and a bar chart. The visual complexity is moderate, with an emphasis on readability and structured information presentation.
Risk Assessment and Management
Environmental Services & Sustainability
This slide discusses the impact of climate change on business operations, including risks to cost profiles, supply chains, and physical assets, supported by survey data.
Climate Change, Impact, Risk, Business, Survey
false
Risk Assessment and Management
Environmental Services & Sustainability environmental-services-and-sustainability
Mixed Chart
PwC/Strategy&
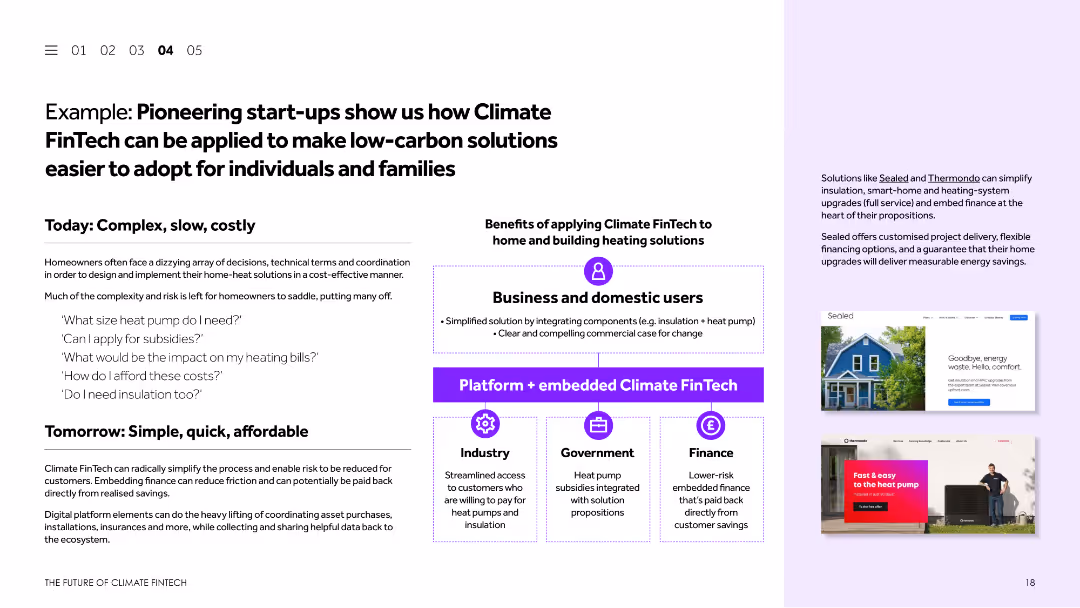
View slide
This slide uses a combination of text and images to present a case study. It discusses how Climate FinTech can simplify the adoption of low-carbon solutions for individuals and families. Visual elements include screenshots of relevant websites and a diagram explaining the process.
Client Case Studies
Financial Services
The slide presents a case study showcasing how Climate FinTech can make low-carbon solutions more accessible for individuals and families. It highlights examples of pioneering start-ups, their solutions, and the benefits of applying Climate FinTech to home and building heating solutions.
Climate FinTech, case study, low-carbon solutions, start-ups, home heating
false
Client Case Studies
Financial Services financial-services
Boxed
Barclays
View slide
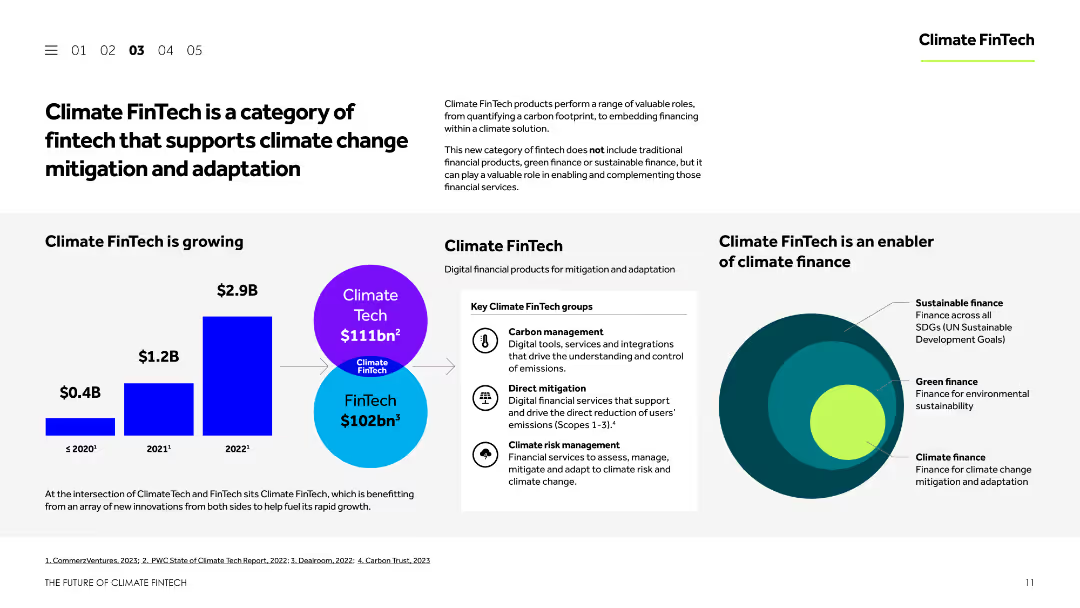
This slide features a balanced layout with text, images, and charts. It explains the concept of Climate FinTech, showcases its growth, and identifies key groups within this sector. The visual elements include a column chart and a Venn diagram.
Technology and Digital Transformation
Financial Services
The slide introduces Climate FinTech, describing its role in supporting climate change mitigation and adaptation. It highlights the growth of Climate FinTech, the main groups within the sector, and the types of digital financial products available for mitigation and adaptation.
Climate FinTech, climate change, mitigation, adaptation, digital finance
false
Technology and Digital Transformation
Financial Services financial-services
Mixed Chart
Barclays
View slide
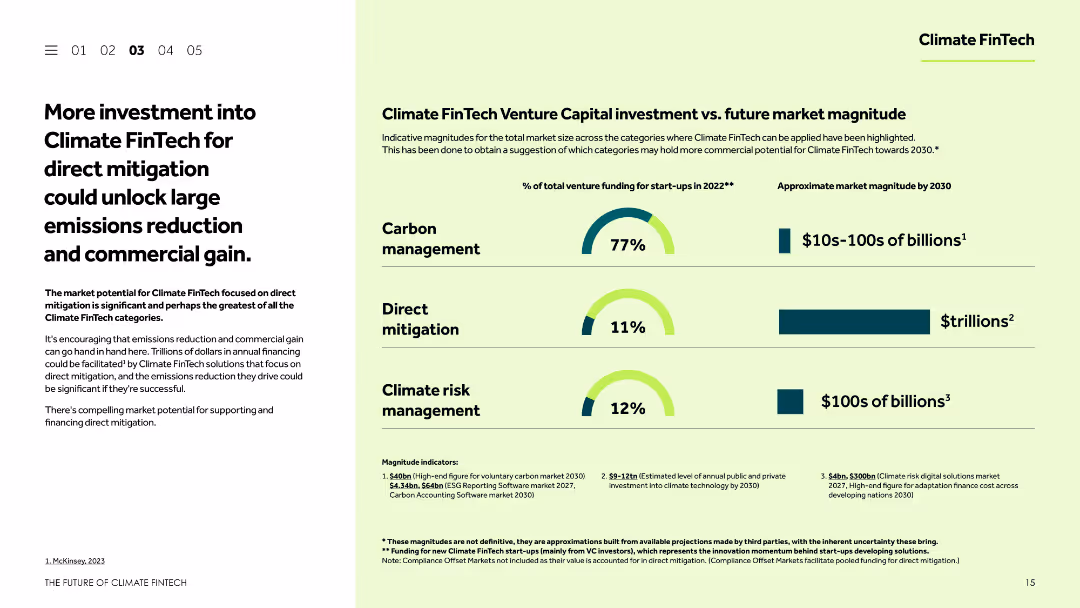
This slide combines textual content with visual elements such as column charts and icons. It discusses the market potential for Climate FinTech focused on direct mitigation, comparing current investment levels with future market opportunities.
Strategic Planning
Financial Services
The slide emphasizes the need for increased investment in Climate FinTech for direct mitigation, highlighting the potential for significant emissions reduction and commercial gain. It compares current venture funding with projected market opportunities to underscore the benefits of such investments.
Climate FinTech, direct mitigation, investment, emissions reduction, market potential
false
Strategic Planning
Financial Services financial-services
Multiple Chart
Barclays
View slide
This slide is a timeline with visuals representing the company's strategy to achieve net-zero climate impact by 2030. It includes a bar chart showing the baseline and target reductions in greenhouse gas emissions. The visuals and text are well-organized and provide clear targets and strategies, using a palette of blue, white, and gray.
Corporate Finance and Valuation
Environmental Services & Sustainability
Outlines the company's commitment and strategic plan for reducing its climate impact, with targets set for 2025 and 2030. It's used to communicate the environmental goals and milestones to stakeholders, demonstrating the company's sustainability efforts and progress.
Climate Impact, Net-zero Strategy, Greenhouse Gas Reduction, Sustainability Goals, Environmental Commitment
false
Corporate Finance and Valuation
Environmental Services & Sustainability environmental-services-and-sustainability
Mixed Chart
McKinsey
View slide
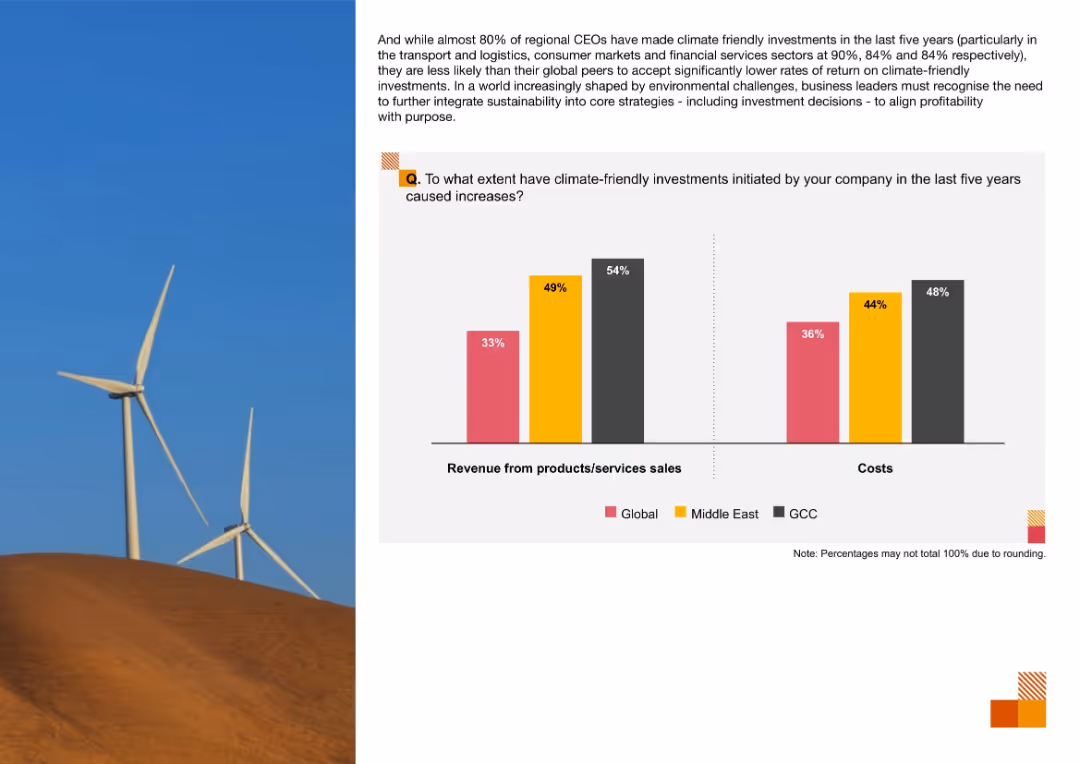
Two-bar chart for revenue and cost impacts from climate-friendly investments, comparing Global, Middle East, and GCC; wind turbines on left
Operational Efficiency
Environmental Services & Sustainability
The slide analyzes financial outcomes of climate investments, showing higher reported revenue and cost impacts in the GCC and Middle East compared to global figures.
Climate Investments, Revenue Impact, Cost Increases, Sustainability, Middle East, GCC, Environmental Strategy
false
Operational Efficiency
Environmental Services & Sustainability environmental-services-and-sustainability
Mixed Chart
PwC/Strategy&
View slide
Column charts and tables showing survey results on climate and environmental risk priorities, with a focus on changes expected in the next three years.
Risk Assessment and Management
Financial Services
The slide examines the increasing importance of climate and environmental risks for CROs, detailing priority shifts and the need for better risk management practices.
Climate Risk, Environmental Risk, Priorities, Survey Results
false
Risk Assessment and Management
Financial Services financial-services
Multiple Chart
EY
View slide
The slide features a circle divided into transition and adaptation plan sectors and three-dimensional columns representing scopes of CO2 emissions.
Strategic Planning
Industrial & Manufacturing
This slide outlines Michelin's climate strategy with a focus on transitioning towards net-zero emissions by 2050, including the adaptation plan and emissions scope.
Climate Strategy, Net-Zero Emissions, Transition Plan, Adaptation Plan, Michelin, Sustainability, CO2 Emissions, 2050 Target, Corporate Strategy, Decarbonization
false
Strategic Planning
Industrial & Manufacturing industrial-and-manufacturing
Framework
Morgan Stanley
View slide
Includes icons, a bar chart, and comprehensive text to explain the data. Color scheme includes shades of green and blue.
Regulatory and Compliance
Environmental Services & Sustainability
Surveys CXO attitudes towards climate change and action, showing both personal impact and corporate responses.
Climate action, CXO views, corporate response, personal impact
false
Regulatory and Compliance
Environmental Services & Sustainability environmental-services-and-sustainability
Multiple Chart
Deloitte
View slide
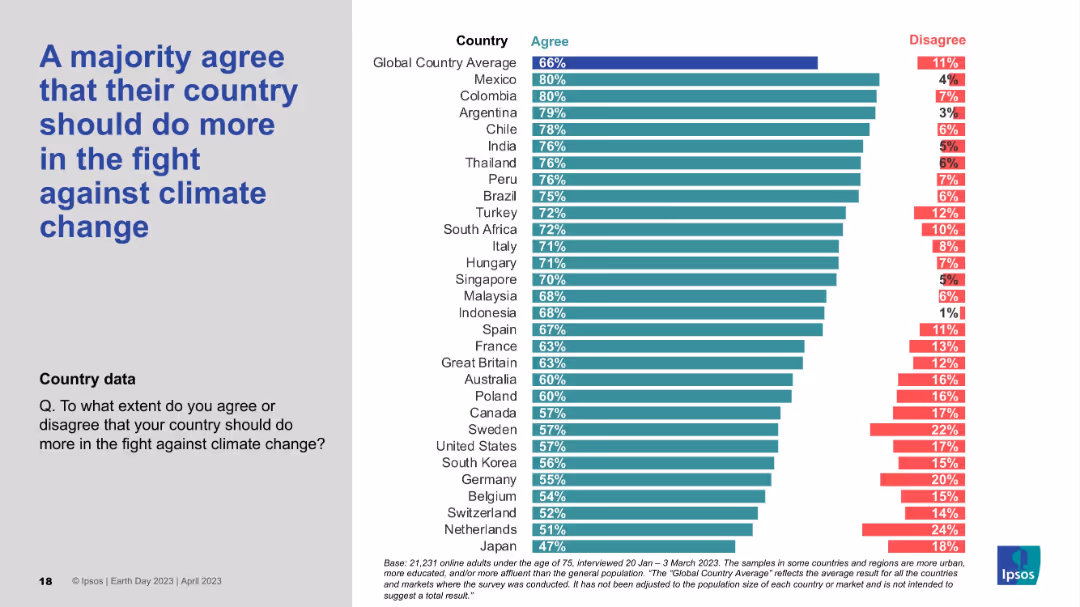
Agreement-disagreement bar chart by country; title on left and list of countries with response percentages on right.
Strategic Planning
Government & Public Sector
This slide captures a strong global consensus that countries should do more in the fight against climate change. Over 66% globally agree, with LATAM countries like Mexico, Colombia, and Argentina showing the highest urgency. Japan and several EU nations show lower agreement.
Climate action, National responsibility, Public opinion, Ipsos, Global urgency
false
Strategic Planning
Government & Public Sector government-and-public-sector
Mixed Chart
IPSOS
View slide
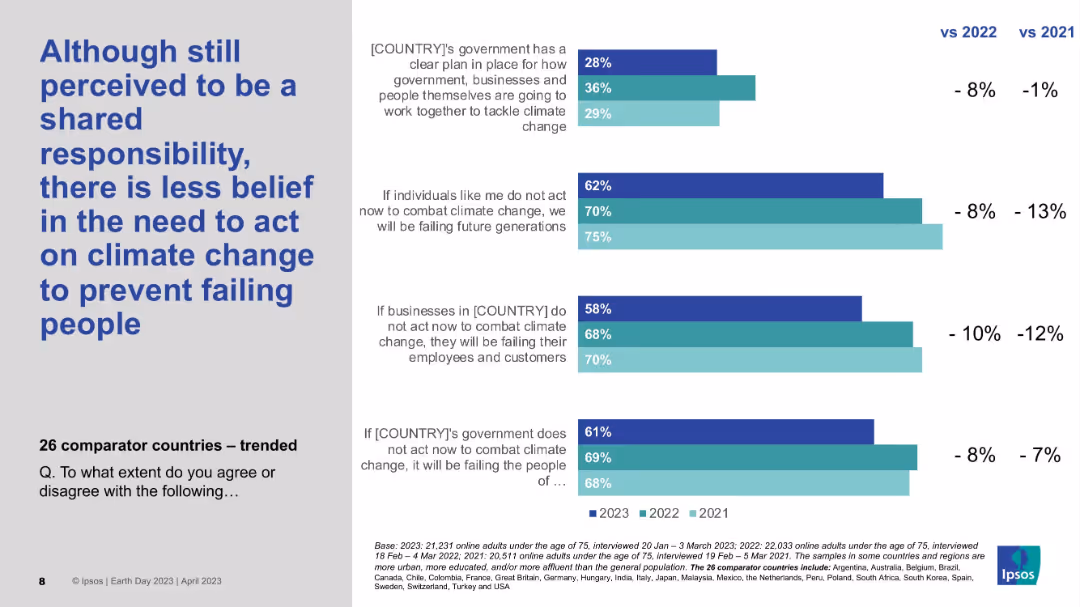
Clustered bar chart with trend lines for 2021–2023; left-aligned bold title; text clarifies survey statements.
Market Analysis and Trends
Environmental Services & Sustainability
Despite remaining a shared responsibility, public belief in urgent action against climate change is declining across years. The chart tracks falling agreement percentages from 2021 to 2023 across individuals, businesses, and governments.
Climate action, Survey trends, Ipsos, Time comparison, Shared responsibility
false
Market Analysis and Trends
Environmental Services & Sustainability environmental-services-and-sustainability
Mixed Chart
IPSOS
View slide
Utilizes split content areas to compare current states and needed actions with visual elements like icons to illustrate points clearly.
Strategic Planning
Environmental Services & Sustainability
Analyzes the gap between current climate actions and the targets set, emphasizing the need for specific plans, governance, and financing to achieve these goals in SEA.
Climate action, strategic planning, SEA, governance, financing
false
Strategic Planning
Environmental Services & Sustainability environmental-services-and-sustainability
Agenda
Bain
Previous
Loading...
Hold On!
We are searching in our database
If nothing, comes up, please try different filters!
Column Chart
Heatmap
Chevron
Org Chart
Infographic
Callouts
Timeline
List
Graphic
Picture
Process Flow
Diagram
Paragraph
Map
Table
Framework
Subtitle
Takeaway Box
Icon
Other Chart
Radar Chart
Waterfall Chart
Mekko Chart
Pie Chart
Scatter Plot
Line Chart
Bar chart
Bullet points
Create a FREE account to continue browsing
Receive Instant Access to 1,000+ slides from companies like McKinsey, Google, and Goldman Sachs
First Name
Last Name
Email
Password
I agree to all
Terms & Privacy Policy
Thank you! Your submission has been received!
Oops! Something went wrong while submitting the form.
Have an account?
Sign in
Upgrade to PRO to Save slides
Advanced Search and Filters
Access to 15,000+ slides
Access to Category Pages
Save/Bookmark Slides
PowerPoint Template Library
Pick a Plan
MONTHLY
$12/month
Billed every month, Cancel anytime.
YEARLY
$9/year
Billed $108 annually, Cancel anytime.
Checkout for $12/month
Checkout for $108/yr
Secured by Stripe | AES-256 bit encryption