My Account
My Slides
Search by Category
Templates
View All Templates
Download Template Slides
Leave Feedback
Login
Logout
Get Started
Browse all Slides
Browse all Slides
Create a FREE Account
Instant access to 1,000+ real slides from top companies like McKinsey, BCG, Goldman Sachs, Google and many more!
First Name
Last Name
Email
Password
I agree to all
Terms & Privacy Policy
Thank you! Your submission has been received!
Oops! Something went wrong while submitting the form.
Have an account?
Sign in
Spark Your Next Big Idea with New Presentation Templates
VIEW ALL Templates
Welcome,
Welcome
PRO
Show Featured Only
Checkbox 8
Companies
Mckinsey
Bain
BCG
EY
Deloitte
Accenture
PwC/Strategy&
JP Morgan
Goldman Sachs
Morgan Stanley
Citigroup
Deutsche Bank
Barclays
LEK
KPMG
Kearney
Oliver Wyman
Booz Allen Hamilton
Gartner
IPSOS
Nielsen
Slide type
Text Only
Linear Flow
Vertical Flow
Single Chart
Header Horizontal
Mixed Chart
Header Vertical
Pillar
Multiple Chart
Graphic
Agenda
Title
Table
Framework
Industry
Technology & Software
Artificial Intelligence
Financial Services
Retail & E-commerce
Consumer Goods
Industrial & Manufacturing
Transportation & Logistics
Telecommunications
Real Estate & Construction
Hospitality & Tourism
Professional Services
Education & Training
Media & Entertainment
Agriculture & Food Production
Healthcare & Pharmaceuticals
Environmental Services & Sustainability
Government & Public Sector
Use Case
Mergers and Acquisitions
Performance Metrics and KPIs
Client Case Studies
Competitive Landscape
Corporate Finance and Valuation
Product and Service Analysis
Customer and Market Segmentation
Organizational Structure and Change
Industry Overview
Regulatory and Compliance
Risk Assessment and Management
Investment Analysis
Organizational Structure and Change
Human Resources and Talent Management
Financial Performance
Market Analysis and Trends
Sales and Business Development
Human Resources and Talent Management
Clear all
Thank you! Your submission has been received!
Oops! Something went wrong while submitting the form.
Tag
View slide
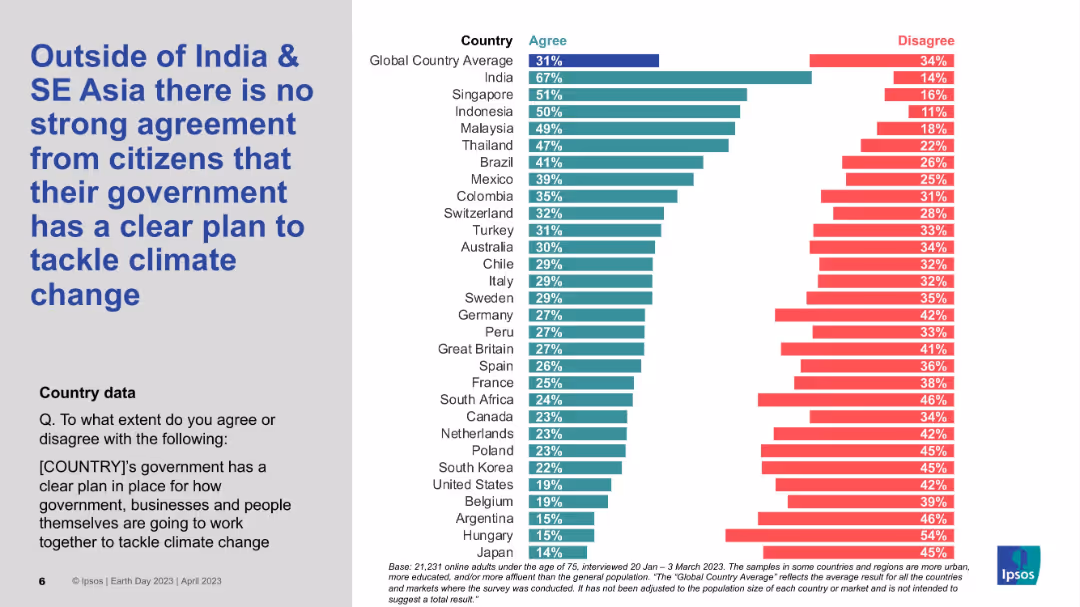
Bar chart on right showing country-level agreement/disagreement; large bold title on left; grey and white background split.
Market Analysis and Trends
Environmental Services & Sustainability
This slide highlights global perceptions regarding whether governments have a clear plan to address climate change. India and several SE Asian countries show stronger agreement, while many Western nations fall below the global average of 31%. The chart visually contrasts country sentiments.
Climate change, Government policy, Regional comparison, Ipsos, Global sentiment, SE Asia
false
Market Analysis and Trends
Environmental Services & Sustainability environmental-services-and-sustainability
Mixed Chart
IPSOS
View slide
Slide features two column charts comparing leaders and lagging organizations in their concern and actions regarding climate change. It uses green and dark green bars, with significant textual annotations and percentage indicators.
Market Analysis and Trends
Environmental Services & Sustainability
This slide contrasts the attitudes and actions between leadership and lagging organizations concerning climate change, focusing on their level of concern and active measures taken.
Climate change, Leadership, Sustainability, Corporate Responsibility, Actions, Concern, Comparison, Statistics, Environmental
false
Market Analysis and Trends
Environmental Services & Sustainability environmental-services-and-sustainability
Multiple Chart
Deloitte
View slide
A bar chart comparing Millennials and Gen Z on their views about climate change, with agree/disagree metrics on whether it is too late to repair the damage.
Market Analysis and Trends
Environmental Services & Sustainability
The slide examines the views of Millennials and Gen Z on the possibility of reversing climate change damage, comparing their levels of agreement and disagreement.
Climate change, Millennials, Gen Z, agreement, disagreement, environmental views, damage reversal, sustainability, comparison
false
Market Analysis and Trends
Environmental Services & Sustainability environmental-services-and-sustainability
Mixed Chart
Deloitte
View slide
This slide contains a map of Australia with markers indicating various states and their climate targets. It includes several text boxes detailing the efforts of different states in achieving net-zero emissions by 2050.
Regulatory and Compliance
Government & Public Sector
This slide discusses how Australian state governments are supporting landowners with land restoration and biodiversity efforts to achieve net-zero emissions by 2050. It highlights different state initiatives and targets in the context of climate change.
Climate change, Net zero, Government, Land restoration, Biodiversity
false
Regulatory and Compliance
Government & Public Sector government-and-public-sector
Graphic
EY
View slide
This slide features a world map with various tipping points indicated by colored dots corresponding to specific global warming thresholds. Each point is labeled with the effect and the temperature range.
Regulatory and Compliance
Environmental Services & Sustainability
The slide visually represents potential environmental tipping points globally as temperatures increase, like melting ice sheets and deforestation impacts. Useful for discussing the specific climate thresholds at which irreversible changes may occur.
Climate change, Tipping points, Global warming, Deforestation, Ice melting
false
Regulatory and Compliance
Environmental Services & Sustainability environmental-services-and-sustainability
Graphic
BCG
View slide
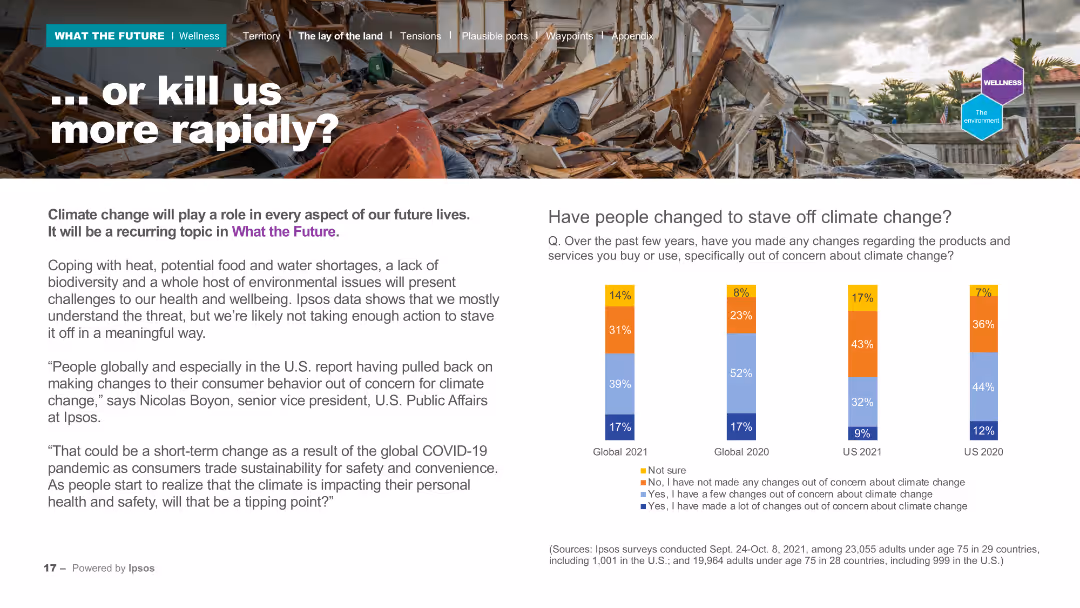
The slide contains a header, a background image of a destroyed house, and two main sections: a text block on the left and a column chart on the right. The column chart presents data on people's changes in behavior to address climate change across different years, using multiple colors for comparison.
Risk Assessment and Management
Environmental Services & Sustainability
Examines the role of climate change in future lives and the lack of significant action despite understanding the threat. The column chart compares behavioral changes regarding climate change between 2020 and 2021, showing the trends in public actions to mitigate environmental impact.
Climate change, behavior, future, survey, environment
false
Risk Assessment and Management
Environmental Services & Sustainability environmental-services-and-sustainability
Mixed Chart
IPSOS
View slide
Features a pie chart, a bar chart, and substantial explanatory text. Layout is clear with visual emphasis on key stats.
Regulatory and Compliance
Environmental Services & Sustainability
Examines the expected impact of climate change on business strategies and operations, detailing top climate issues affecting companies.
Climate change, business impact, operations, strategy
false
Regulatory and Compliance
Environmental Services & Sustainability environmental-services-and-sustainability
Multiple Chart
Deloitte
View slide
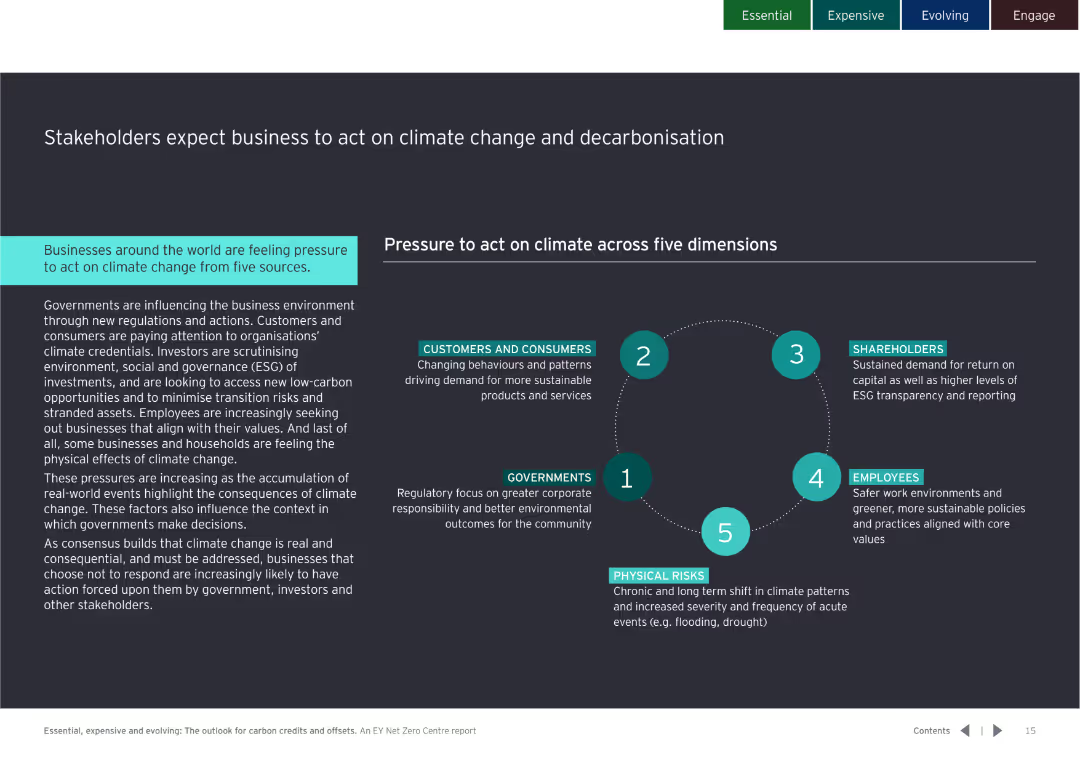
Includes text with a circular infographic detailing the five sources of pressure for businesses to act on climate change.
Risk Assessment and Management
Environmental Services & Sustainability
Outlines the pressures from governments, customers, investors, employees, and physical risks, pushing businesses to adopt decarbonization strategies.
Climate change, decarbonisation, stakeholders, pressure, business, risk, management, sustainability
false
Risk Assessment and Management
Environmental Services & Sustainability environmental-services-and-sustainability
Diagram
EY
View slide
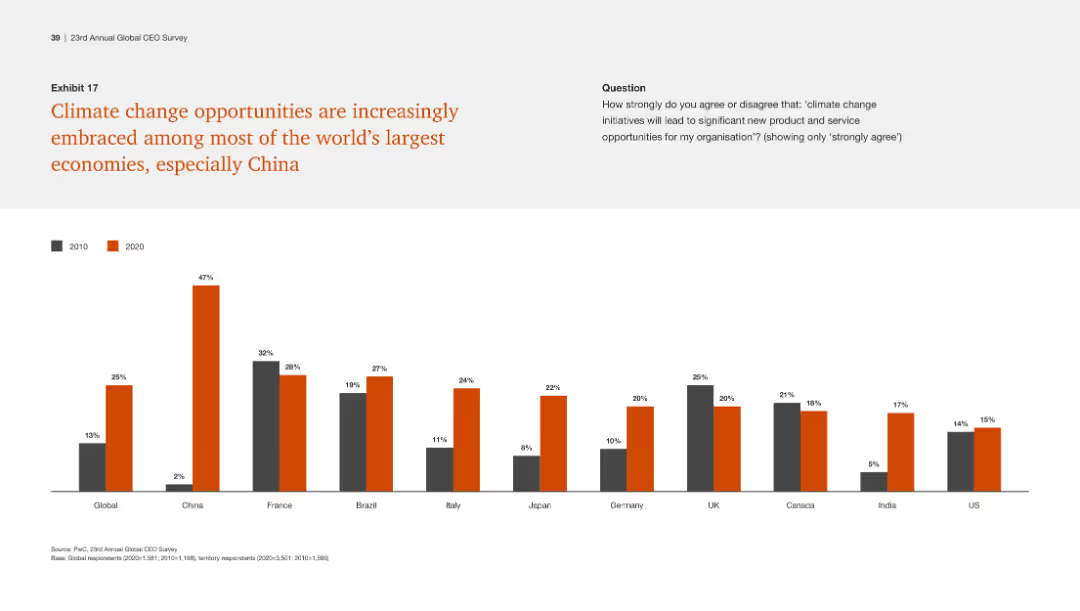
Column chart comparing agreement with climate change opportunities among major economies between 2010 and 2020, including bars for China, France, Brazil, and others.
Market Analysis and Trends
Environmental Services & Sustainability
The slide shows how agreement on climate change opportunities has increased in major economies, highlighting significant growth in China, France, and Brazil.
Climate change, economies, opportunities, growth, 2020
false
Market Analysis and Trends
Environmental Services & Sustainability environmental-services-and-sustainability
Single Chart
PwC/Strategy&
View slide
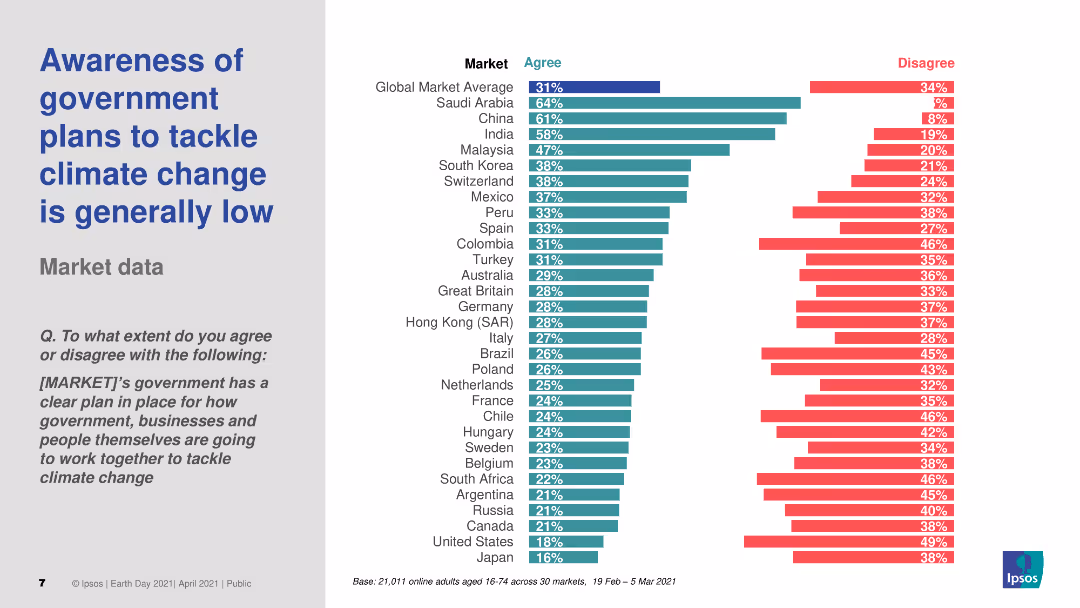
The slide includes a header, a text block, and a column chart. The column chart shows survey data on public awareness of government plans to tackle climate change across various markets, with different colors representing levels of agreement and disagreement.
Market Analysis and Trends
Environmental Services & Sustainability
Discusses the low awareness of government plans to tackle climate change across different countries. The column chart presents survey data on public agreement with the statement that their government's plans are clear, comparing awareness levels across multiple markets.
Climate change, government plans, awareness, survey, markets
false
Market Analysis and Trends
Environmental Services & Sustainability environmental-services-and-sustainability
Multiple Chart
IPSOS
View slide
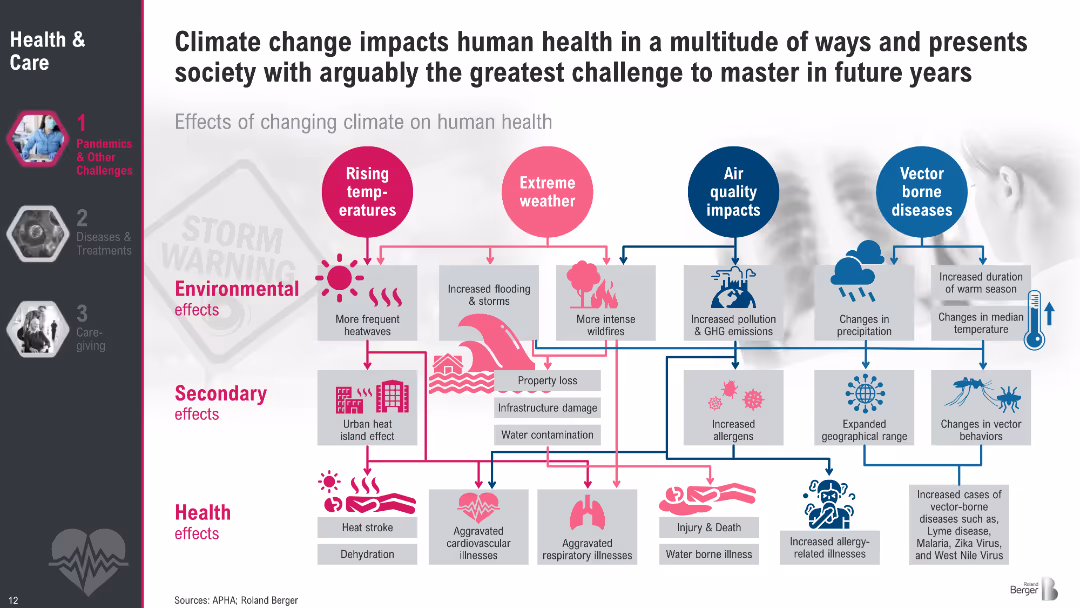
Visual flow diagram with icons, color-coded pathways and categorized effects (environmental, secondary, health). Uses pink and blue color themes to map rising temperatures, extreme weather, air quality, and vector-borne diseases.
Risk Assessment and Management
Healthcare & Pharmaceuticals
This slide explains how climate change influences human health via rising temperatures, extreme weather, air quality degradation, and changes in vector-borne diseases. It outlines environmental, secondary, and health effects, from heatwaves and floods to cardiovascular issues, allergies, and infectious diseases. The diagram emphasizes cascading impacts across multiple domains.
Climate change, health effects, temperature, pollution, vector diseases, flooding, allergies, infrastructure, dehydration, cardiovascular
false
Risk Assessment and Management
Healthcare & Pharmaceuticals healthcare-and-pharmaceuticals
Diagram
Roland Berger
View slide
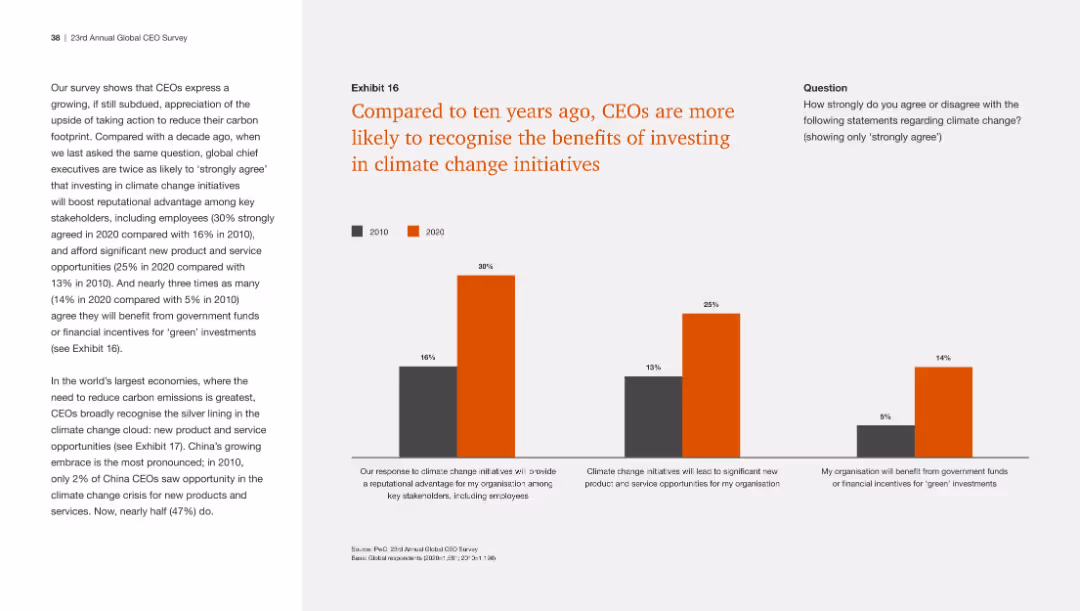
This slide includes a column chart comparing CEO responses from 2010 and 2020 on the benefits of investing in climate change initiatives, with clear visual distinctions.
Regulatory and Compliance
Environmental Services & Sustainability
The slide shows that CEOs are now more likely to acknowledge the advantages of climate change investments, including reputational benefits and new opportunities.
Climate change, investment benefits, CEO recognition, sustainability, comparison
false
Regulatory and Compliance
Environmental Services & Sustainability environmental-services-and-sustainability
Mixed Chart
PwC/Strategy&
View slide
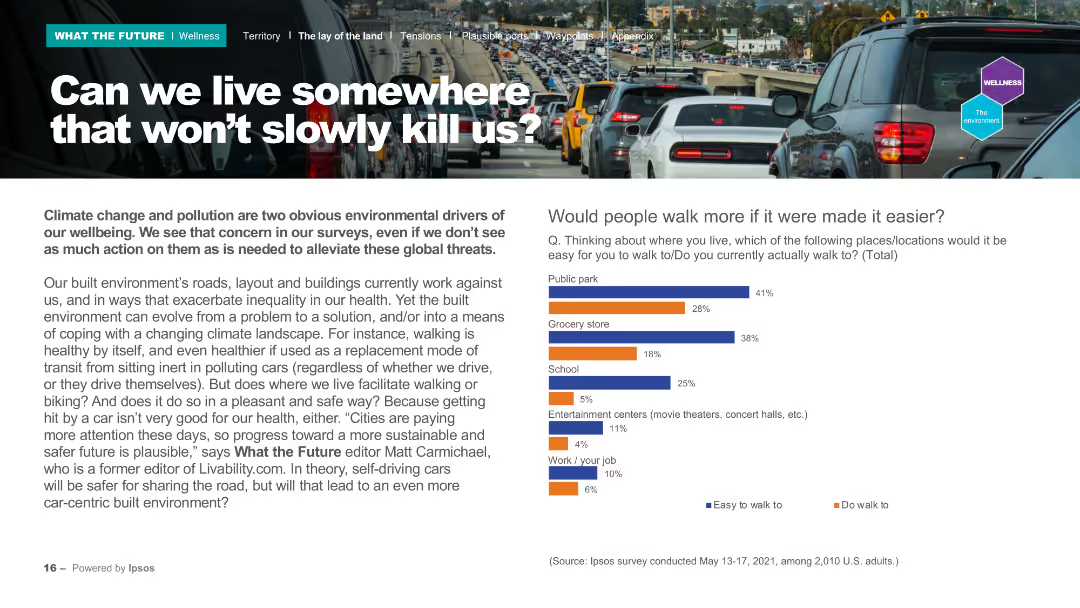
The slide features a header with the title, a background image of a traffic jam, and two main sections: a text block on the left and a column chart on the right. The column chart compares the ease of walking to various locations like parks, grocery stores, and schools, using two colors for easy identification.
Market Analysis and Trends
Environmental Services & Sustainability
Discusses climate change and pollution's impact on wellbeing, and how urban planning can evolve to address these issues. The column chart shows survey data on how easy it is for people to walk to different locations. It highlights the need for better infrastructure to support walking and reduce pollution.
Climate change, pollution, urban planning, walking, survey
false
Market Analysis and Trends
Environmental Services & Sustainability environmental-services-and-sustainability
Mixed Chart
IPSOS
View slide
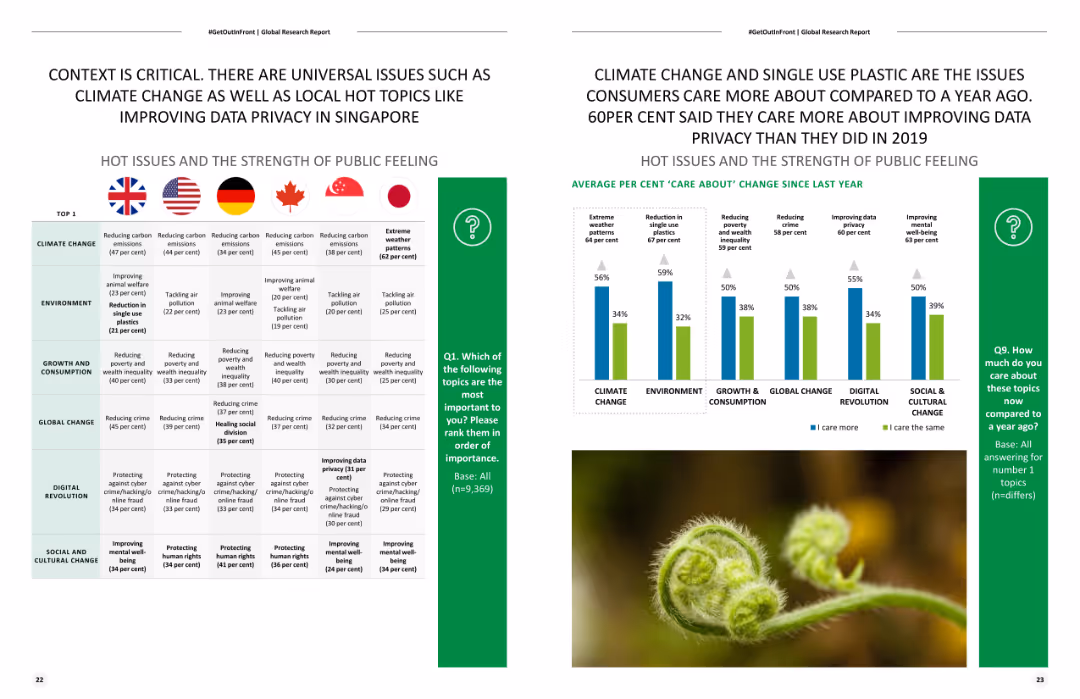
Slide includes two column charts and flags representing different countries. The left chart shows public opinion on issues by country, and the right chart shows changes in opinions over time.
Market Analysis and Trends
Environmental Services & Sustainability
Compares public concerns about various global issues, with a focus on climate change, environment, growth and consumption, etc., across different countries and over time.
Climate change, public opinion, environment, global issues, trends
false
Market Analysis and Trends
Environmental Services & Sustainability environmental-services-and-sustainability
Mixed Chart
Deloitte
View slide
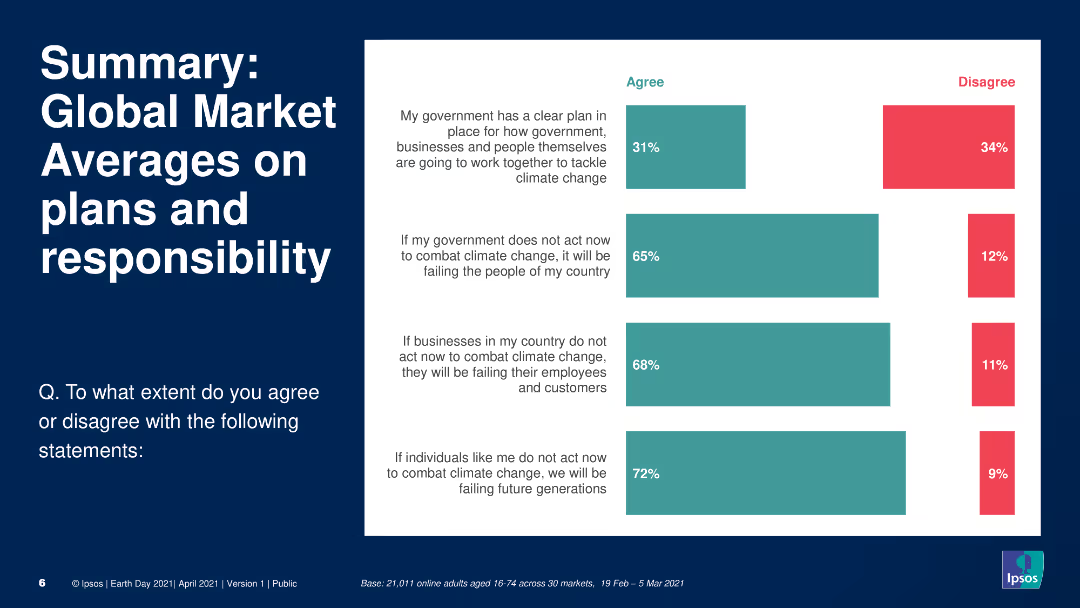
The slide features a header, a text block summarizing key points, and a column chart. The column chart displays global survey data on public agreement with statements about government, business, and individual responsibility for combating climate change, using different colors to show agreement and disagreement.
Market Analysis and Trends
Environmental Services & Sustainability
Provides a summary of global market averages on public perceptions of responsibility for climate change. The column chart shows survey data on agreement with statements regarding the roles of governments, businesses, and individuals in addressing climate change, highlighting areas of agreement and disagreement across markets.
Climate change, responsibility, global, survey, government
false
Market Analysis and Trends
Environmental Services & Sustainability environmental-services-and-sustainability
Single Chart
IPSOS
View slide
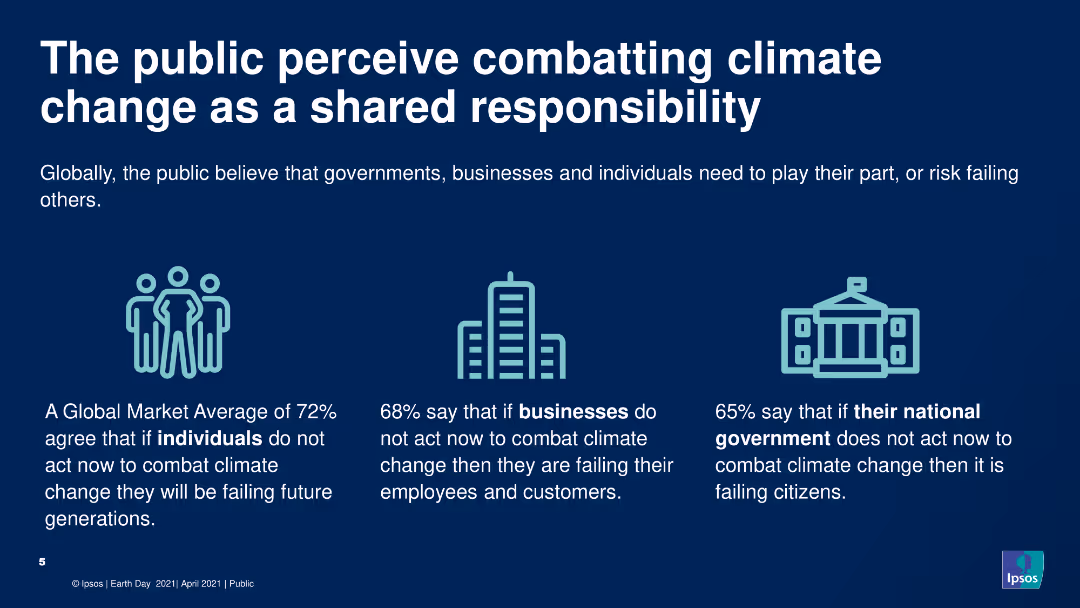
The slide includes a header, icons, and a text block summarizing survey data. The slide has a clean, simple design with three icons representing individuals, businesses, and governments, each accompanied by a key statistic from the survey about their perceived responsibility in combating climate change.
Market Analysis and Trends
Environmental Services & Sustainability
Highlights public opinion on shared responsibility for combating climate change among individuals, businesses, and governments. The slide uses icons and text to present survey data showing high agreement that all parties need to take action to address climate change.
Climate change, responsibility, public opinion, survey, environment
false
Market Analysis and Trends
Environmental Services & Sustainability environmental-services-and-sustainability
Pillar
IPSOS
View slide
Contains a bar chart and a column chart, with blue-green color scheme. Text is used to provide context and explanations.
Regulatory and Compliance
Environmental Services & Sustainability
Highlights the importance of climate change in corporate strategy and investments, focusing on the top pressing issues and changes in sustainability investments.
Climate change, sustainability, corporate strategy, investments
false
Regulatory and Compliance
Environmental Services & Sustainability environmental-services-and-sustainability
Multiple Chart
Deloitte
View slide
Column charts contrasting views from different countries. Simple and clear layout with green color highlights.
Regulatory and Compliance
Environmental Services & Sustainability
Discusses the concept of a "just transition" in sustainability efforts and its varying importance across different countries.
Climate equity, just transition, regional differences, sustainability
false
Regulatory and Compliance
Environmental Services & Sustainability environmental-services-and-sustainability
Multiple Chart
Deloitte
View slide
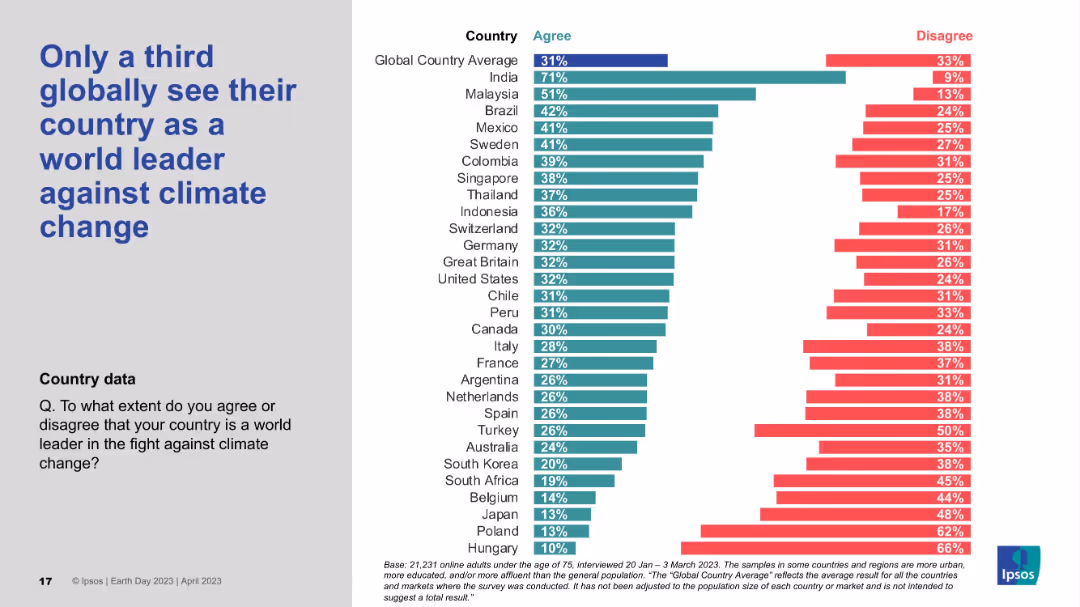
Bar chart visualizing countries’ agreement that their nation is a climate leader; large title left, data-heavy right side.
Strategic Planning
Government & Public Sector
The slide indicates low global confidence in national leadership on climate issues. Only a third of global respondents view their country as a world leader, with India topping the list. Many developed nations like Japan, Poland, and Hungary score very low in agreement.
Climate leadership, National pride, Public perception, Ipsos survey, Global ranking
false
Strategic Planning
Government & Public Sector government-and-public-sector
Mixed Chart
IPSOS
View slide
This slide presents a comparative analysis of climate ambition, sector roadmaps, and policy frameworks across various countries, using a multi-tiered visual layout that includes icons representing countries and different levels of policy adequacy.
Regulatory and Compliance
Environmental Services & Sustainability
Evaluates the adequacy of climate policies across multiple countries, highlighting those with sufficient ambition and those lacking. Useful for discussions on enhancing climate policy frameworks and sector-specific strategies to meet global climate goals.
Climate policies, Country comparison, Policy adequacy, Ambition, Roadmaps
false
Regulatory and Compliance
Environmental Services & Sustainability environmental-services-and-sustainability
Table
BCG
View slide
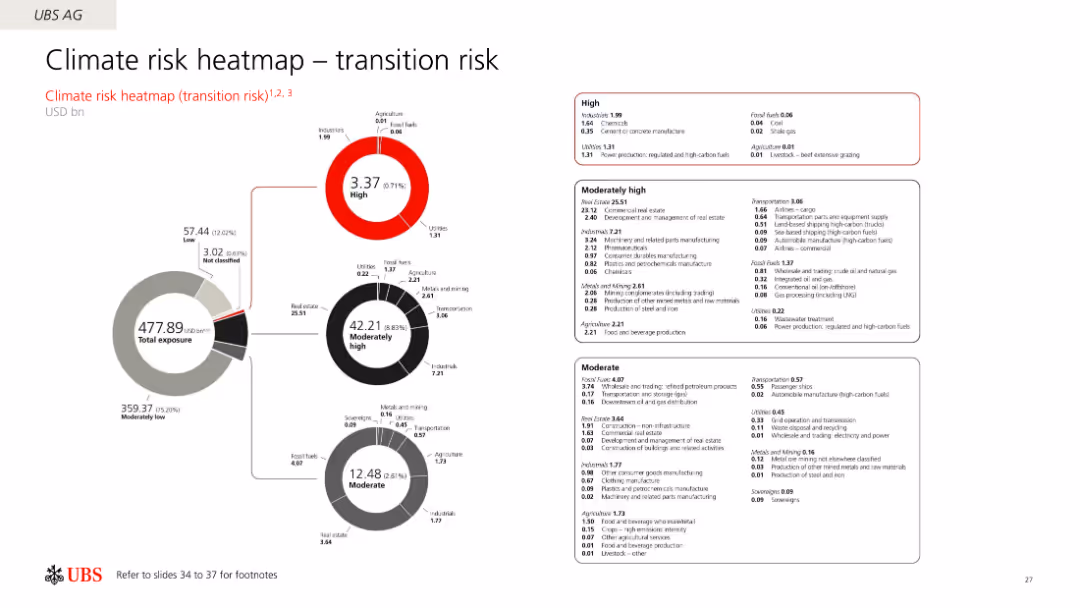
The slide uses a circular diagram to illustrate the climate transition risks across different sectors, with sections marked as high, moderately high, and moderate risk.
Risk Assessment and Management
Financial Services
The slide presents a heatmap of UBS AG's exposure to climate transition risks, categorizing various sectors based on their risk levels and financial exposure.
Climate risk, heatmap, transition risk, UBS, exposure
false
Risk Assessment and Management
Financial Services financial-services
Multiple Chart
UBS
View slide
This slide features a mix of text, an image of wind turbines, and two column charts. The charts show understanding and importance of climate-change risk management.
Risk Assessment and Management
Financial Services
It discusses the increasing importance of climate risk, maturity of understanding among CROs, and key ways to integrate climate risks into risk management activities.
Climate risk, wind turbines, risk management, understanding, integration
false
Risk Assessment and Management
Financial Services financial-services
Multiple Chart
EY
View slide
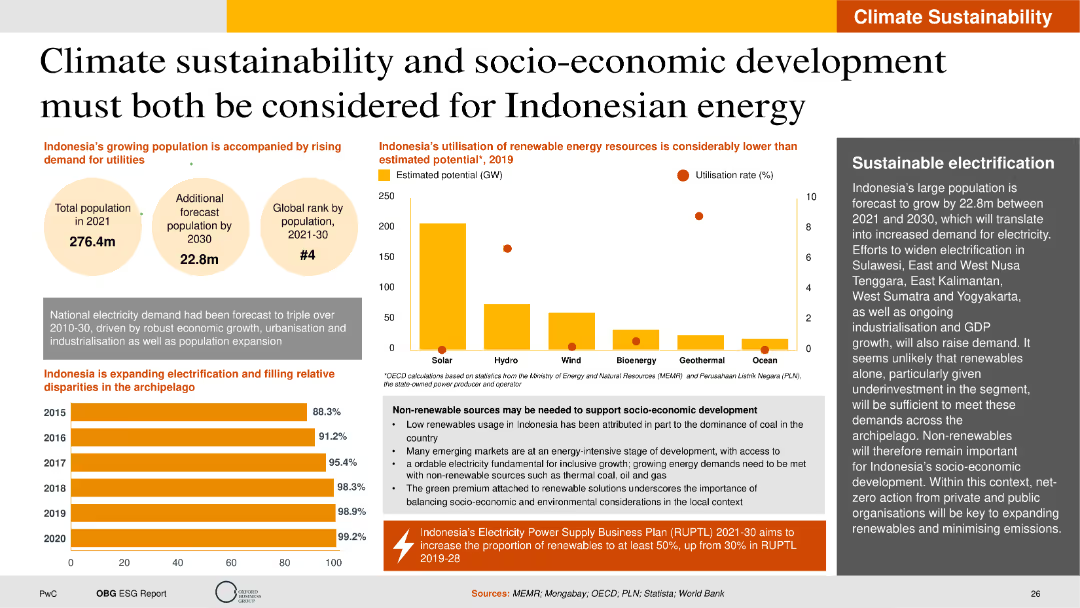
The slide includes column charts, bubble charts, and text descriptions. It is visually detailed with data on energy resource utilization, population growth, and electrification rates.
Strategic Planning
Energy & Utilities
The slide highlights the balance between climate sustainability and socio-economic development in Indonesia's energy sector. It discusses the potential and utilization rates of various renewable energy sources, the forecasted population growth, and the expansion of electrification. The slide also addresses the need for non-renewable sources to support socio-economic development and the importance of sustainable electrification strategies.
Climate sustainability, renewable energy, socio-economic development, electrification
false
Strategic Planning
Energy & Utilities energy-and-utilities
Multiple Chart
PwC/Strategy&
View slide
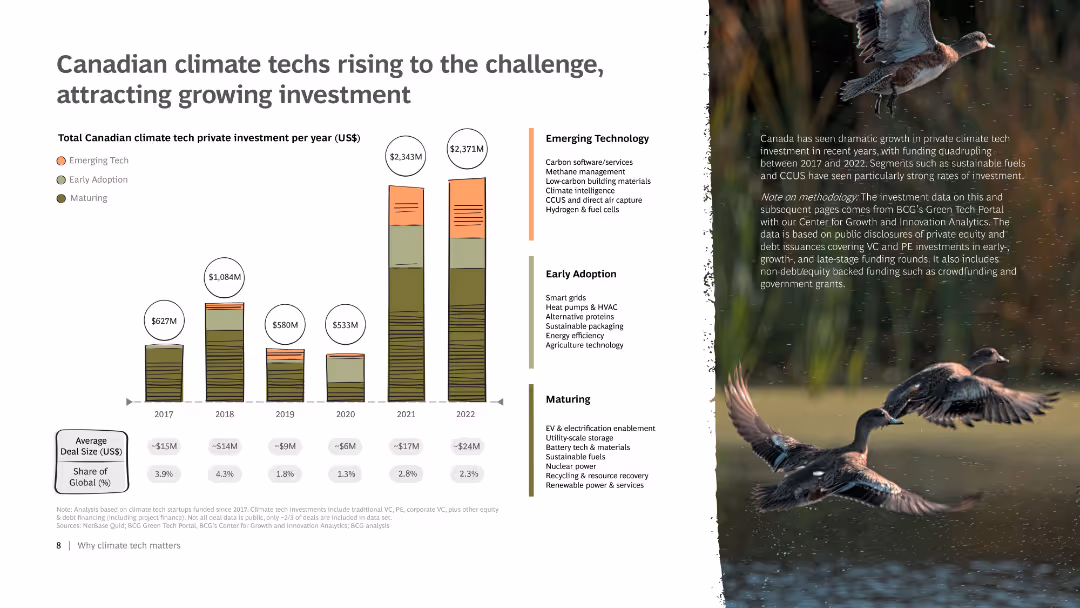
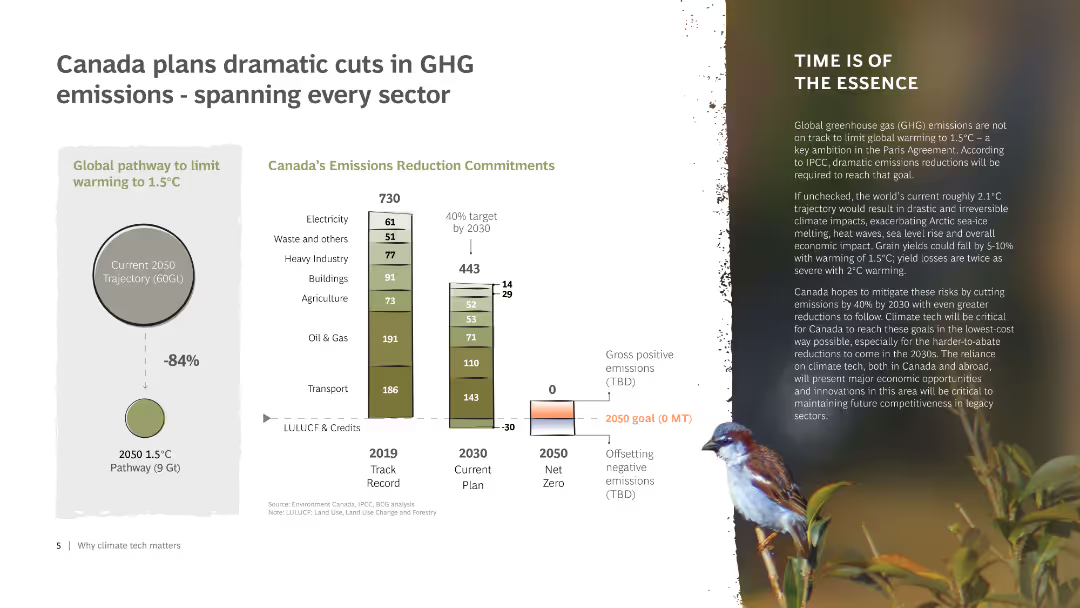
Column chart illustrating Canada's share of global climate tech investment in various sectors from 2017 to 2022. An illustration of an industrial site is in the background.
Competitive Landscape
Environmental Services & Sustainability
Presents Canada's position in the global climate tech sector, showcasing investment in multiple emerging areas and the country's potential for leading in decarbonization.
Climate tech, Canada, investment, global, sectors
false
Competitive Landscape
Environmental Services & Sustainability environmental-services-and-sustainability
Mixed Chart
BCG
View slide
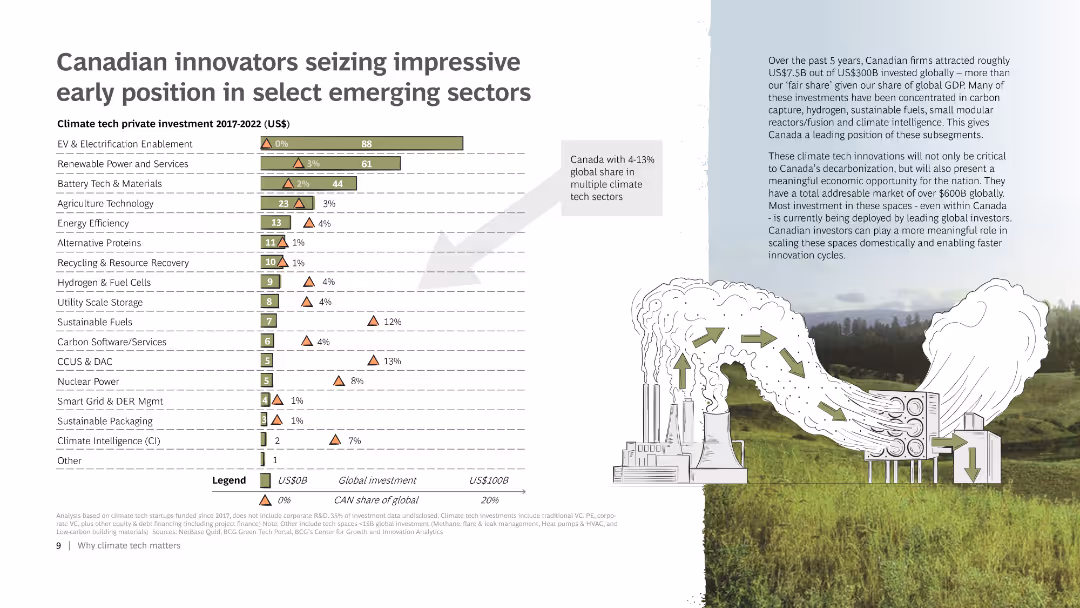
The slide includes a bar chart displaying the climate tech private investment from 2017 to 2022 across various sectors. It also features a small map of Canada, a detailed legend, and an illustration of a factory emitting green arrows to represent sustainable practices.
Market Analysis and Trends
Energy & Utilities
Highlights Canada's leading position in various emerging climate tech sectors through investments. Includes data on global and Canadian investments, emphasizing Canada’s share of the global market in these sectors.
Climate tech, Investment, Canada, Emerging sectors, Chart
false
Market Analysis and Trends
Energy & Utilities energy-and-utilities
Mixed Chart
BCG
View slide
Column chart showing the readiness levels of climate tech solutions, with categories ranging from mature to small prototype. Background includes an illustration of a train.
Technology and Digital Transformation
Environmental Services & Sustainability
Illustrates the readiness of various climate tech solutions for market implementation, stressing the need for accelerated development and deployment of new technologies.
Climate tech, readiness, market, technology, deployment
false
Technology and Digital Transformation
Environmental Services & Sustainability environmental-services-and-sustainability
Mixed Chart
BCG
View slide
This content slide includes a mix of text, a photo of a worker with wind turbines, and a column chart displaying economic, energy, and emissions trends under three scenarios. The design is moderately dense with detailed information.
Market Analysis and Trends
Environmental Services & Sustainability
The slide outlines how green climate action can decouple GDP growth from emissions and energy consumption. It compares three scenarios for global economic growth and emissions trends up to 2050, showing the potential benefits of transitioning to renewable energy sources and improving energy efficiency.
Climate, Emissions, GDP, Energy, Sustainability
false
Market Analysis and Trends
Environmental Services & Sustainability environmental-services-and-sustainability
Multiple Chart
EY
View slide
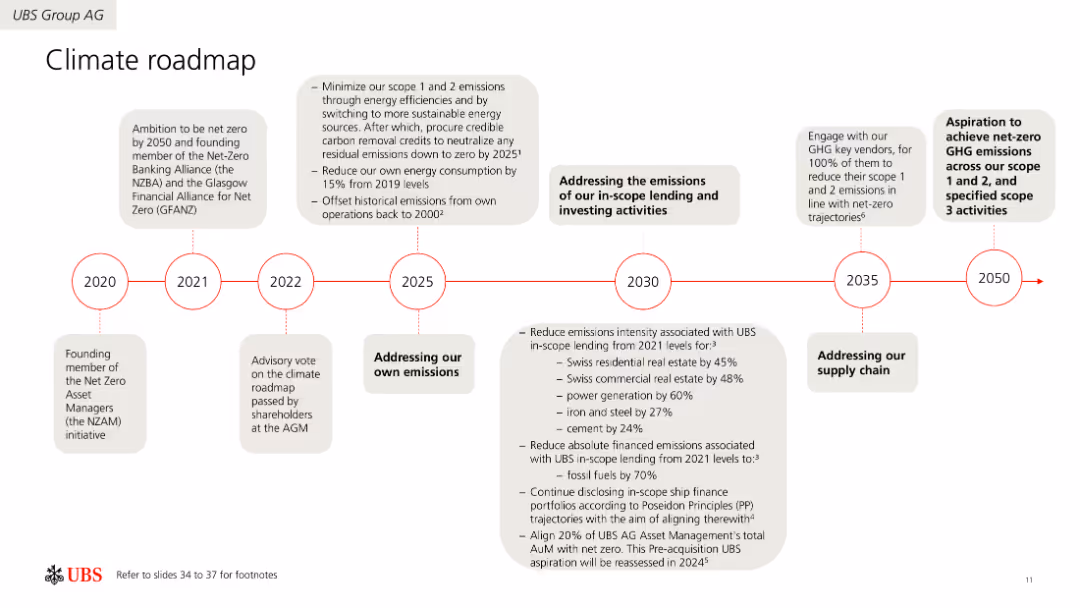
Horizontal timeline illustrating UBS's climate action milestones from 2020 to 2050. Includes detailed descriptions of goals and actions for different years. Uses icons and color coding to differentiate milestones.
Strategic Planning
Environmental Services & Sustainability
Provides a detailed roadmap of UBS's climate action plans, aiming for net-zero emissions by 2050. Describes key milestones, including emission reductions, energy efficiency improvements, and carbon offset strategies.
Climate, Roadmap, Net-Zero, Emissions, Strategy, Planning, Environmental
false
Strategic Planning
Environmental Services & Sustainability environmental-services-and-sustainability
Linear Flow
UBS
View slide
The slide features a vertical bar chart comparing levels of concern about the climate over several years across different countries.
Market Analysis and Trends
Environmental Services & Sustainability
Analysis of changing levels of public concern about the climate in various countries over time, showing trends and possible waning interest in some areas.
Climate, concern, trends, survey, countries
false
Market Analysis and Trends
Environmental Services & Sustainability environmental-services-and-sustainability
Mixed Chart
IPSOS
View slide
Scatter plot, color-coded data, geographical references.
Risk Assessment and Management
Environmental Services & Sustainability
Compares companies' preparedness for climate change risk against natural hazard exposure.
Climate, risk, companies, preparedness, hazards, exposure, environment, strategy
false
Risk Assessment and Management
Environmental Services & Sustainability environmental-services-and-sustainability
Single Chart
PwC/Strategy&
Previous
Loading...
Hold On!
We are searching in our database
If nothing, comes up, please try different filters!
Column Chart
Heatmap
Chevron
Org Chart
Infographic
Callouts
Timeline
List
Graphic
Picture
Process Flow
Diagram
Paragraph
Map
Table
Framework
Subtitle
Takeaway Box
Icon
Other Chart
Radar Chart
Waterfall Chart
Mekko Chart
Pie Chart
Scatter Plot
Line Chart
Bar chart
Bullet points
Create a FREE account to continue browsing
Receive Instant Access to 1,000+ slides from companies like McKinsey, Google, and Goldman Sachs
First Name
Last Name
Email
Password
I agree to all
Terms & Privacy Policy
Thank you! Your submission has been received!
Oops! Something went wrong while submitting the form.
Have an account?
Sign in
Upgrade to PRO to Save slides
Advanced Search and Filters
Access to 15,000+ slides
Access to Category Pages
Save/Bookmark Slides
PowerPoint Template Library
Pick a Plan
MONTHLY
$12/month
Billed every month, Cancel anytime.
YEARLY
$9/year
Billed $108 annually, Cancel anytime.
Checkout for $12/month
Checkout for $108/yr
Secured by Stripe | AES-256 bit encryption