My Account
My Slides
Search by Category
Templates
View All Templates
Download Template Slides
Leave Feedback
Login
Logout
Get Started
Browse all Slides
Browse all Slides
Create a FREE Account
Instant access to 1,000+ real slides from top companies like McKinsey, BCG, Goldman Sachs, Google and many more!
First Name
Last Name
Email
Password
I agree to all
Terms & Privacy Policy
Thank you! Your submission has been received!
Oops! Something went wrong while submitting the form.
Have an account?
Sign in
Spark Your Next Big Idea with New Presentation Templates
VIEW ALL Templates
Welcome,
Welcome
PRO
Show Featured Only
Checkbox 8
Companies
Mckinsey
Bain
BCG
EY
Deloitte
Accenture
PwC/Strategy&
JP Morgan
Goldman Sachs
Morgan Stanley
Citigroup
Deutsche Bank
Barclays
LEK
KPMG
Kearney
Oliver Wyman
Booz Allen Hamilton
Gartner
IPSOS
Nielsen
Slide type
Text Only
Linear Flow
Vertical Flow
Single Chart
Header Horizontal
Mixed Chart
Header Vertical
Pillar
Multiple Chart
Graphic
Agenda
Title
Table
Framework
Industry
Technology & Software
Artificial Intelligence
Financial Services
Retail & E-commerce
Consumer Goods
Industrial & Manufacturing
Transportation & Logistics
Telecommunications
Real Estate & Construction
Hospitality & Tourism
Professional Services
Education & Training
Media & Entertainment
Agriculture & Food Production
Healthcare & Pharmaceuticals
Environmental Services & Sustainability
Government & Public Sector
Use Case
Mergers and Acquisitions
Performance Metrics and KPIs
Client Case Studies
Competitive Landscape
Corporate Finance and Valuation
Product and Service Analysis
Customer and Market Segmentation
Organizational Structure and Change
Industry Overview
Regulatory and Compliance
Risk Assessment and Management
Investment Analysis
Organizational Structure and Change
Human Resources and Talent Management
Financial Performance
Market Analysis and Trends
Sales and Business Development
Human Resources and Talent Management
Clear all
Thank you! Your submission has been received!
Oops! Something went wrong while submitting the form.
Tag
View slide
Pie chart showing GMV by channel, a bar chart for demand generation percentage, and a line chart for LTV to CAC ratios over different cohorts.
Operational Efficiency
Retail & E-commerce
Analyzes demand generation costs and unit economics for Farfetch, illustrating low cost/organic vs. paid channels and customer value over time.
Demand generation, unit economics, Farfetch, GMV, LTV
false
Operational Efficiency
Retail & E-commerce retail-and-e-commerce
Multiple Chart
Deutsche Bank
View slide
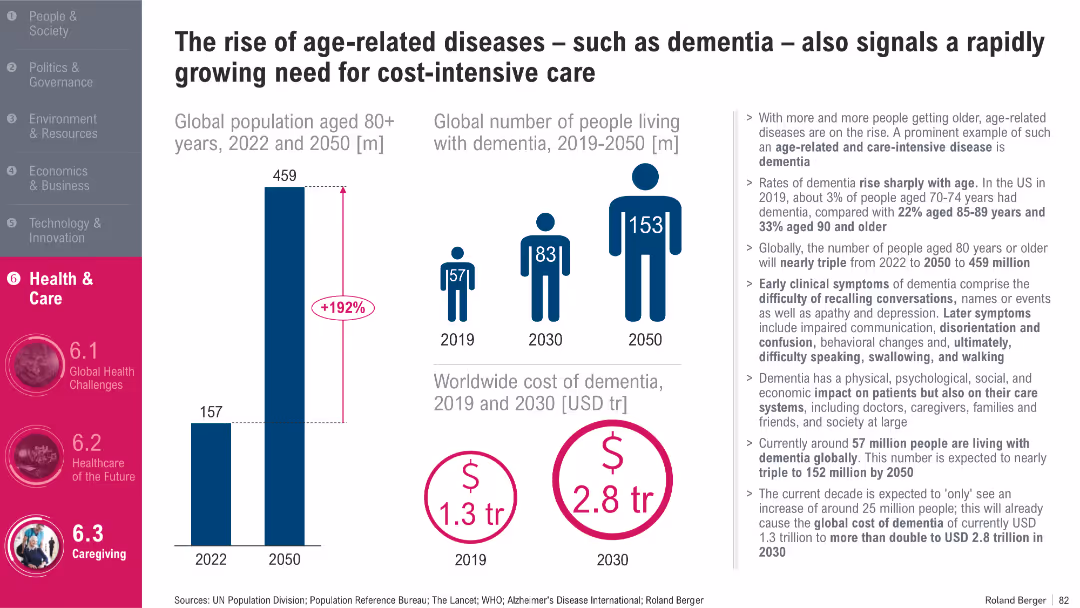
Infographic style with three key visuals: population growth bar chart, dementia patient figures, and cost projection icons; right-side text panel
Market Analysis and Trends
Healthcare & Pharmaceuticals
This slide projects a sharp increase in the aging population and dementia cases globally, highlighting a 192% rise in people aged 80+ by 2050 and a growing global cost burden of dementia, expected to more than double by 2030. It emphasizes the growing health and economic pressures associated with age-related diseases.
Dementia, aging population, global cost, healthcare burden, age-related diseases, cost-intensive care, 2050 projections, elderly care, cognitive decline
false
Market Analysis and Trends
Healthcare & Pharmaceuticals healthcare-and-pharmaceuticals
Multiple Chart
Roland Berger
View slide
The slide presents demographic data for 2023 with icons and percentages for gender, age, household composition, and more.
Customer and Market Segmentation
Financial Services
It details the demographics of Canadians in 2023, including gender, age, education, and employment status.
Demographics, 2023, Canadians, Gender, Age, Household, Education, Employment, Financial, Segmentation
false
Customer and Market Segmentation
Financial Services financial-services
Multiple Chart
IPSOS
View slide
Contains multiple line charts, bar graphs, and informational text. The slide is dense with data showcasing demographic changes globally.
Market Analysis and Trends
Financial Services
This slide analyzes global demographic trends, showing aging populations and youth demographics to inform market strategies and policy development.
Demographics, Aging Population, Youth, Market Trends, Global Analysis
false
Market Analysis and Trends
Financial Services financial-services
Multiple Chart
PwC/Strategy&
View slide
Depicts pie charts and a bar graph detailing respondent demographics by job title and company revenue for a consumer survey, titled 'Sample Composition'.
Market Analysis and Trends
Media & Entertainment
Analyzes respondent demographics of an executive survey, including titles and company revenue, relevant for market segmentation studies.
Demographics, Executive Survey, Job Titles, Company Revenue, Market Segmentation, Consumer Goods
false
Market Analysis and Trends
Media & Entertainment media-and-entertainment
Multiple Chart
Kearney
View slide
The slide features multiple icon-based graphics detailing demographic information, such as gender, age, and education.
Customer and Market Segmentation
Financial Services
The slide provides demographic statistics of survey respondents, including gender distribution, age groups, education levels, and employment status.
Demographics, Gender, Age, Education, Employment
false
Customer and Market Segmentation
Financial Services financial-services
Multiple Chart
IPSOS
View slide
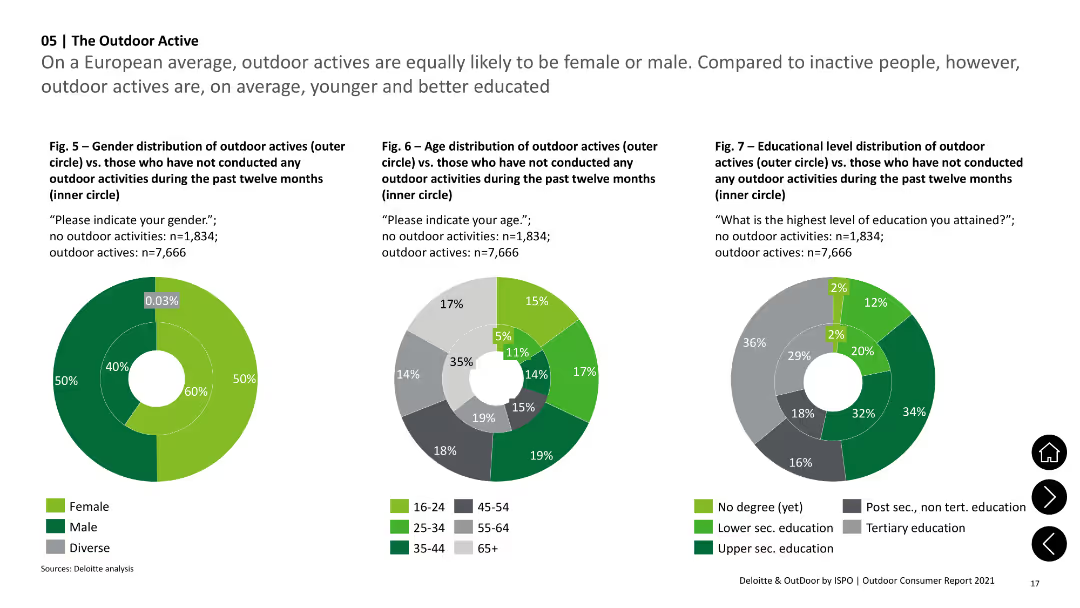
Three donut charts comparing gender, age, and education distribution of outdoor actives vs. non-actives. Green shades represent different groups.
Market Analysis and Trends
Consumer Goods
Compares gender, age, and education level distributions of individuals who participated in outdoor activities versus those who did not.
Demographics, Gender, Age, Education, Outdoor Activities
false
Market Analysis and Trends
Consumer Goods consumer-goods
Multiple Chart
Deloitte
View slide
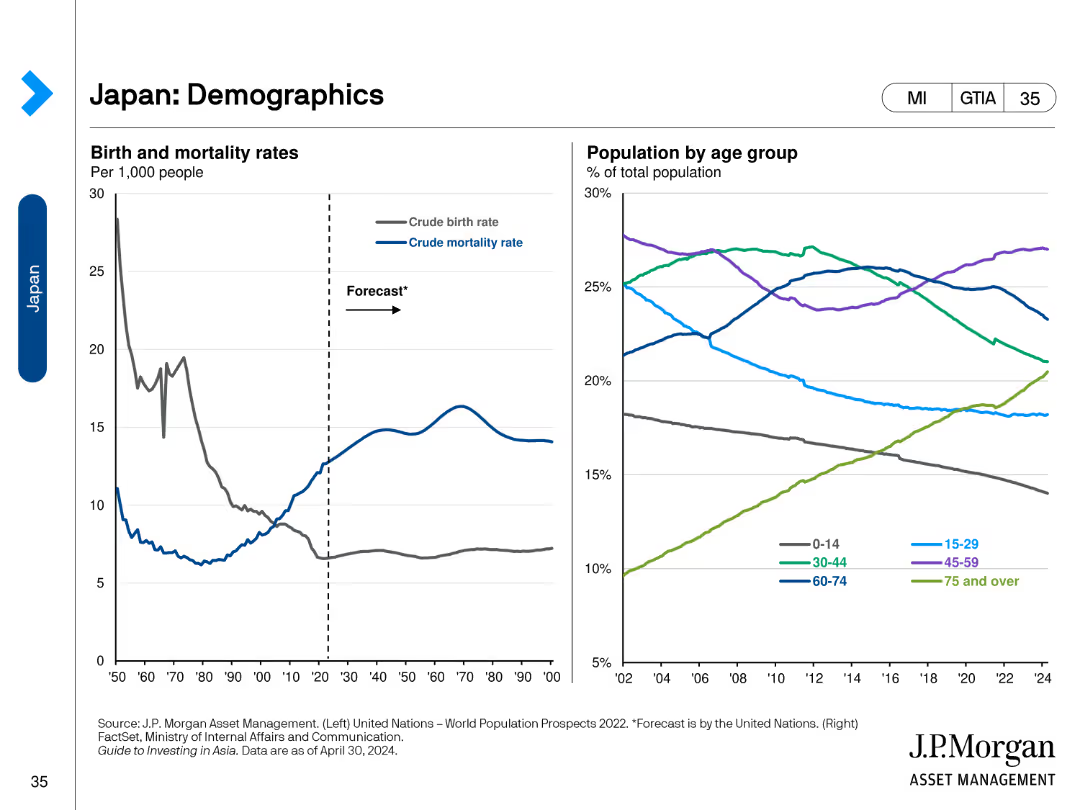
The slide includes two line charts. The left chart shows birth and mortality rates per 1,000 people. The right chart shows the population by age group.
Market Analysis and Trends
Healthcare & Pharmaceuticals
This slide reviews demographic trends in Japan, presenting data on birth and mortality rates and the population distribution by age group.
Demographics, Japan, Birth Rate, Mortality, Age
false
Market Analysis and Trends
Healthcare & Pharmaceuticals healthcare-and-pharmaceuticals
Multiple Chart
JP Morgan
View slide
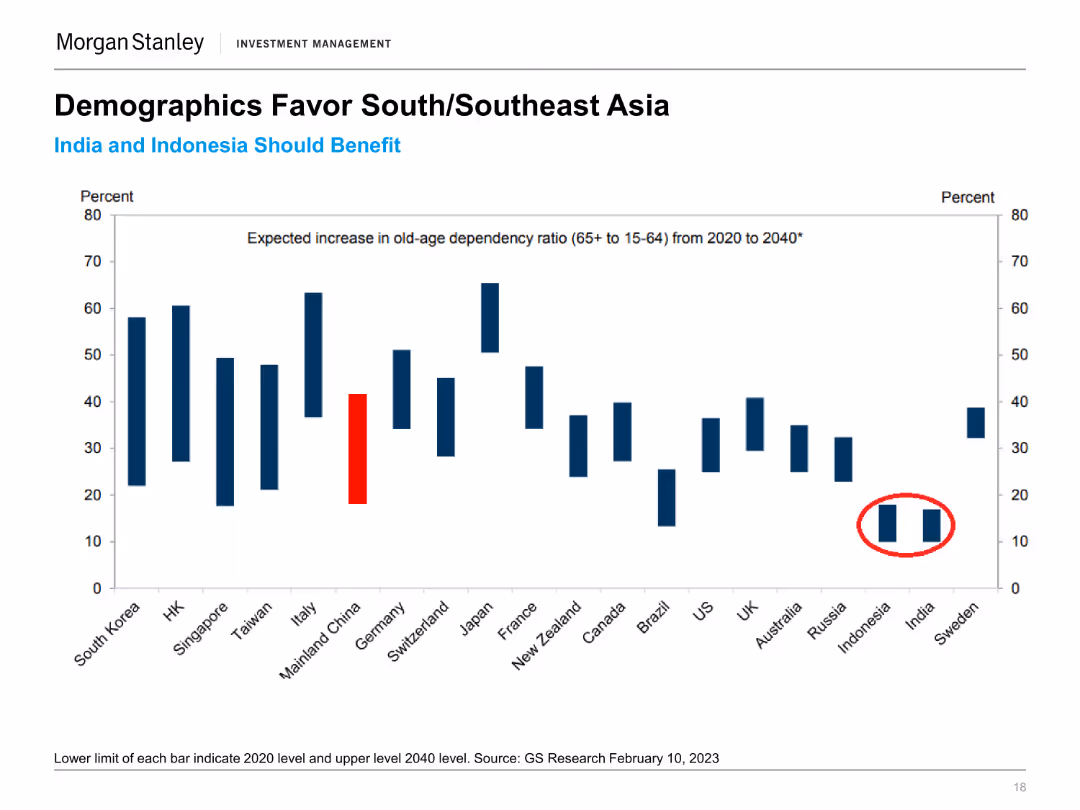
The slide presents a column chart illustrating the expected increase in old-age dependency ratio (65+ to 15-64) from 2020 to 2040 for various countries. Specific countries are highlighted.
Market Analysis and Trends
Financial Services
The slide analyzes demographic trends favoring South and Southeast Asia by projecting old-age dependency ratios, indicating potential economic advantages for these regions.
Demographics, South Asia, Southeast Asia, Old-Age Dependency, Economic Trends, Population Growth, Market Analysis, Regional Advantages
false
Market Analysis and Trends
Financial Services financial-services
Single Chart
Morgan Stanley
View slide
A pie chart showing company size distribution and a world map indicating surveyed countries. Text lists respondent demographics and industries.
Market Analysis and Trends
Professional Services
The slide presents the demographic breakdown of a survey, including company size, industries, and geographical distribution of the respondents.
Demographics, Survey, Company Size, Industries, Global Distribution
false
Market Analysis and Trends
Professional Services professional-services
Mixed Chart
Accenture
View slide
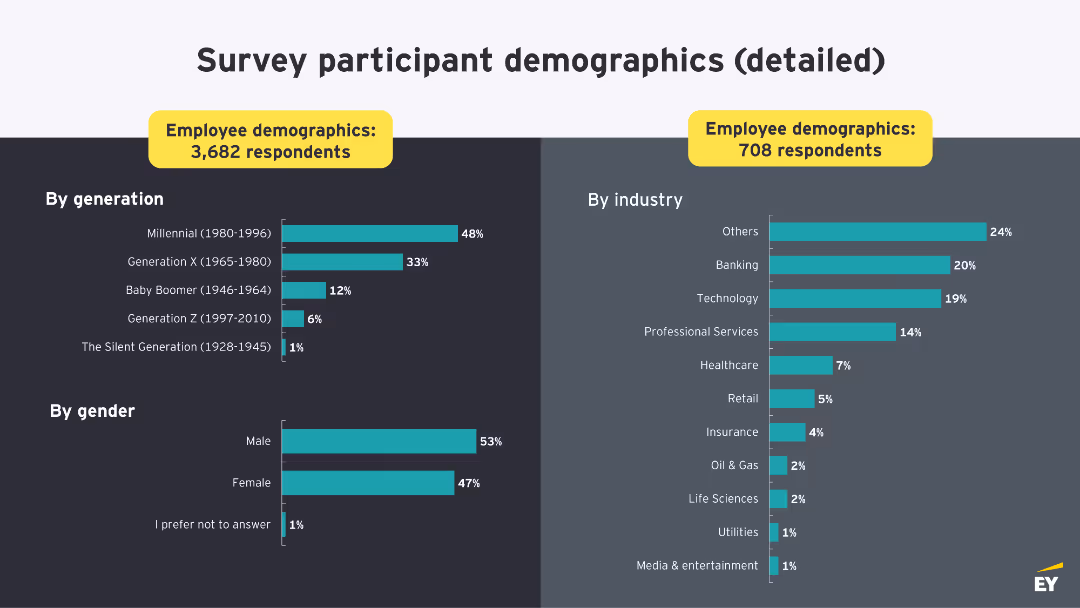
A column chart showing the demographics of survey respondents by generation and gender, and another column chart showing the respondents by industry.
Market Analysis and Trends
Professional Services
This slide provides detailed demographics of survey participants, including generation, gender, and industry, to give context to the survey data presented in the report.
Demographics, Survey, Respondents, Generation, Industry
false
Market Analysis and Trends
Professional Services professional-services
Multiple Chart
EY
View slide
This slide features three sections comparing demographic characteristics of employees across different work profiles: Office Optimal, Hybrid Hopeful, Remote Ready.
Market Analysis and Trends
Professional Services
Provides analysis of key demographic characteristics influencing employee choices in different work environments, including office, hybrid, and remote work profiles.
Demographics, Work profiles, Office optimal, Hybrid hopeful, Remote ready
false
Market Analysis and Trends
Professional Services professional-services
Multiple Chart
EY
View slide
This slide presents a gender and age-based demographic analysis through bar graphs, displaying growth factors with arrow indicators to denote the doubling or tripling of user base numbers.
Market Analysis and Trends
Retail & E-commerce
Analyzing the demographic factors driving growth in online spending, it reveals that women, non-metros, and those aged 35+ will predominantly influence the market, offering valuable insights for targeted marketing strategies.
Demographics, growth drivers, online spending
false
Market Analysis and Trends
Retail & E-commerce retail-and-e-commerce
Multiple Chart
BCG
View slide
The slide shows four area charts, each representing population distribution by age group (Under 15, 15-64, 65+) for the US, Eurozone, UK, and China, with historical and forecast data.
Market Analysis and Trends
Financial Services
This slide provides demographic trends and forecasts for key regions, crucial for understanding long-term economic and market implications.
Demographics, population, age distribution, forecast, economic trends
false
Market Analysis and Trends
Financial Services financial-services
Multiple Chart
JP Morgan
View slide
Left side has images representing innovators, governments, corporates, investors. Right side lists key focus areas and actions for driving projects.
Operational Efficiency
Technology & Software
The slide provides a deep dive into strategies and approaches for large-scale demonstration projects, emphasizing collaboration and innovative solutions.
Demonstration projects, Strategy, Collaboration, Innovators, Corporates
false
Operational Efficiency
Technology & Software technology-and-software
Vertical Flow
BCG
View slide
Features title, multiple bar charts showing potential impacts of digital initiatives in Denmark with values for "Total Value at Stake" and "Trapped Value".
Investment Analysis
Technology & Software
Highlights specific digital initiatives in Denmark and their economic impact, focusing on sectors like e-commerce, connected travel, and assisted driving.
Denmark, digital initiatives, economic impact, e-commerce, connected travel
false
Investment Analysis
Technology & Software technology-and-software
Mixed Chart
Accenture
View slide
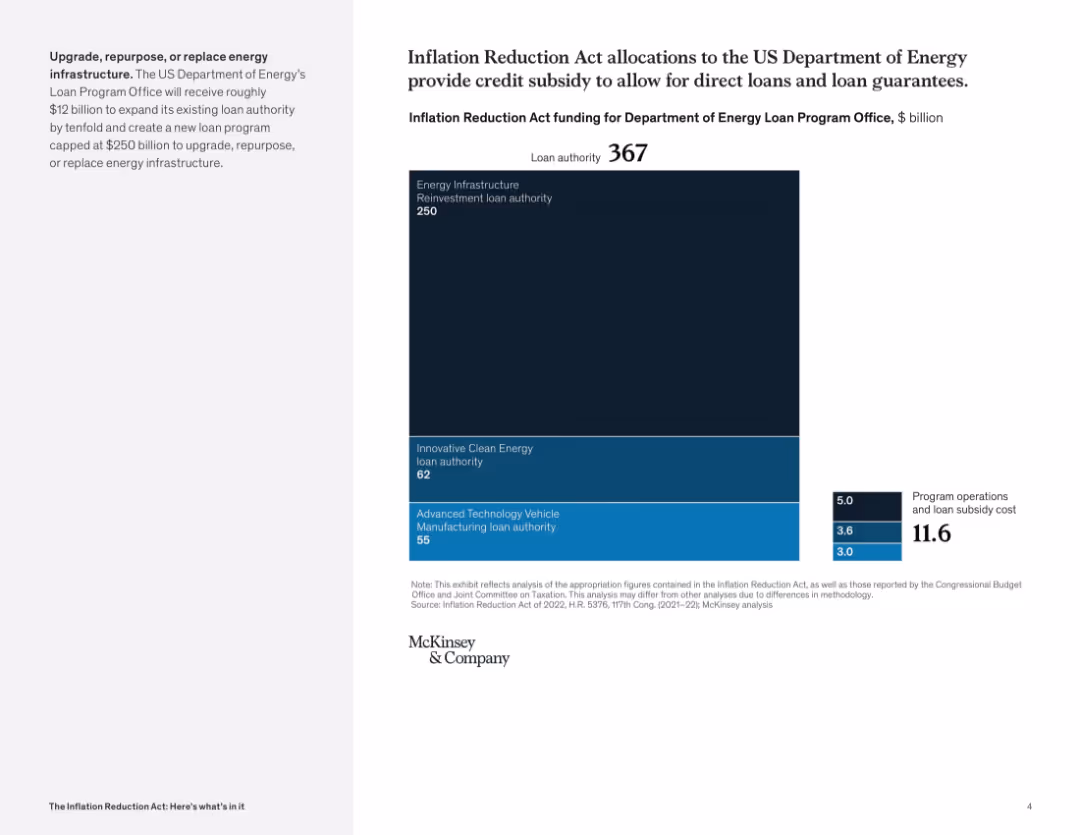
Full-screen treemap with a bold vertical block format; right-side numeric box for operational costs; left panel describes DOE program expansion.
Investment Analysis
Government & Public Sector
This slide details how $367B in IRA funding is allocated to the DOE Loan Program Office, emphasizing energy infrastructure and innovative technologies. It also accounts for operational and subsidy costs.
Department of Energy, loans, clean energy, subsidies, infrastructure, investment, vehicle tech
false
Investment Analysis
Government & Public Sector government-and-public-sector
Mixed Chart
McKinsey
View slide
This slide showcases deposit diversification in pie charts and a column chart. It details deposits by business segment and ICG deposits by region, alongside a sidebar explaining the composition of 'Deposits', 'Long-Term Debt', and other financial elements.
Operational Efficiency
Financial Services
Citigroup's slide on deposit diversification highlights the stability and sources of deposits across different business areas and regions. It could be used in presentations focusing on operational efficiency, stability in liquidity management, and showcasing financial resilience to stakeholders.
Deposit Diversification, Financial Stability, Citigroup, Business Segments, Regional Deposits, Liquidity Management
false
Operational Efficiency
Financial Services financial-services
Multiple Chart
Citigroup
View slide
This slide is structured with pie charts showing deposit distribution by business and region, and a bar chart outlining the 2Q23 liabilities and equity. Blue shades highlight different sections, and clear textual explanations accompany the visual elements.
Operational Efficiency
Financial Services
The slide discusses the deposit base's composition and stability, particularly in the Treasury and Trade Solutions (TTS) business. It demonstrates the company's strategic positioning and operational health to financial analysts and investors.
Deposit Diversification, Stability, 2Q23, Liabilities, Equity, Treasury, Trade Solutions, Operational Health, Strategic Positioning
false
Operational Efficiency
Financial Services financial-services
Multiple Chart
Citigroup
View slide
Featuring a stacked column chart, this slide visually tracks deposit growth across business segments. Annotations and a trendline for the Compound Annual Growth Rate (CAGR) are included, offering a clear visual narrative over time.
Financial Performance
Financial Services
The slide provides a historical view of deposit growth, illustrating the bank's successful client acquisition and retention strategies. It is particularly relevant for financial analysts reviewing long-term growth metrics.
Deposit Growth, CAGR, Business Segments, Client Acquisition, Retention Strategy, Financial Analysts, Long-Term Growth Metrics
false
Financial Performance
Financial Services financial-services
Single Chart
Citigroup
View slide
A compound graph with stacked bars and a trend line that illustrates the historical growth of deposits over several years. The graph uses different shades to distinguish between business segments like 'TTS', 'USBP', 'SS', and 'Wealth'.
Financial Performance
Financial Services
The slide offers a historical perspective on deposit growth trends at Citigroup, useful for financial reviews and planning. It visually represents growth patterns, which are crucial for understanding the company's liquidity trends and could be a focal point in stakeholder reports or strategic financial discussions.
Deposit Growth, Historical Data, Citigroup, Financial Trends, Liquidity, Business Segments, CAGR
false
Financial Performance
Financial Services financial-services
Single Chart
Citigroup
View slide
Two column charts show 3-year deposit CAGR and national retail deposit share, with Chase compared against industry and large banks. The slide has a clear visual distinction between Chase and its peers, using color coding to highlight differences.
Market Analysis and Trends
Financial Services
This slide analyzes the bank's deposit growth and market share relative to the industry, emphasizing the bank's outperformance in deposit CAGR and its ascension in retail deposit share rankings, evidencing competitive advantage and market influence.
Deposit growth, Market share, Competitive analysis, CAGR, Retail banking, Industry comparison
false
Market Analysis and Trends
Financial Services financial-services
Multiple Chart
JP Morgan
View slide
A line chart showing the difference between central bank policy rates and banks' average deposit rates in the Euro area and the UK over time, with commentary on the right.
Market Analysis and Trends
Financial Services
This slide explains the impact of central bank policy rate changes on bank deposit rates in Europe and the UK, highlighting implications for corporate cash balances and bank earnings.
Deposit pricing, central bank rates, Euro area, UK, bank earnings, corporate implications
false
Market Analysis and Trends
Financial Services financial-services
Mixed Chart
Accenture
View slide
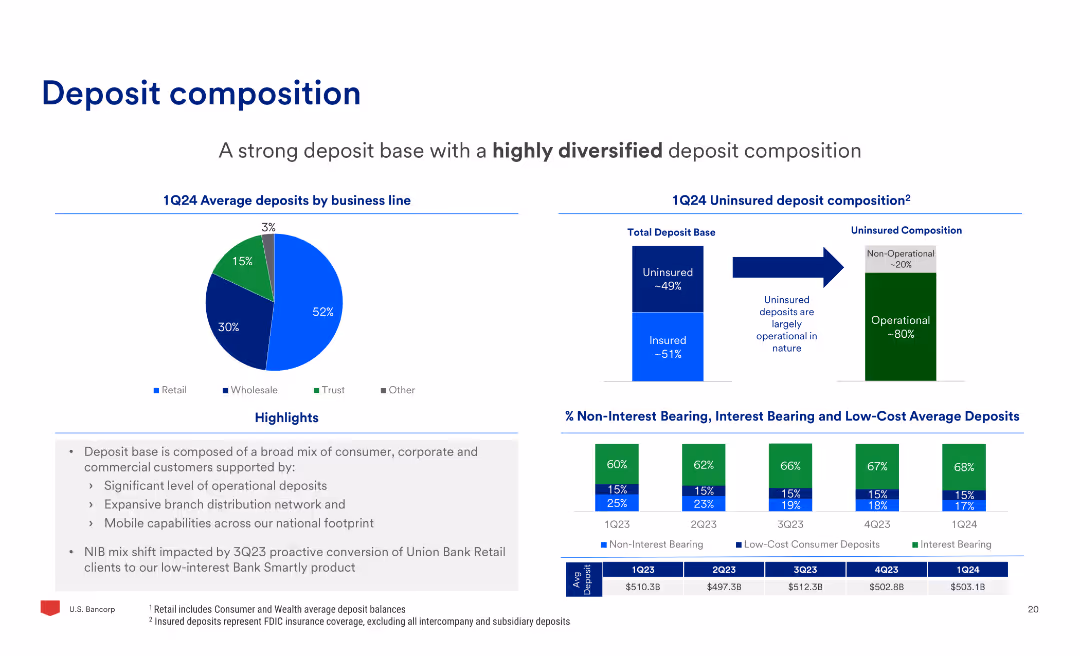
The slide includes a pie chart of average deposits by business line, a bar chart of uninsured deposit composition, and a bar chart of non-interest bearing, interest bearing, and low-cost deposits.
Market Analysis and Trends
Financial Services
The slide analyzes the deposit composition, highlighting the diversification of deposits by business line and the composition of uninsured deposits, with a focus on operational deposits.
Deposits, Composition, Business, Uninsured, Interest, Operational
false
Market Analysis and Trends
Financial Services financial-services
Multiple Chart
Barclays
View slide
This slide includes a pie chart and a checklist. The pie chart illustrates the composition of total deposits, and the checklist outlines the characteristics of the deposits. The slide is clear and informative with a straightforward presentation of data.
Operational Efficiency
Financial Services
It breaks down the firm's deposit base, showing diversification and insurance coverage. With details on deposit types and insurance, it could be used for presentations on financial stability and deposit strategies.
Deposits, Diversification, FDIC Insured, Funding Liabilities, Deposit Composition
false
Operational Efficiency
Financial Services financial-services
Mixed Chart
Goldman Sachs
View slide
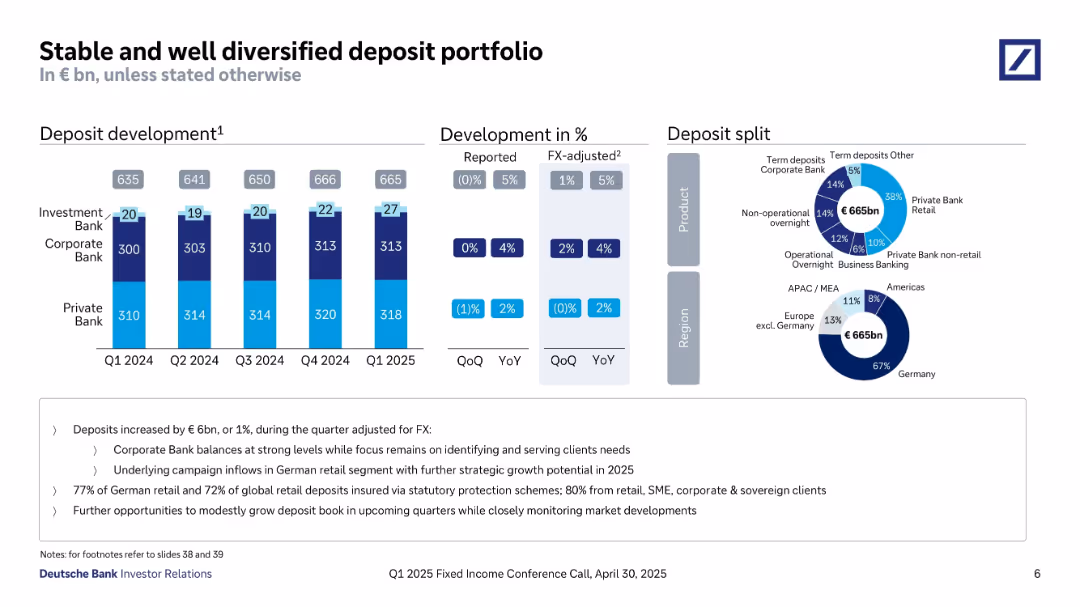
Includes stacked bar charts of deposit development, % development table, donut charts showing product and regional splits, and descriptive text.
Performance Metrics and KPIs
Financial Services
The slide reports stable deposit growth (+€6bn QoQ) to €665bn by Q1 2025. It analyzes composition across Corporate, Private, and Investment Banks, and discusses insurance protection and potential for further growth in retail deposits.
Deposits, Diversification, Growth, Private Bank, Corporate Bank, Product Split, Region Split, Insurance
false
Performance Metrics and KPIs
Financial Services financial-services
Multiple Chart
Deutsche Bank
View slide
Features pie charts and a stacked bar chart illustrating the breakdown of deposits by business type and region, along with long-term debt and other liabilities.
Operational Efficiency
Financial Services
Provides insights into the deposit structure and liability distribution of a financial institution, emphasizing operational efficiency in managing diverse financial resources.
Deposits, Diversification, Pie Charts, Banking, Operational Efficiency, Liabilities, Financial Management
false
Operational Efficiency
Financial Services financial-services
Multiple Chart
Citigroup
View slide
The slide shows a time-series column chart with incremental increases annotated, and text boxes highlighting key figures and trends in customer deposits.
Market Analysis and Trends
Financial Services
Highlights the consistent growth in Macquarie's customer deposits, emphasizing the strategy behind expanding the deposit base over several years.
Deposits, Growth, Strategy, BFS, CMA
false
Market Analysis and Trends
Financial Services financial-services
Mixed Chart
Morgan Stanley
View slide
Contains a column chart showcasing the growth of deposits over time segmented by different business units within the organization.
Financial Performance
Financial Services
Used to demonstrate the consistent increase in deposits across various segments of a financial institution, reflecting healthy financial growth and stability.
Deposits, Growth, Trends, Line Graph, Financial Stability, Banking, Performance, Analysis
false
Financial Performance
Financial Services financial-services
Single Chart
Citigroup
View slide
Includes multiple pie charts and a column chart detailing the deposit and loan distribution by business type and product, with annotations explaining key strategies.
Financial Performance
Financial Services
This slide details the bank's deposit and loan structures as of Q1 2023, highlighting diversity and stability across different banking sectors and products, and outlines how these are managed to mitigate risks and ensure growth.
Deposits, Loans, Banking, Diversification, Q1 2023, Risk Management, Stability, Growth
false
Financial Performance
Financial Services financial-services
Multiple Chart
Deutsche Bank
Previous
Loading...
Hold On!
We are searching in our database
If nothing, comes up, please try different filters!
Column Chart
Heatmap
Chevron
Org Chart
Infographic
Callouts
Timeline
List
Graphic
Picture
Process Flow
Diagram
Paragraph
Map
Table
Framework
Subtitle
Takeaway Box
Icon
Other Chart
Radar Chart
Waterfall Chart
Mekko Chart
Pie Chart
Scatter Plot
Line Chart
Bar chart
Bullet points
Create a FREE account to continue browsing
Receive Instant Access to 1,000+ slides from companies like McKinsey, Google, and Goldman Sachs
First Name
Last Name
Email
Password
I agree to all
Terms & Privacy Policy
Thank you! Your submission has been received!
Oops! Something went wrong while submitting the form.
Have an account?
Sign in
Upgrade to PRO to Save slides
Advanced Search and Filters
Access to 15,000+ slides
Access to Category Pages
Save/Bookmark Slides
PowerPoint Template Library
Pick a Plan
MONTHLY
$12/month
Billed every month, Cancel anytime.
YEARLY
$9/year
Billed $108 annually, Cancel anytime.
Checkout for $12/month
Checkout for $108/yr
Secured by Stripe | AES-256 bit encryption