My Account
My Slides
Search by Category
Templates
View All Templates
Download Template Slides
Leave Feedback
Login
Logout
Get Started
Browse all Slides
Browse all Slides
Create a FREE Account
Instant access to 1,000+ real slides from top companies like McKinsey, BCG, Goldman Sachs, Google and many more!
First Name
Last Name
Email
Password
I agree to all
Terms & Privacy Policy
Thank you! Your submission has been received!
Oops! Something went wrong while submitting the form.
Have an account?
Sign in
Spark Your Next Big Idea with New Presentation Templates
VIEW ALL Templates
Welcome,
Welcome
PRO
Show Featured Only
Checkbox 8
Companies
Mckinsey
Bain
BCG
EY
Deloitte
Accenture
PwC/Strategy&
JP Morgan
Goldman Sachs
Morgan Stanley
Citigroup
Deutsche Bank
Barclays
LEK
KPMG
Kearney
Oliver Wyman
Booz Allen Hamilton
Gartner
IPSOS
Nielsen
Slide type
Text Only
Linear Flow
Vertical Flow
Single Chart
Header Horizontal
Mixed Chart
Header Vertical
Pillar
Multiple Chart
Graphic
Agenda
Title
Table
Framework
Industry
Technology & Software
Artificial Intelligence
Financial Services
Retail & E-commerce
Consumer Goods
Industrial & Manufacturing
Transportation & Logistics
Telecommunications
Real Estate & Construction
Hospitality & Tourism
Professional Services
Education & Training
Media & Entertainment
Agriculture & Food Production
Healthcare & Pharmaceuticals
Environmental Services & Sustainability
Government & Public Sector
Use Case
Mergers and Acquisitions
Performance Metrics and KPIs
Client Case Studies
Competitive Landscape
Corporate Finance and Valuation
Product and Service Analysis
Customer and Market Segmentation
Organizational Structure and Change
Industry Overview
Regulatory and Compliance
Risk Assessment and Management
Investment Analysis
Organizational Structure and Change
Human Resources and Talent Management
Financial Performance
Market Analysis and Trends
Sales and Business Development
Human Resources and Talent Management
Clear all
Thank you! Your submission has been received!
Oops! Something went wrong while submitting the form.
Tag
View slide
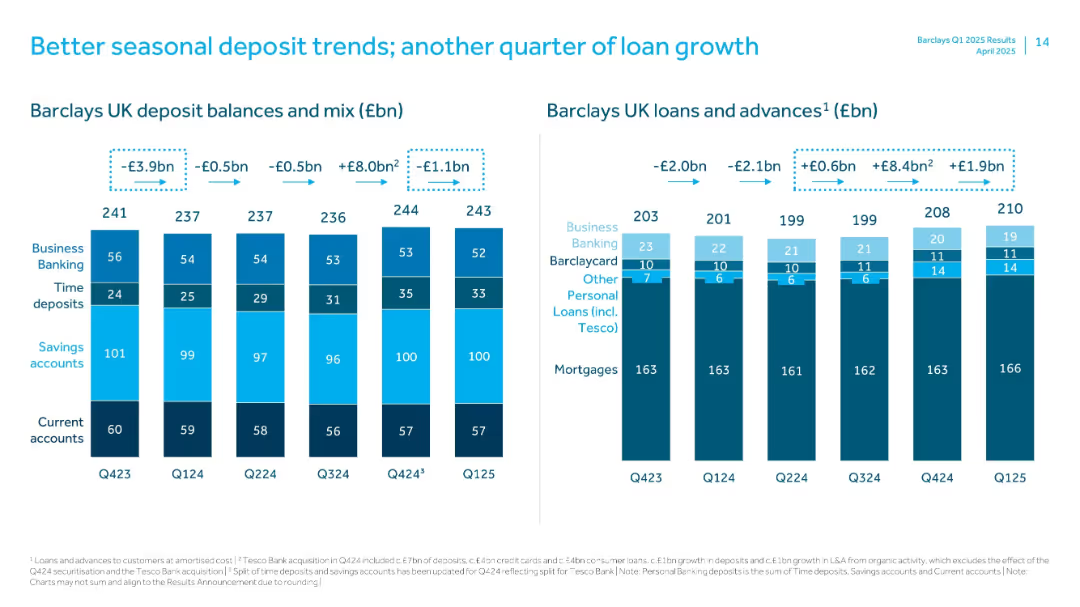
Dual stacked bar charts tracking deposit balances/mix and loans/advances over time, segmented by category.
Performance Metrics and KPIs
Financial Services
Compares quarterly trends in deposits and loan growth. Deposit balances show seasonal shifts, while loans and advances have seen consistent growth. Breakdowns include business banking, savings, current accounts, and personal loans including Tesco.
Deposits, Loans, Barclays UK, Seasonal Trends, Tesco, Q125, Personal Banking, Advances, Balances
false
Performance Metrics and KPIs
Financial Services financial-services
Multiple Chart
Barclays
View slide
Contains a series of column charts and data tables presenting loan and deposit figures over several quarters, with emphasis on trends and adjustments for currency effects.
Financial Performance
Financial Services
Details recent trends in the bank's deposit and loan figures, illustrating strategic financial management and stability in the face of economic challenges, with a focus on year-over-year comparisons and foreign exchange adjustments.
Deposits, Loans, Trends, Financial Stability, Economic Challenges, Currency Adjustments
false
Financial Performance
Financial Services financial-services
Multiple Chart
Deutsche Bank
View slide
Donut charts showing breakdown of deposits by type, currency, and client segment, along with summary of new deposits and money inflows.
Financial Performance
Financial Services
Analysis of UBS's deposit base, including new deposits, types of deposits, and distribution by currency and client segment.
Deposits, currency, segments, inflows, diversification
false
Financial Performance
Financial Services financial-services
Multiple Chart
UBS
View slide
Features column chart with blue and grey colors illustrating derivatives and financial impacts. Clear layout with key points.
Risk Assessment and Management
Financial Services
Evaluates the impacts of netting and collateral on derivatives for risk reduction in financial reporting.
Derivatives, IFRS, financial risk, collateral, netting, financial reporting, asset management
false
Risk Assessment and Management
Financial Services financial-services
Mixed Chart
Deutsche Bank
View slide
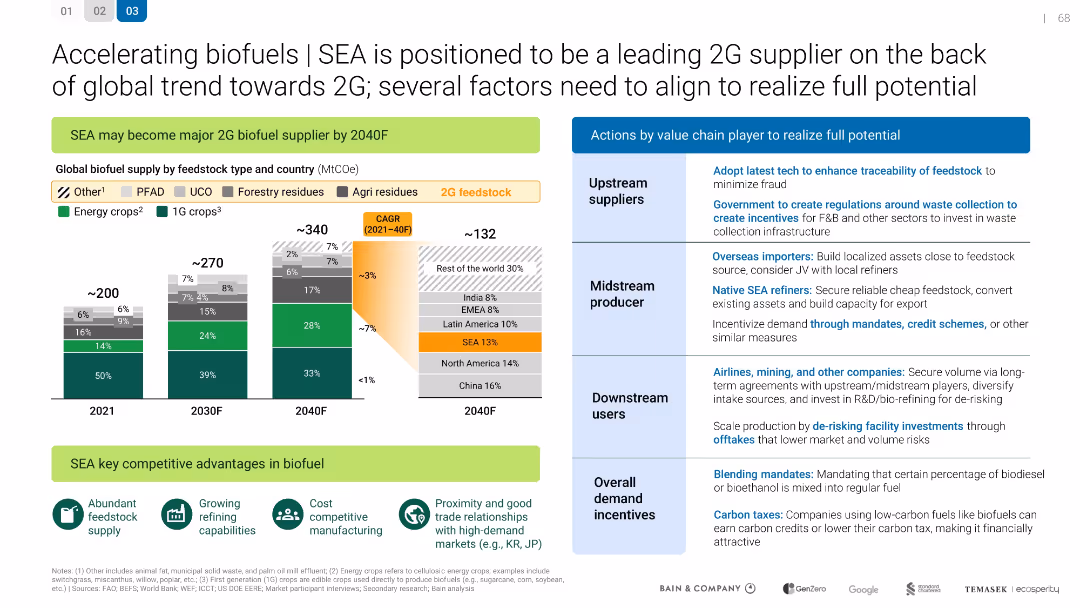
SEA is positioned to be a leading 2G supplier
Technology and Digital Transformation
Energy & Utilities
Technology and Digital Transformation
Describes how SEA can become a major 2G biofuel supplier by 2040. Details feedstock supply projections and value chain actions needed for success, including regulations, investment, and market development.
false
Technology and Digital Transformation
Energy & Utilities energy-and-utilities
Mixed Chart
Bain
View slide
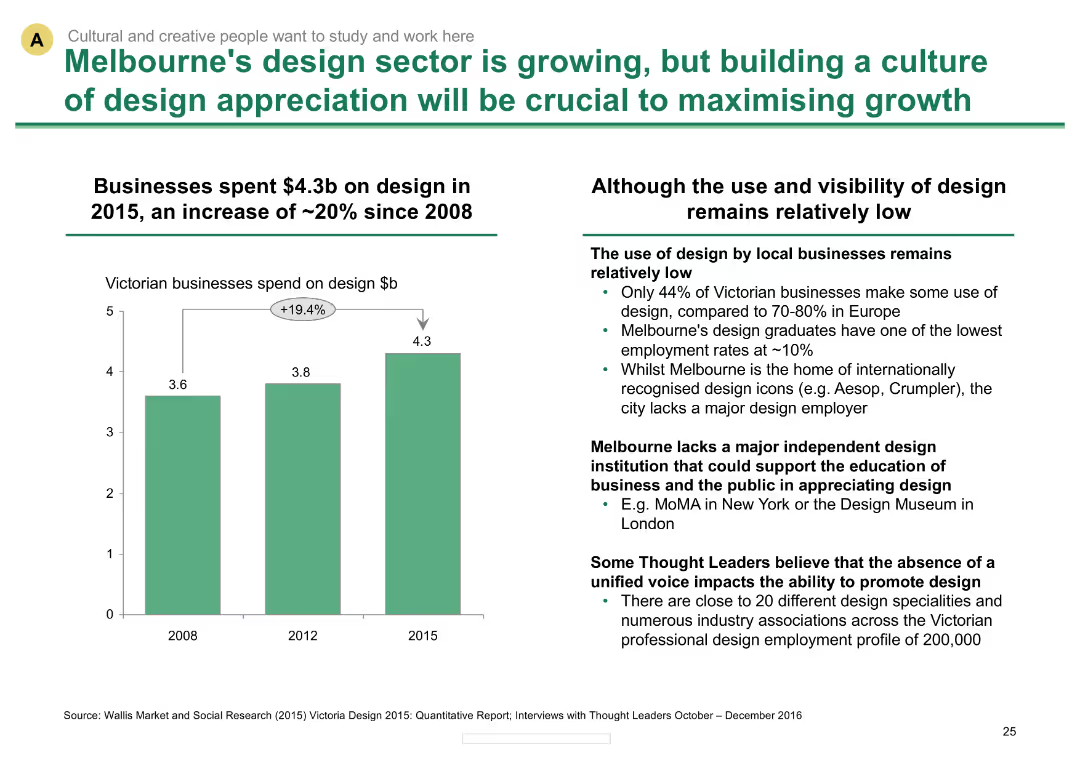
Column chart showing growth in design spending; text describing challenges in design sector visibility
Market Analysis and Trends
Industrial & Manufacturing
Analyzes growth in Melbourne's design sector and challenges in increasing design appreciation among businesses
Design sector growth, business spending, design challenges, Melbourne, industry trends
false
Market Analysis and Trends
Industrial & Manufacturing industrial-and-manufacturing
Mixed Chart
BCG
View slide
Graphical representation of deskless workers in various industries, icons for each sector, and a high-impact indicator.
Technology and Digital Transformation
Technology & Software
Overview of industries with a high proportion of non-desk workers potentially affected by AR/VR technologies, emphasizing immersive reality's scalability in these sectors.
Deskless workers, industries, AR, VR, immersive reality, scalability
false
Technology and Digital Transformation
Technology & Software technology-and-software
Graphic
McKinsey
View slide
This slide uses a content layout with a process flow diagram and a detailed table outlining reasons for IV-E ineligibility and related processes. The layout is moderately detailed with a balance of text and visual elements.
Financial Performance
Government & Public Sector
Slide features a flowchart of the fiscal specialist unit process and a table of reasons for IV-E ineligibility with solutions.
Details the fiscal process for identifying funding and overcoming ineligibility issues, providing a flowchart and a table with next steps to address common problems.
false
Financial Performance
Government & Public Sector government-and-public-sector
Linear Flow
Alvarez & Marsal
View slide
The slide is structured with sections on implementation requirements, timeline outline, and risks. Icons and text boxes detail the necessary people, processes, technology, and preparatory work. A timeline outlines project phases over four years, and a risk section discusses potential challenges.
Strategic Planning
Technology & Software
Slide features implementation requirements, timeline outline, and risks. Includes icons and text blocks for various sections.
Details the implementation requirements for IT systems development, including people, process, and technology aspects, along with risks and a timeline.
false
Strategic Planning
Technology & Software technology-and-software
Table
Alvarez & Marsal
View slide
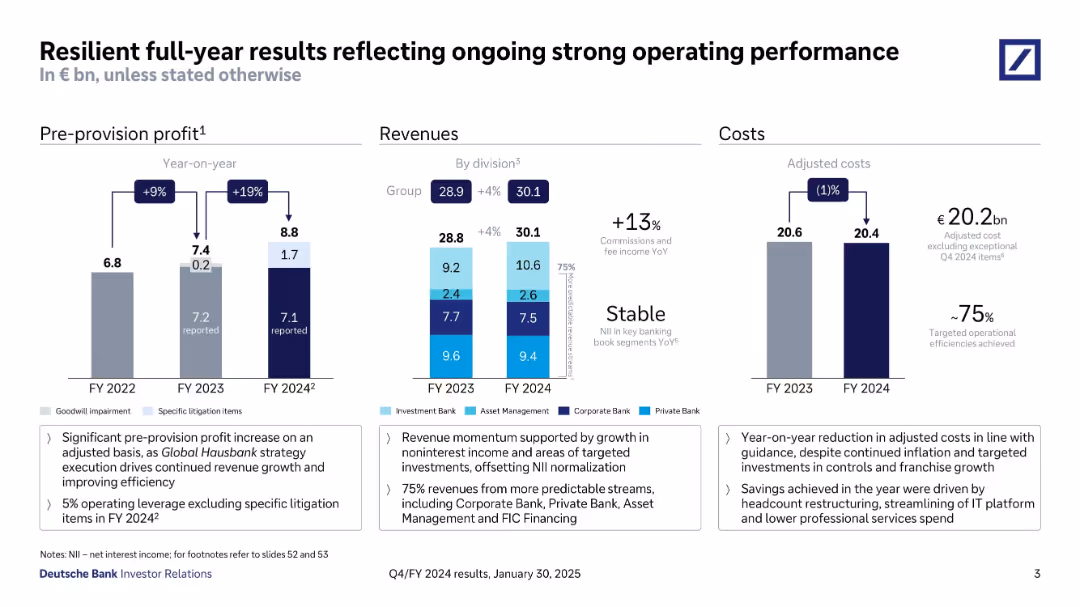
Three-column layout with bar charts showing pre-provision profit, revenues by division, and adjusted costs; annotations and callouts below.
Financial Performance
Financial Services
Deutsche Bank’s FY2024 performance summary: revenues rose 4% YoY to €30.1bn, pre-provision profit reached €8.8bn, and adjusted costs were €20.4bn. Highlights include strong noninterest income and improved efficiency metrics.
Deutsche Bank, FY24, revenue, cost, profit, performance, efficiency, investor relations
false
Financial Performance
Financial Services financial-services
Multiple Chart
Deutsche Bank
View slide
This slide features four images, each representing a different development project, with corresponding cost estimates and timelines from 2022 to 2035. The images have an 'artist impression' label, indicating they are conceptual representations. There is also a footnote about the manager's monitoring of development under contract compliance with regulations.
Strategic Planning
Real Estate & Construction
Depicts a timeline of major construction projects within a real estate portfolio, showing investment in development projects currently underway or in planning stages.
Development Pipeline, Real Estate Projects, Construction Investment, Projected Costs, Timeline, Regulatory Compliance
false
Strategic Planning
Real Estate & Construction real-estate-and-construction
Image
Morgan Stanley
View slide
The slide is data-focused, containing several statistics and data points highlighted by blue markers. Icons are used to visually represent the different metrics, and there's a balance of text and imagery to keep the viewer engaged.
Strategic Planning
Technology & Software
This slide presents compelling data points to showcase the importance of next-generation software development capabilities. It seems aimed at decision-makers, underscoring the strategic benefits such as faster development and deployment, as well as AI's role in testing and maintenance.
Development, Leadership, Strategy, Software, AI, Capabilities, Testing, Deployment
false
Strategic Planning
Technology & Software technology-and-software
Header Horizontal
McKinsey
View slide
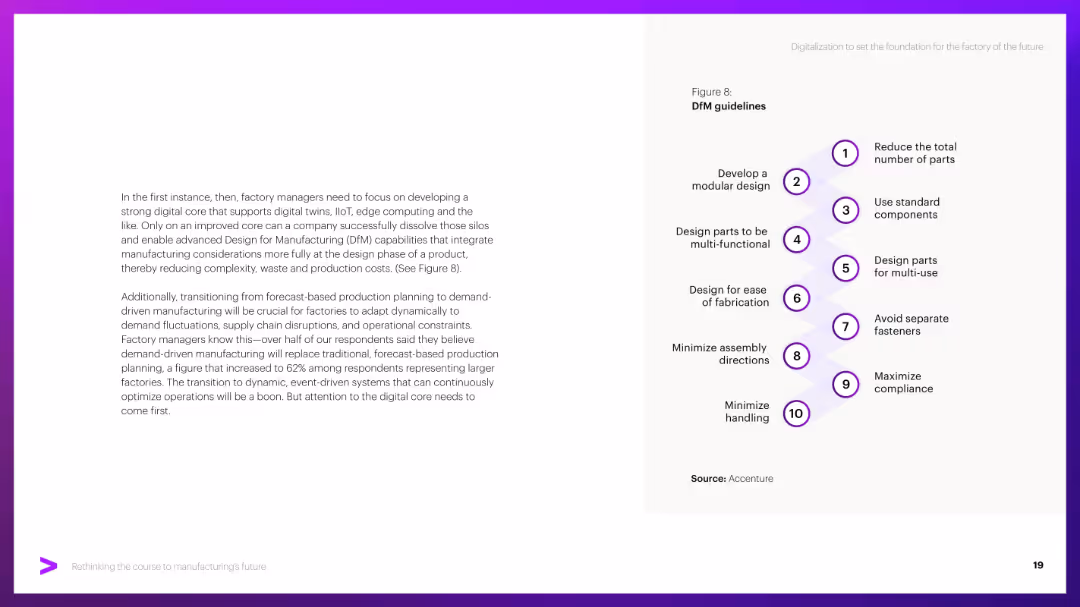
Left side narrative; right side features a vertical flow diagram with 10 numbered guidelines.
Operational Efficiency
Industrial & Manufacturing
Lists ten principles for Design for Manufacturing (DfM), such as minimizing parts and simplifying assembly. Emphasizes building a strong digital core to integrate IIoT, edge computing, and digital twins.
DfM, design guidelines, modular design, digital core, IIoT, simplification
false
Operational Efficiency
Industrial & Manufacturing industrial-and-manufacturing
Vertical Flow
Accenture
View slide
Column chart displaying the percentage of respondents planning to increase investment/capacity in various clinical services over the next three years.
Market Analysis and Trends
Healthcare & Pharmaceuticals
This slide shows a survey of hospitals planning to increase investment in clinical services, highlighting diagnostic imaging and primary care.
Diagnostic imaging, investment, clinical services, healthcare, survey
false
Market Analysis and Trends
Healthcare & Pharmaceuticals healthcare-and-pharmaceuticals
Single Chart
LEK
View slide
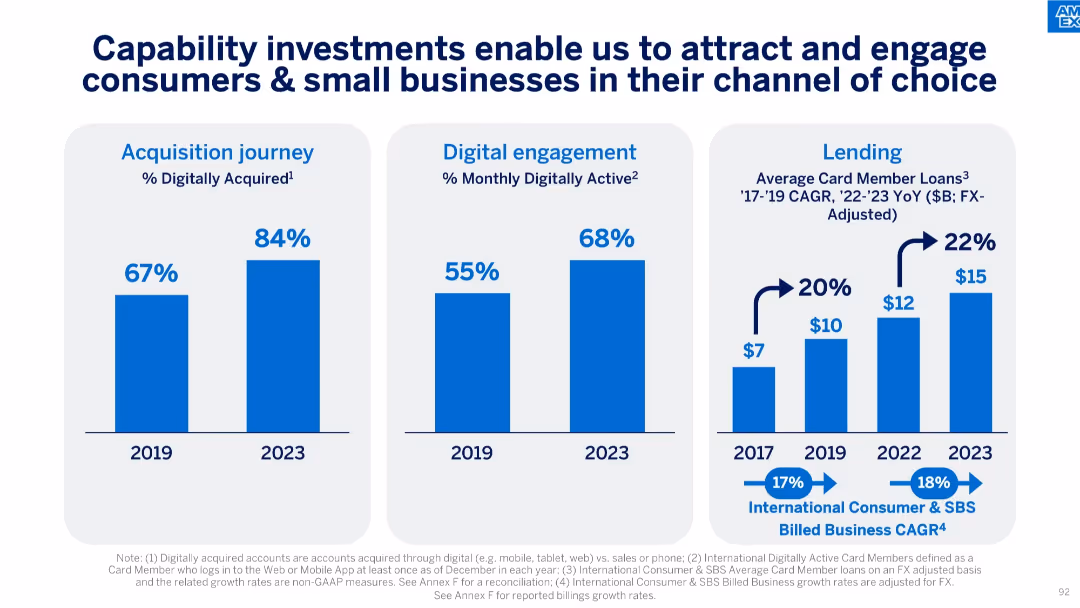
Three vertical bar charts showing trends in digital acquisition, engagement, and lending from 2017–2023.
Technology and Digital Transformation
Financial Services
The slide emphasizes improvements in digital engagement and lending as a result of capability investments. It shows increasing digital acquisition and activity, as well as growth in average card member loans over time.
Digital Acquisition, Lending, Engagement, Growth, Technology Investment, Card Members, CAGR, Loans
false
Technology and Digital Transformation
Financial Services financial-services
Multiple Chart
McKinsey
View slide
The slide features two column charts comparing data from 2018 and 2019 with annotations, along with a text block providing additional context.
Operational Efficiency
Financial Services
Showcases the impact of digital account openings on customer acquisition and the resultant decrease in marketing costs, underlining the effectiveness of digital strategies in finance.
Digital Acquisition, Marketing Costs, Finance, Account Openings, Cost Efficiency
false
Operational Efficiency
Financial Services financial-services
Multiple Chart
JP Morgan
View slide
Contains column charts comparing traditional and digital sales interactions among B2B decision-makers.
Technology and Digital Transformation
Technology & Software
Examines the rise in digital sales channels, highlighting consumer and business preferences for digital interactions over traditional methods during the COVID-19 pandemic.
Digital Adoption, B2B, Sales, COVID-19, Trends
false
Technology and Digital Transformation
Technology & Software technology-and-software
Multiple Chart
McKinsey
View slide
This slide displays percentages and bullet points detailing the increase in usage of digital services like online retail, digital wallets, and streaming services. Each chart is accompanied by explanatory text.
Technology and Digital Transformation
Technology & Software
Explores the surge in digital tool adoption among consumers, driven by the pandemic, and compares it to historical trends such as the SARS outbreak. Highlights the increased dependence on digital platforms and services.
Digital Adoption, COVID-19, E-commerce, Streaming
false
Technology and Digital Transformation
Technology & Software technology-and-software
Header Horizontal
BCG
View slide
Includes column charts comparing the implementation of digital technologies like Cloud, BI, RPA, and Cognitive & AI across regions.
Operational Efficiency
Technology & Software
Discusses the lagging adoption of digital technologies in the Nordics for cost reduction compared to other regions, projected implementation over the next 24 months, and the success outcomes of these technologies.
Digital Adoption, Cost Reduction, Technology Implementation, Nordic
false
Operational Efficiency
Technology & Software technology-and-software
Multiple Chart
Deloitte
View slide
Showcases column charts for digital application starts and loan engagement, and a large light blue bar indicating the growth of visitors on the MyHome platform. Annotations provide additional context for the data.
Operational Efficiency
Financial Services
Highlights the growth of digital adoption in the home lending process, with an increase in applications started digitally, customer engagement with digital loan capabilities, and MyHome platform traffic, leading to improved customer outcomes.
Digital Adoption, Home Lending, Customer Engagement, Platform Growth, Efficiency
false
Operational Efficiency
Financial Services financial-services
Multiple Chart
JP Morgan
View slide
Bullet points and icons create a navigable visual hierarchy. The design is straightforward, highlighting the key imperatives for digital adoption acceleration.
Strategic Planning
Technology & Software
Focuses on the imperatives that need to be accelerated to boost digital adoption in Indonesia. Aimed at guiding government policy development and enhancing the Indonesian internet economy, especially in tier 2 and 3 cities.
Digital Adoption, Imperatives, Policy Development, Internet Economy, Indonesia, Tier 2 and 3 Cities, Government
false
Strategic Planning
Technology & Software technology-and-software
Pillar
Kearney
View slide
Matrix arrangement of icons representing digital adoption enablers against a grayscale backdrop. Organized and digestible presentation of key elements.
Market Analysis and Trends
Technology & Software
Evaluates Indonesia's digital ecosystem, identifying enablers for digital adoption. Useful for stakeholders to assess capabilities and strategize on improving digital infrastructure and policy.
Digital Adoption, Infrastructure, Access to Capital, Regulatory, Talent Development, Consumer Education, Ecosystem
false
Market Analysis and Trends
Technology & Software technology-and-software
Pillar
Kearney
View slide
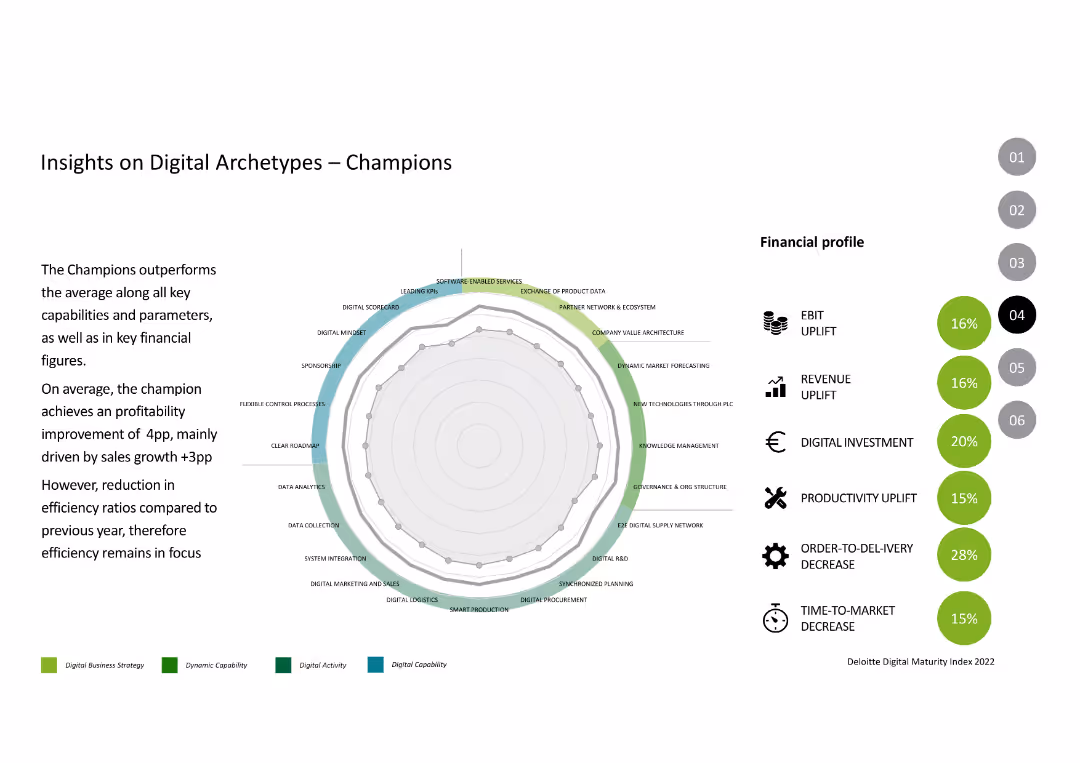
The slide features a radar chart with multiple parameters like digital mindset, market forecasting, and software-enabled services, alongside financial profile metrics like EBIT and revenue uplift.
Competitive Landscape
Industrial & Manufacturing
This slide analyzes the performance of "Champions" in digital transformation, highlighting their strengths in various digital capabilities and financial metrics.
Digital Archetypes, Champions, Performance, Digital Transformation, Financial Metrics
false
Competitive Landscape
Industrial & Manufacturing industrial-and-manufacturing
Mixed Chart
Deloitte
View slide
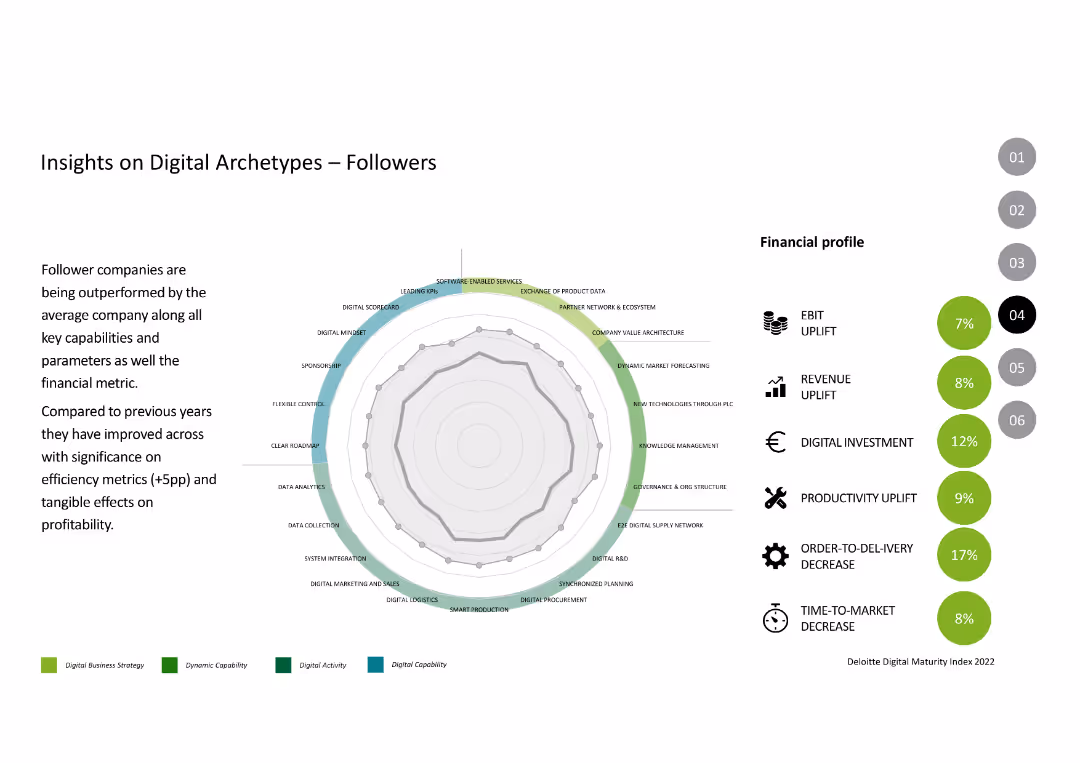
The slide contains a radar chart and financial profile metrics like EBIT uplift, revenue uplift, and productivity uplift, similar to other archetype slides.
Competitive Landscape
Industrial & Manufacturing
The slide provides insights into the "Followers" archetype, showing how they are outperformed by the average company but have made significant improvements in efficiency and profitability.
Digital Archetypes, Followers, Performance, Digital Capabilities, Financial Metrics
false
Competitive Landscape
Industrial & Manufacturing industrial-and-manufacturing
Mixed Chart
Deloitte
View slide
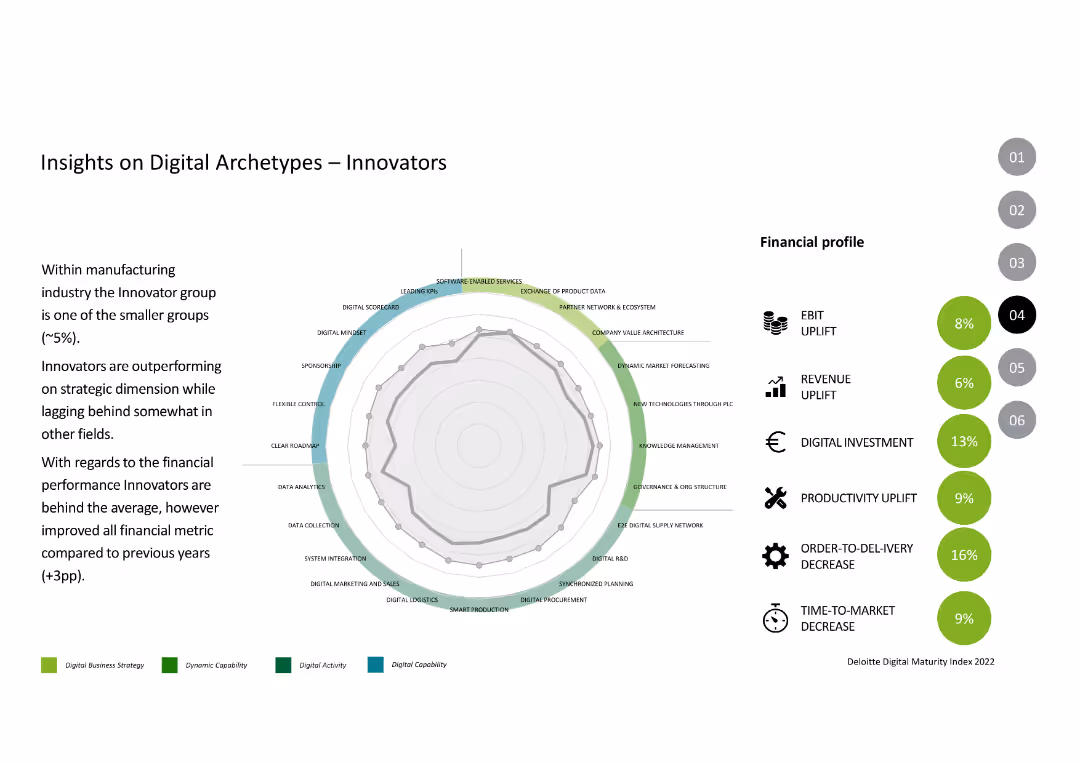
The slide features a radar chart with various parameters like digital mindset and software-enabled services, along with financial metrics such as EBIT and revenue uplift.
Competitive Landscape
Industrial & Manufacturing
This slide describes the "Innovators" archetype, focusing on their strengths in strategic dimensions and improvements in financial performance compared to previous years.
Digital Archetypes, Innovators, Performance, Digital Capabilities, Financial Metrics
false
Competitive Landscape
Industrial & Manufacturing industrial-and-manufacturing
Mixed Chart
Deloitte
View slide
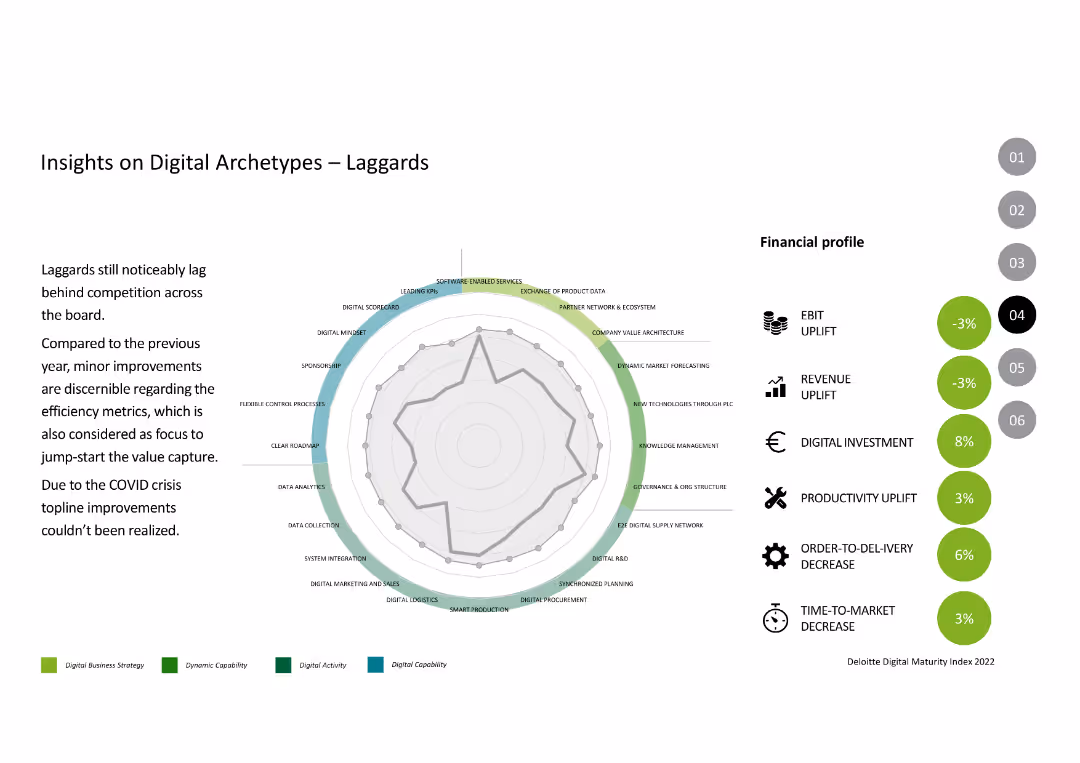
The slide features a radar chart and financial profile metrics like EBIT uplift, revenue uplift, and productivity uplift, similar to previous archetype slides.
Competitive Landscape
Industrial & Manufacturing
This slide discusses the "Laggards" archetype, focusing on their lagging performance compared to competition, highlighting their minor improvements and impact of the COVID crisis.
Digital Archetypes, Laggards, Performance, Digital Capabilities, Financial Metrics
false
Competitive Landscape
Industrial & Manufacturing industrial-and-manufacturing
Mixed Chart
Deloitte
View slide
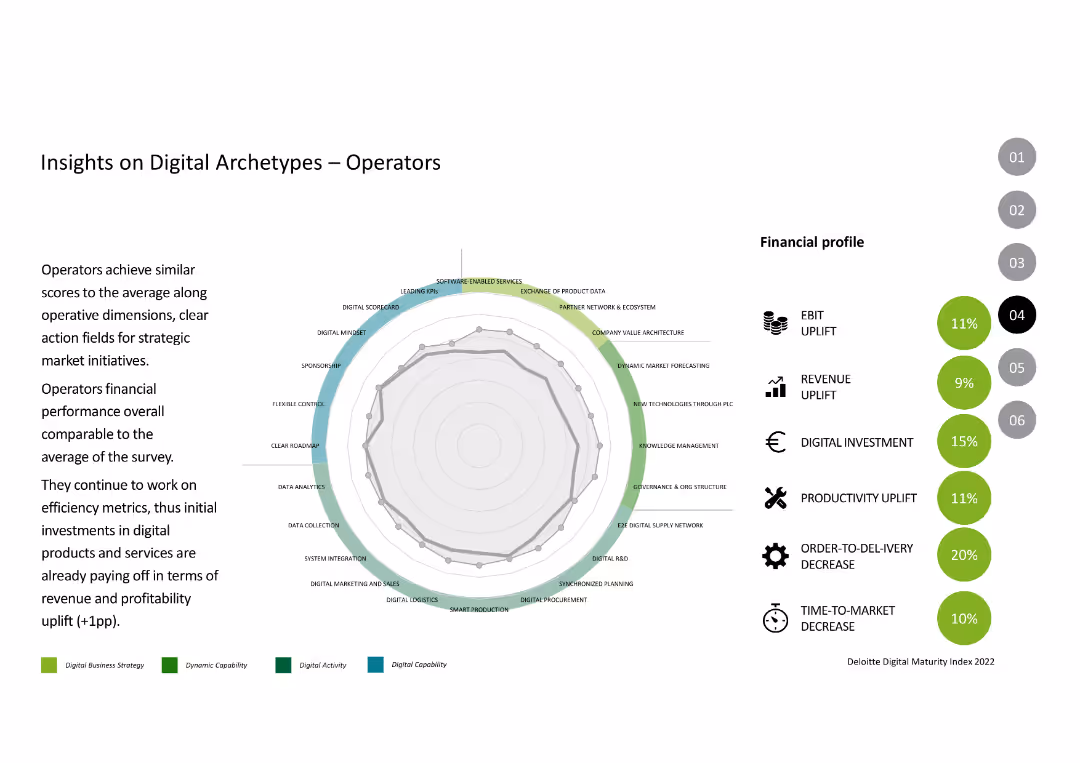
The slide includes a radar chart showing capabilities and financial metrics like EBIT uplift, revenue uplift, and productivity uplift, similar to previous archetype slides.
Competitive Landscape
Industrial & Manufacturing
The slide analyzes the "Operators" archetype, comparing their digital capabilities and financial performance to the average, highlighting their strengths and areas for improvement.
Digital Archetypes, Operators, Performance, Digital Capabilities, Financial Metrics
false
Competitive Landscape
Industrial & Manufacturing industrial-and-manufacturing
Mixed Chart
Deloitte
View slide
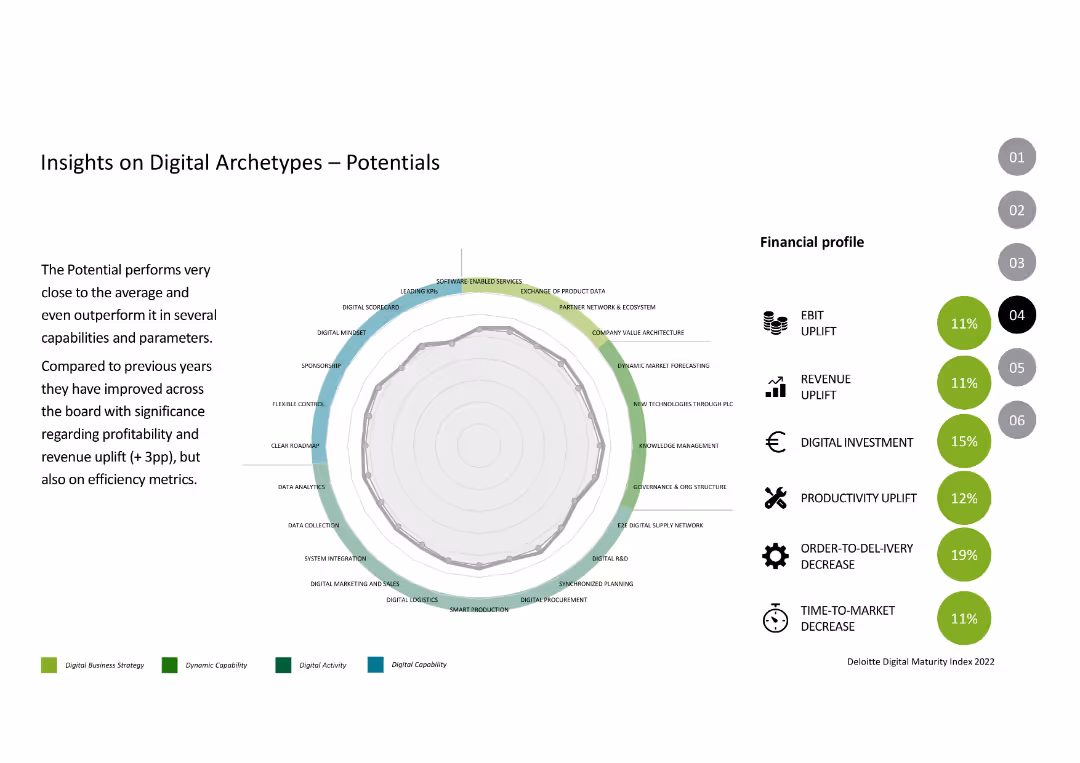
The slide includes a radar chart showing capabilities and parameters, with financial profile metrics like EBIT, revenue uplift, and productivity uplift.
Competitive Landscape
Industrial & Manufacturing
The slide discusses the "Potentials" archetype, showing their improvement in digital capabilities and financial performance over the previous year.
Digital Archetypes, Potentials, Performance, Digital Capabilities, Financial Metrics
false
Competitive Landscape
Industrial & Manufacturing industrial-and-manufacturing
Mixed Chart
Deloitte
View slide
Five sections each with an icon and text: Native tokens, Stablecoins & CBDCs, Governance tokens, NFTs, Tokenized real world assets. Icons represent various digital assets.
Product and Service Analysis
Financial Services
Describes five types of digital assets issued on blockchains: native tokens, stablecoins, governance tokens, NFTs, and tokenized real world assets. For product categorization in blockchain services.
Digital Assets, Blockchain, NFTs, Stablecoins, Governance, Tokenization, Real World Assets
false
Product and Service Analysis
Financial Services financial-services
Table
McKinsey
View slide
Flow chart showing the evolution of digital asset use cases: Store of value, Medium of exchange, Financial services. Icons and descriptions for each phase.
Strategic Planning
Financial Services
Describes the evolution and future potential of digital asset use cases in financial services. Ideal for strategic discussions on the adoption and integration of digital assets.
Digital Assets, Evolution, Financial Services, Use Cases, Store of Value, Medium of Exchange
false
Strategic Planning
Financial Services financial-services
Linear Flow
McKinsey
Previous
Loading...
Hold On!
We are searching in our database
If nothing, comes up, please try different filters!
Column Chart
Heatmap
Chevron
Org Chart
Infographic
Callouts
Timeline
List
Graphic
Picture
Process Flow
Diagram
Paragraph
Map
Table
Framework
Subtitle
Takeaway Box
Icon
Other Chart
Radar Chart
Waterfall Chart
Mekko Chart
Pie Chart
Scatter Plot
Line Chart
Bar chart
Bullet points
Create a FREE account to continue browsing
Receive Instant Access to 1,000+ slides from companies like McKinsey, Google, and Goldman Sachs
First Name
Last Name
Email
Password
I agree to all
Terms & Privacy Policy
Thank you! Your submission has been received!
Oops! Something went wrong while submitting the form.
Have an account?
Sign in
Upgrade to PRO to Save slides
Advanced Search and Filters
Access to 15,000+ slides
Access to Category Pages
Save/Bookmark Slides
PowerPoint Template Library
Pick a Plan
MONTHLY
$12/month
Billed every month, Cancel anytime.
YEARLY
$9/year
Billed $108 annually, Cancel anytime.
Checkout for $12/month
Checkout for $108/yr
Secured by Stripe | AES-256 bit encryption