My Account
My Slides
Search by Category
Templates
View All Templates
Download Template Slides
Leave Feedback
Login
Logout
Get Started
Browse all Slides
Browse all Slides
Create a FREE Account
Instant access to 1,000+ real slides from top companies like McKinsey, BCG, Goldman Sachs, Google and many more!
First Name
Last Name
Email
Password
I agree to all
Terms & Privacy Policy
Thank you! Your submission has been received!
Oops! Something went wrong while submitting the form.
Have an account?
Sign in
Spark Your Next Big Idea with New Presentation Templates
VIEW ALL Templates
Welcome,
Welcome
PRO
Show Featured Only
Checkbox 8
Companies
Mckinsey
Bain
BCG
EY
Deloitte
Accenture
PwC/Strategy&
JP Morgan
Goldman Sachs
Morgan Stanley
Citigroup
Deutsche Bank
Barclays
LEK
KPMG
Kearney
Oliver Wyman
Booz Allen Hamilton
Gartner
IPSOS
Nielsen
Slide type
Text Only
Linear Flow
Vertical Flow
Single Chart
Header Horizontal
Mixed Chart
Header Vertical
Pillar
Multiple Chart
Graphic
Agenda
Title
Table
Framework
Industry
Technology & Software
Artificial Intelligence
Financial Services
Retail & E-commerce
Consumer Goods
Industrial & Manufacturing
Transportation & Logistics
Telecommunications
Real Estate & Construction
Hospitality & Tourism
Professional Services
Education & Training
Media & Entertainment
Agriculture & Food Production
Healthcare & Pharmaceuticals
Environmental Services & Sustainability
Government & Public Sector
Use Case
Mergers and Acquisitions
Performance Metrics and KPIs
Client Case Studies
Competitive Landscape
Corporate Finance and Valuation
Product and Service Analysis
Customer and Market Segmentation
Organizational Structure and Change
Industry Overview
Regulatory and Compliance
Risk Assessment and Management
Investment Analysis
Organizational Structure and Change
Human Resources and Talent Management
Financial Performance
Market Analysis and Trends
Sales and Business Development
Human Resources and Talent Management
Clear all
Thank you! Your submission has been received!
Oops! Something went wrong while submitting the form.
Tag
View slide
Layout showing a variety of financial service segments and their engagements with digital assets.
Technology and Digital Transformation
Financial Services
Explains the diversification of traditional financial services into digital assets, highlighting major players and their roles.
Digital Assets, Finance, Banks, Investment, Innovation
false
Technology and Digital Transformation
Financial Services financial-services
Table
McKinsey
View slide
A table and a graph showing digital asset engagement in various countries. Highlighting data points and percentages.
Market Analysis and Trends
Financial Services
Analyzes global engagement with digital assets, detailing percentages of adults involved in digital assets across multiple countries, with future engagement predictions. Useful for market analysis presentations.
Digital Assets, Global, Engagement, Market Analysis, Trends, Predictions, Countries
false
Market Analysis and Trends
Financial Services financial-services
Boxed
McKinsey
View slide
Slide includes a side-by-side comparison of digital platform statistics and a US map showing branch network distribution. It highlights the digital banking platform's features with screenshots and boasts impressive engagement metrics with clean iconography and a blue color scheme to complement the bank's branding.
Financial Performance
Financial Services
Describes the success of a digital banking platform, illustrating customer engagement metrics and branch distribution. It underscores the ease of doing business with the bank through its digital services and branch network, emphasizing customer satisfaction and accessibility.
Digital Banking, Customer Engagement, Branch Network, User Metrics, Accessibility, Customer Satisfaction
false
Financial Performance
Financial Services financial-services
Mixed Chart
JP Morgan
View slide
This slide is divided into two main sections, with the left side featuring a table with two columns for SMEs and Individuals, and the right side presenting a numbered list of key points about the Santander Global Platform. The table includes logos of affiliated services. There's a significant amount of text, and visual aids like arrows and numbers guide the reader through the content. The color scheme is a mix of red, blue, and white, with the Santander logo prominently placed at the top.
Market Analysis and Trends
Financial Services
The slide analyzes the Santander Global Platform's offerings for SMEs and individuals and outlines the strategy for digital banking solutions. It's appropriate for presentations discussing digital transformation, payment solutions, and market expansion strategies.
Digital Banking, Global Payments, SMEs, Individuals, Santander, Fintech, Open Platform, Banking Solutions, Financial Services
false
Market Analysis and Trends
Financial Services financial-services
Vertical Flow
Morgan Stanley
View slide
Two large blue panels with text and circular images depicting key areas of growth. Smaller images and bullet points elaborate on core strategies for enhancing digital capabilities.
Strategic Planning
Financial Services
Highlights strategic initiatives for business growth, focusing on digital enhancement and distribution optimization. These are aimed at maintaining a strong market position and driving future success.
Digital Capabilities, Partnerships, Growth
false
Strategic Planning
Financial Services financial-services
Table
Goldman Sachs
View slide
Features a pie chart and two column charts with annotations, presenting data on new consumers to internet economy services and their predicted behaviors post-COVID-19 in Singapore.
Market Analysis and Trends
Technology & Software
The slide discusses the significant uptake in digital services and the potential permanence of these changes, valuable for understanding consumer behavior in the digital space.
Digital Consumers, Growth, Singapore, Internet Economy
false
Market Analysis and Trends
Technology & Software technology-and-software
Multiple Chart
Bain
View slide
Consists of three pie charts showing the percentage of new Internet economy consumers, their retention post-COVID-19, and changes in online hours spent, respectively, set against a white background.
Market Analysis and Trends
Technology & Software
The slide shows the surge in Vietnam's digital consumer base during COVID-19, the retention rates of digital services post-pandemic, and the increase in average hours spent online.
Digital Consumers, Growth, Vietnam, COVID-19, Retention
false
Market Analysis and Trends
Technology & Software technology-and-software
Multiple Chart
Bain
View slide
This slide contains bar charts and graphical representation of reasons for digital service usage, with a clear and simple color scheme.
Market Analysis and Trends
Technology & Software
Investigates Vietnam's increase in digital consumers and their preferences for continued use of digital services.
Digital Consumers, Vietnam, Growth, Services, Preferences, Continuation, Analysis
false
Market Analysis and Trends
Technology & Software technology-and-software
Multiple Chart
Bain
View slide
Two graphs illustrating an increase in time spent online and e-commerce sales, juxtaposed to convey the correlation between digital consumption and retail trends.
Market Analysis and Trends
Retail & E-commerce
Analyzes the rise in digital media consumption and e-commerce growth due to the pandemic, highlighting shifts in consumer behavior and market opportunities.
Digital Consumption, E-commerce Growth, Pandemic Impact, Consumer Behavior, Retail Trends, Marketing Budgets, Digital Sales, ASEAN Market, Online Retail, Marketing Strategy
false
Market Analysis and Trends
Retail & E-commerce retail-and-e-commerce
Multiple Chart
BCG
View slide
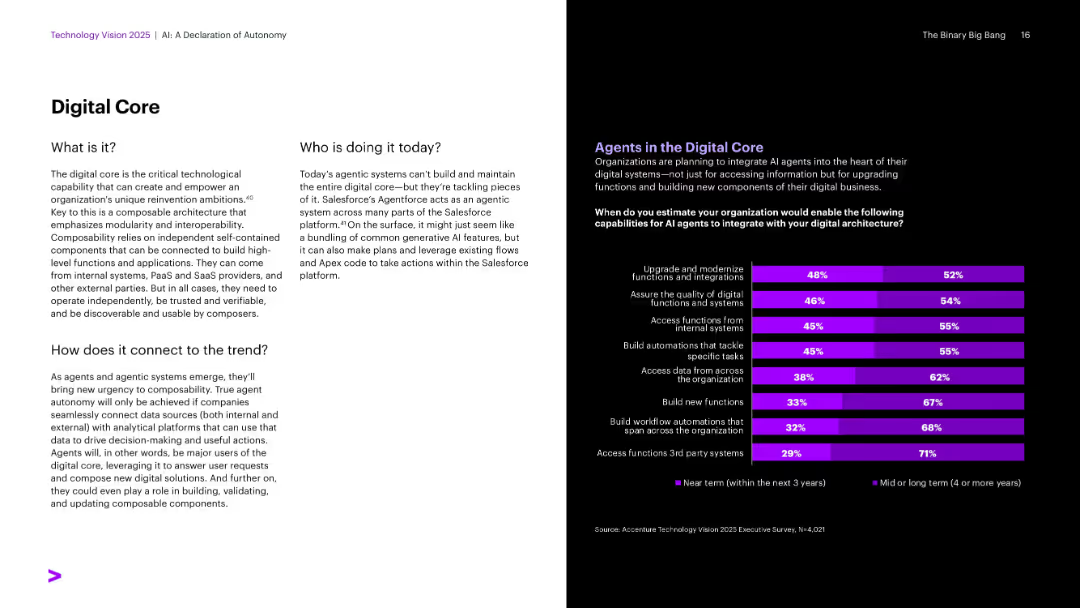
Split layout with white and black backgrounds. Bar chart on right with company survey results. Text on left defines digital core concept.
Technology and Digital Transformation
Artificial Intelligence
Defines the digital core and composability in the context of agentic systems. Survey results show planned enterprise integrations of AI agents into digital systems over the short and long term.
Digital Core, AI Integration, Composability, Enterprise Systems, Salesforce, Automation
false
Technology and Digital Transformation
Artificial Intelligence artificial-intelligence
Mixed Chart
Accenture
View slide
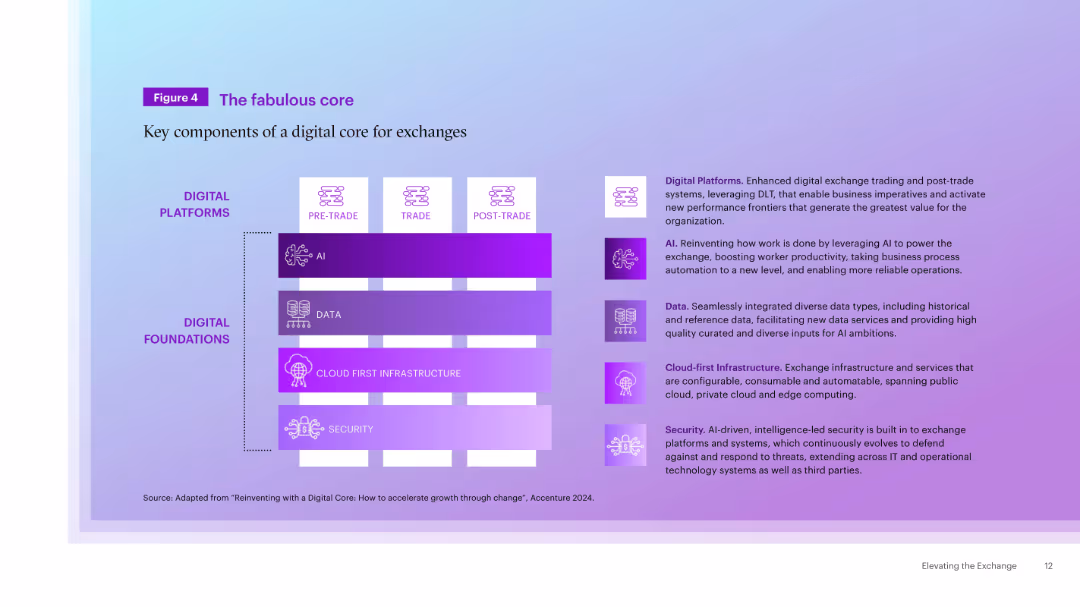
Two-column layout with diagram on left showing stacked elements (AI, Data, Cloud, Security) under Digital Platforms/Foundations, and descriptions on right.
Technology and Digital Transformation
Technology & Software
The slide outlines the core components of a digital core for exchanges, highlighting AI, data, cloud-first infrastructure, and security as foundational elements enabling robust digital platforms for trading and post-trade services.
Digital Core, AI, Data, Infrastructure, Security, Exchange, Technology, Platforms, Automation
false
Technology and Digital Transformation
Technology & Software technology-and-software
Table
Accenture
View slide
Depicts a disruption index graph comparing various industries by internet penetration levels, with personal luxury goods highlighted for 2018 and projected for 2025.
Technology and Digital Transformation
Retail & E-commerce
Discusses the impact of digital penetration on the luxury industry, comparing it to other sectors and forecasting a significant shift in industry dynamics by 2025 due to increased internet use and digital shopping behaviors.
Digital Disruption, Luxury Industry, Internet Penetration, Forecast
false
Technology and Digital Transformation
Retail & E-commerce retail-and-e-commerce
Single Chart
Bain
View slide
Two column charts comparing the prevalence of computer skills in developing and developed countries, showing the population with no computer skills and with standard computer skills.
Technology and Digital Transformation
Technology & Software
This slide highlights the digital divide caused by unequal technological advancements and diffusion. It compares the prevalence of computer skills in developing and developed countries, emphasizing the need for inclusive technology and equitable access to new innovations.
Digital Divide, Computer Skills, Technological Inequality
false
Technology and Digital Transformation
Technology & Software technology-and-software
Mixed Chart
Roland Berger
View slide
This slide features column charts showing growth in Malaysia's digital economy, with separate sections for e-commerce, online travel, transport and food, and online media. There's also a legend for growth metrics.
Market Analysis and Trends
Technology & Software
It presents the growth of Malaysia's digital economy by 2023 and e-commerce acceleration plans for 2025. It analyzes sector-specific growth and decline, highlighting the economic impact of online travel and e-commerce, crucial for stakeholders tracking market trends.
Digital Economy, E-commerce, Travel, Growth, Forecast, Malaysia, Column Chart
false
Market Analysis and Trends
Technology & Software technology-and-software
Multiple Chart
Bain
View slide
This slide presents column charts on Singapore's digital economy, segmented into e-commerce, travel, food, and online media. Key metrics are annotated, and the layout is similar to slide 1812 but with a different color theme.
Market Analysis and Trends
Technology & Software
The slide predicts Singapore's digital economy growth by 2025, with travel and e-commerce being significant sectors. It's suitable for stakeholders in the digital economy to understand market trajectories and plan for future investments.
Digital Economy, E-commerce, Travel, Growth, Forecast, Singapore, Column Chart
false
Market Analysis and Trends
Technology & Software technology-and-software
Multiple Chart
Bain
View slide
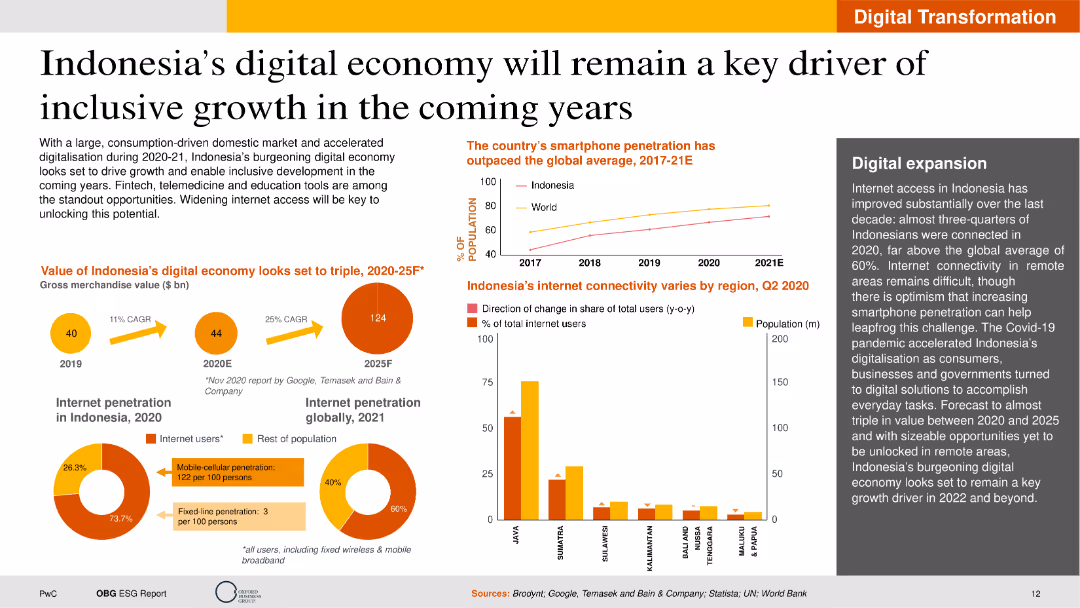
The slide contains text, a column chart showing smartphone penetration, pie charts on internet penetration, and a map. The layout is visually dense with multiple data points but remains well-structured for readability.
Market Analysis and Trends
Telecommunications
This slide highlights the growth of Indonesia's digital economy, emphasizing increased internet connectivity and smartphone usage. It discusses potential economic impacts and future opportunities in digital expansion.
Digital Economy, Indonesia, Growth, Internet, Smartphone
false
Market Analysis and Trends
Telecommunications telecommunications
Multiple Chart
PwC/Strategy&
View slide
The slide contrasts five leading sectors against four nascent sectors in the digital economy using icons and a two-column layout. It's clean and straightforward, with a focus on sector categorization.
Market Analysis and Trends
Technology & Software
The slide categorizes the sectors within the digital economy, distinguishing between established and emerging areas, thus providing a quick overview of the market coverage.
Digital Economy, Market Coverage, Leading Sectors, Nascent Sectors, Sector Categorization
false
Market Analysis and Trends
Technology & Software technology-and-software
Header Horizontal
Bain
View slide
This slide features a title at the top, three circles in increasing size representing data points for years 2021, 2025, and 2030 to the left, and a list of bulleted points to the right. The circles use a muted color palette and are labeled with monetary figures, denoting the SEA internet economy GMV. The slide background is white.
Market Analysis and Trends
Technology & Software
The slide predicts the growth of the SEA internet economy, reaching $1T GMV by 2030. It highlights the role of e-commerce, online grocery, and transport & food sectors in this growth. This slide could be used to illustrate potential areas for investment and development in the SEA region, focusing on the digital economy's expansive growth.
Digital Economy, SEA, GMV, Growth, E-commerce, Online Grocery, Transport & Food, 2030, Investment, Development
false
Market Analysis and Trends
Technology & Software technology-and-software
Single Chart
Bain
View slide
This slide serves as a section header or cover slide for a report on Southeast Asia's digital economy. It features a timeline from 2016 to 2030 with key milestones and a graphical representation of wind turbines.
Industry Overview
Financial Services
A summary of the digital economy's growth in Southeast Asia, tracking significant milestones over time and looking towards a sustainable digital economy by 2030.
Digital Economy, SEA, Google, Temasek, Bain, Research, Growth, Sustainability
false
Industry Overview
Financial Services financial-services
Linear Flow
Bain
View slide
Textual content and comparative data visualizations with maps. Shows the number of unicorns in Asia Pacific countries and outlines the initiatives of China, India, South Korea, and Japan to fulfill digital imperatives.
Industry Overview
Government & Public Sector
Compares the progress of prominent Asian countries in developing their digital ecosystems. Discusses initiatives and policies implemented to push for a flourishing digital economy, useful for understanding competitive positioning and the race to achieve key digital imperatives.
Digital Ecosystem, Unicorns, Asia Pacific, China, India, South Korea, Japan, Policy, Digital Economy, Competitiveness
false
Industry Overview
Government & Public Sector government-and-public-sector
Single Chart
Kearney
View slide
The slide is divided into two sections; on the left, there is textual content, and on the right, there are three vertical bar graphs in blue and turquoise shades. The graphs display predictions for the use of various digital financial services. The layout is clean and easy to navigate, with a distinct separation between text and graphical data.
Market Analysis and Trends
Financial Services
The slide forecasts the likely adoption of digital financial services focusing on digital supply chain financing and consumer financing options over the next 1 to 2 years. It provides statistical data that can be used by financial analysts and strategists to evaluate potential areas of growth and prepare for market shifts in digital financial service offerings.
Digital Finance, Supply Chain, Consumer Financing, Future, Trends, Merchants, Adoption, Predictions, Statistics, Analysis
false
Market Analysis and Trends
Financial Services financial-services
Single Chart
Bain
View slide
Depicts a multi-category column chart with various colors representing different segments of digital financial services. Noteworthy are the substantial deal values in H1 2021 which are clearly highlighted.
Market Analysis and Trends
Financial Services
Highlights the explosive growth in digital financial services, particularly in payments and investments, with H1 2021 deal values surpassing the full year of 2020. Fintech infrastructure is presented as a significant emerging theme.
Digital Financial Services, Growth, Fintech, SEA
false
Market Analysis and Trends
Financial Services financial-services
Mixed Chart
Bain
View slide
Contains several column charts representing different aspects of digital financial services like Digital Payment GTV, with clear labels and growth projections.
Market Analysis and Trends
Financial Services
Focuses on the growth trajectory of various digital financial services except for lending, with data on transaction values and predictions for the coming years.
Digital Financial Services, Growth, Projections, Lending
false
Market Analysis and Trends
Financial Services financial-services
Multiple Chart
Bain
View slide
The slide features the title of a report on digital growth in a bold, large font. The left side of the slide contains text while the right side displays a background image of two children looking at a screen. The design is minimal, focusing attention on the report's title and the image that hints at inclusivity and future-oriented perspectives.
Industry Overview
Technology & Software
The slide serves as the title for a report on digital growth in Indonesia, setting the stage for a detailed discussion on expanding digitalization efforts beyond metropolitan areas. The visual and textual elements combined aim to evoke curiosity and engage stakeholders in exploring the strategies for harnessing digital growth opportunities in the broader Indonesian context.
Digital Growth, Indonesia, Metropolitan Areas, Technology Inclusion, Education, Future Trends, Digitalization, Market Expansion, Strategic Development, Report Title
false
Industry Overview
Technology & Software technology-and-software
Title
Kearney
View slide
Incorporates a scatter plot and pie charts to show user growth rates and the intent to continue using digital fitness solutions post-pandemic.
Strategic Planning
Healthcare & Pharmaceuticals
Focuses on the sustained adoption and impact of digital fitness solutions during and after the pandemic, providing strategic insights into consumer engagement and market opportunities.
Digital Health, Fitness, COVID-19, Scatter Plot, Wellness, Market Strategy, User Growth, Pie Charts
false
Strategic Planning
Healthcare & Pharmaceuticals healthcare-and-pharmaceuticals
Single Chart
McKinsey
View slide
Contains line and column charts for digital acquisitions and engagement, a mobile app interface, and industry recognition logos. Colors are mainly blue and black.
Technology and Digital Transformation
Financial Services
Showcases digital innovations with statistics on increased acquisitions, adoption, and engagement, coupled with NPS improvements and industry awards.
Digital Innovation, Engagement, Mobile, Acquisitions, User Adoption, NPS, Awards
false
Technology and Digital Transformation
Financial Services financial-services
Multiple Chart
Citigroup
View slide
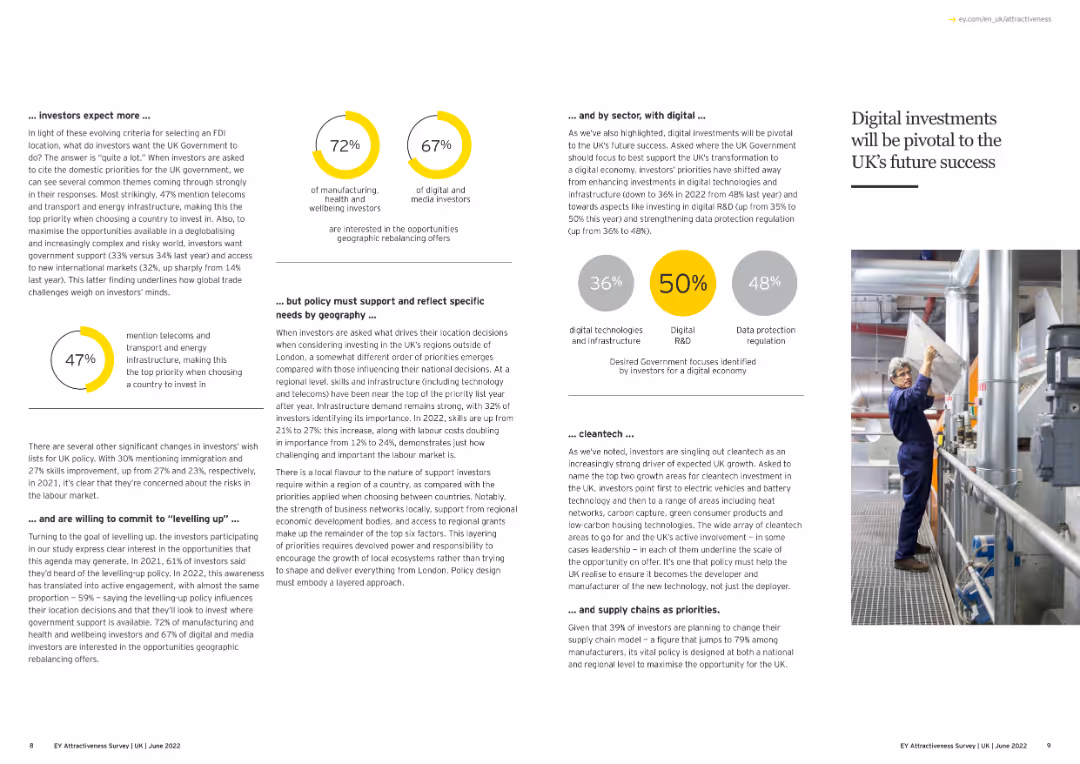
The slide features text and an image highlighting the importance of digital investments in the UK.
Technology and Digital Transformation
Technology & Software
This slide emphasizes the critical role of digital investments for the UK's future success, focusing on investor priorities, necessary policy support, and the importance of sectors like digital technologies, R&D, and data protection.
Digital Investment, UK, Future Growth, Technology
false
Technology and Digital Transformation
Technology & Software technology-and-software
Multiple Chart
EY
View slide
Contains a large column chart split between SMB and consumer lending, followed by in-depth textual analysis on the state of digital lending and associated risks.
Risk Assessment and Management
Financial Services
Explores the challenges faced by the digital lending sector, such as credit quality concerns and non-performing loans, while offering a glimpse into the government's mitigating actions and future growth.
Digital Lending, Credit Quality, NPLs, Future Growth
false
Risk Assessment and Management
Financial Services financial-services
Mixed Chart
Bain
View slide
Column chart showing average views on official accounts, image of smartphone usage
Market Analysis and Trends
Media & Entertainment
Discusses the effectiveness of brand accounts on WeChat for engaging consumers
Digital Marketing, Brand Engagement, WeChat, Views
false
Market Analysis and Trends
Media & Entertainment media-and-entertainment
Single Chart
BCG
View slide
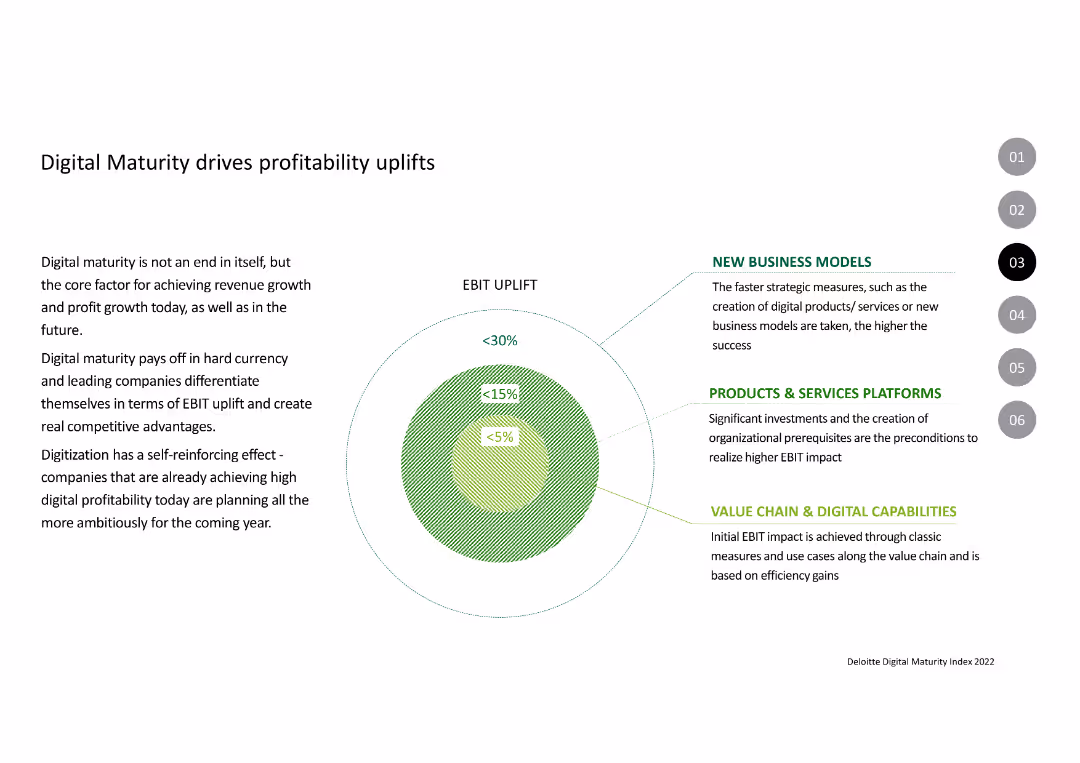
The slide features a concentric circle chart indicating levels of EBIT uplift (<5%, <15%, <30%) and accompanying text outlining factors like new business models, platforms, and digital capabilities.
Financial Performance
Financial Services
The slide explains the impact of digital maturity on profitability, highlighting strategic measures like new business models, platforms, and value chain capabilities.
Digital Maturity, Profitability, EBIT, Business Models, Platforms, Digital Capabilities
false
Financial Performance
Financial Services financial-services
Mixed Chart
Deloitte
Previous
Loading...
Hold On!
We are searching in our database
If nothing, comes up, please try different filters!
Column Chart
Heatmap
Chevron
Org Chart
Infographic
Callouts
Timeline
List
Graphic
Picture
Process Flow
Diagram
Paragraph
Map
Table
Framework
Subtitle
Takeaway Box
Icon
Other Chart
Radar Chart
Waterfall Chart
Mekko Chart
Pie Chart
Scatter Plot
Line Chart
Bar chart
Bullet points
Create a FREE account to continue browsing
Receive Instant Access to 1,000+ slides from companies like McKinsey, Google, and Goldman Sachs
First Name
Last Name
Email
Password
I agree to all
Terms & Privacy Policy
Thank you! Your submission has been received!
Oops! Something went wrong while submitting the form.
Have an account?
Sign in
Upgrade to PRO to Save slides
Advanced Search and Filters
Access to 15,000+ slides
Access to Category Pages
Save/Bookmark Slides
PowerPoint Template Library
Pick a Plan
MONTHLY
$12/month
Billed every month, Cancel anytime.
YEARLY
$9/year
Billed $108 annually, Cancel anytime.
Checkout for $12/month
Checkout for $108/yr
Secured by Stripe | AES-256 bit encryption