My Account
My Slides
Search by Category
Templates
View All Templates
Download Template Slides
Leave Feedback
Login
Logout
Get Started
Browse all Slides
Browse all Slides
Create a FREE Account
Instant access to 1,000+ real slides from top companies like McKinsey, BCG, Goldman Sachs, Google and many more!
First Name
Last Name
Email
Password
I agree to all
Terms & Privacy Policy
Thank you! Your submission has been received!
Oops! Something went wrong while submitting the form.
Have an account?
Sign in
Spark Your Next Big Idea with New Presentation Templates
VIEW ALL Templates
Welcome,
Welcome
PRO
Show Featured Only
Checkbox 8
Companies
Mckinsey
Bain
BCG
EY
Deloitte
Accenture
PwC/Strategy&
JP Morgan
Goldman Sachs
Morgan Stanley
Citigroup
Deutsche Bank
Barclays
LEK
KPMG
Kearney
Oliver Wyman
Booz Allen Hamilton
Gartner
IPSOS
Nielsen
Slide type
Text Only
Linear Flow
Vertical Flow
Single Chart
Header Horizontal
Mixed Chart
Header Vertical
Pillar
Multiple Chart
Graphic
Agenda
Title
Table
Framework
Industry
Technology & Software
Artificial Intelligence
Financial Services
Retail & E-commerce
Consumer Goods
Industrial & Manufacturing
Transportation & Logistics
Telecommunications
Real Estate & Construction
Hospitality & Tourism
Professional Services
Education & Training
Media & Entertainment
Agriculture & Food Production
Healthcare & Pharmaceuticals
Environmental Services & Sustainability
Government & Public Sector
Use Case
Mergers and Acquisitions
Performance Metrics and KPIs
Client Case Studies
Competitive Landscape
Corporate Finance and Valuation
Product and Service Analysis
Customer and Market Segmentation
Organizational Structure and Change
Industry Overview
Regulatory and Compliance
Risk Assessment and Management
Investment Analysis
Organizational Structure and Change
Human Resources and Talent Management
Financial Performance
Market Analysis and Trends
Sales and Business Development
Human Resources and Talent Management
Clear all
Thank you! Your submission has been received!
Oops! Something went wrong while submitting the form.
Tag
View slide
A structured layout with four numbered sections, each comprising bold headings and subtext. The sections are neatly arranged and use contrasting colors for readability. No charts or images are present.
Market Analysis and Trends
Technology & Software
Provides a glimpse into the future of digital commerce, detailing the norms of digital merchants. This slide is informative for discussions on the evolution of e-commerce and business strategies.
Digital Merchant, 2030, SEA, Online, Digital Payment, BNPL, Digital Tools, Operational Efficiency
false
Market Analysis and Trends
Technology & Software technology-and-software
Linear Flow
Bain
View slide
Featuring four sets of column charts, this slide shows the projected growth in Singapore's digital offerings in payments, lending, insurance, and wealth management. It uses shades of blue with annotations for metrics.
Strategic Planning
Financial Services
This slide focuses on the growth potential of Singapore's traditional financial institutions in digital offerings. It's particularly useful for financial strategists and investors analyzing growth opportunities in the digital finance landscape.
Digital Offerings, Financial Services, Growth, Singapore, Strategic Planning
false
Strategic Planning
Financial Services financial-services
Multiple Chart
Bain
View slide
The slide features two large pie charts showing the percentage increase in digital and mobile customers, and a line chart comparing consumer loans sold digitally in different regions. There's also a check-list on the left highlighting key digital strategies.
Operational Efficiency
Financial Services
This slide emphasizes the impact of digital strategies on sales and product launches, showing significant customer growth and the increase of digital loan transactions. Suitable for demonstrating the results of digital transformation in banking.
Digital Onboarding, Digital Sales, Consumer Loans, Growth, Digital Transformation, BBVA Wallet, Mobile Customers
false
Operational Efficiency
Financial Services financial-services
Multiple Chart
Morgan Stanley
View slide
This slide features two column charts showing yearly comparisons, and text boxes with bullet points highlight key statistics. There is a balance of graphics and explanatory text.
Operational Efficiency
Financial Services
Illustrates growth in digital and debit transactions compared to cash and checks, emphasizing the increased use of digital banking capabilities by customers.
Digital Payments, Banking, Customer Engagement, Transaction Trends, Growth
false
Operational Efficiency
Financial Services financial-services
Multiple Chart
JP Morgan
View slide
The slide features two graphs and a quote. The first graph showcases the growth of digital payments in tier 2 and tier 3 markets, and the second depicts the expected market size.
Market Analysis and Trends
Financial Services
This slide provides a graphical representation of the growth trajectory in digital payments and market size projections. It includes customer commentary on the ease of use, suggesting a shift towards mainstream digital payment acceptance. It's used for analyzing trends in cashless payment adoption and regulatory impact.
Digital Payments, Market Size, Growth, Cashless, Consumer Experience, Regulation
false
Market Analysis and Trends
Financial Services financial-services
Mixed Chart
Kearney
View slide
The slide features a header image of a person using a contactless payment system, with two columns of text and small images below the text.
Technology and Digital Transformation
Retail & E-commerce
Discusses the rise of digital payments, highlighting mobile payments, crypto, smartwatches, and the impact on retailers.
Digital Payments, Mobile, Crypto, Smartwatches, Retail, AmazonGo, Convenience, Online Stores, Payment Methods, Checkout
false
Technology and Digital Transformation
Retail & E-commerce retail-and-e-commerce
Multiple Chart
Deloitte
View slide
Features column charts depicting the Gross Transaction Value of different payment methods, contrasting them with a sub-section of related narrative insights.
Market Analysis and Trends
Financial Services
Analyzes the persistence of digital payments, showing transaction value distribution among various payment methods and predicting the decline of cash in favor of e-wallets.
Digital Payments, Transaction Value, Payment Methods, Trend
false
Market Analysis and Trends
Financial Services financial-services
Mixed Chart
Bain
View slide
Has stacked column charts detailing the share of Gross Transaction Value (GTV) by payment methods, showing trends over time.
Market Analysis and Trends
Financial Services
Analyzes the shift in payment method preferences, emphasizing the growth of digital payments and the decline of cash usage. It is relevant for payment processors and fintech companies looking to understand consumer behavior trends and capitalize on digital payment solutions.
Digital Payments, Trends, GTV
false
Market Analysis and Trends
Financial Services financial-services
Mixed Chart
Bain
View slide
Presents a column chart showing the increase in app downloads for digital remittance services, paired with descriptive text detailing the significance and future expectations.
Market Analysis and Trends
Financial Services
Highlights the uptick in digital remittance users, underpinned by the rise in app downloads and regulatory support, and predicts the long-term impact up to 2025.
Digital Remittance, User Growth, Apps, Predictions
false
Market Analysis and Trends
Financial Services financial-services
Mixed Chart
Bain
View slide
Contains multiple column charts for different digital financial service sectors, highlighting growth rates and future projections.
Market Analysis and Trends
Financial Services
Offers an overview of the flourishing digital financial services sector, with a special focus on the exponential growth in digital lending. It serves as a vital tool for financial service providers and investors to understand market trends and identify investment opportunities.
Digital Services, Lending, Growth
false
Market Analysis and Trends
Financial Services financial-services
Multiple Chart
Bain
View slide
The slide is densely packed with text and includes a digital skill matrix, career pathways, and job description with skills required. Each section is color-coded and contains bullet points. It is visually complex, incorporating various text blocks and a flow diagram that outlines career progression. The overall layout is systematic but crowded.
Operational Efficiency
Technology & Software
This slide maps the digital skill and career roadmap for Singapore, depicting key areas such as Data & AI, Infrastructure, Software, and Strategy & Governance. It offers an in-depth view into the specific job roles, required skills, and potential career pathways within the ICT sector, serving as a guide for workforce upskilling strategies and educational planning.
Digital Skills, Career Roadmap, Singapore, ICT, Job Descriptions, Skills Matrix, Data & AI, Software Engineering, Strategy & Governance, Upskilling
false
Operational Efficiency
Technology & Software technology-and-software
Header Horizontal
Kearney
View slide
Minimalist title slide with large, bold text and a colorful background. Includes the logos of BCG and Google.
Market Analysis and Trends
Retail & E-commerce
This title slide indicates a report or presentation on digital consumer spending in India, signaling a significant market opportunity.
Digital Spending, India, Market Opportunity, Consumer Behavior, E-commerce, Technology, Investment, Trend Analysis
false
Market Analysis and Trends
Retail & E-commerce retail-and-e-commerce
Title
BCG
View slide
This slide features a simple color-coded design to showcase digital imperative achievements by different countries. Each country is represented with a flag, followed by bullet points outlining key initiatives and progress in digital infrastructure, talent, and other areas. There are no complex graphics, just organized, concise text descriptions.
Industry Overview
Technology & Software
It outlines key digital strategy achievements of various countries, like Thailand's network strategy and Estonia's e-governance. Each section lists specific initiatives, reflecting on how these countries are advancing their digital infrastructures and capabilities, investing in talent, and integrating ICT into education systems to keep pace with global technological imperatives.
Digital Strategy, Global, Thailand, Australia, Estonia, Malaysia, Singapore, South Korea, ICT, Education, Infrastructure, Talent
false
Industry Overview
Technology & Software technology-and-software
Header Vertical
Kearney
View slide
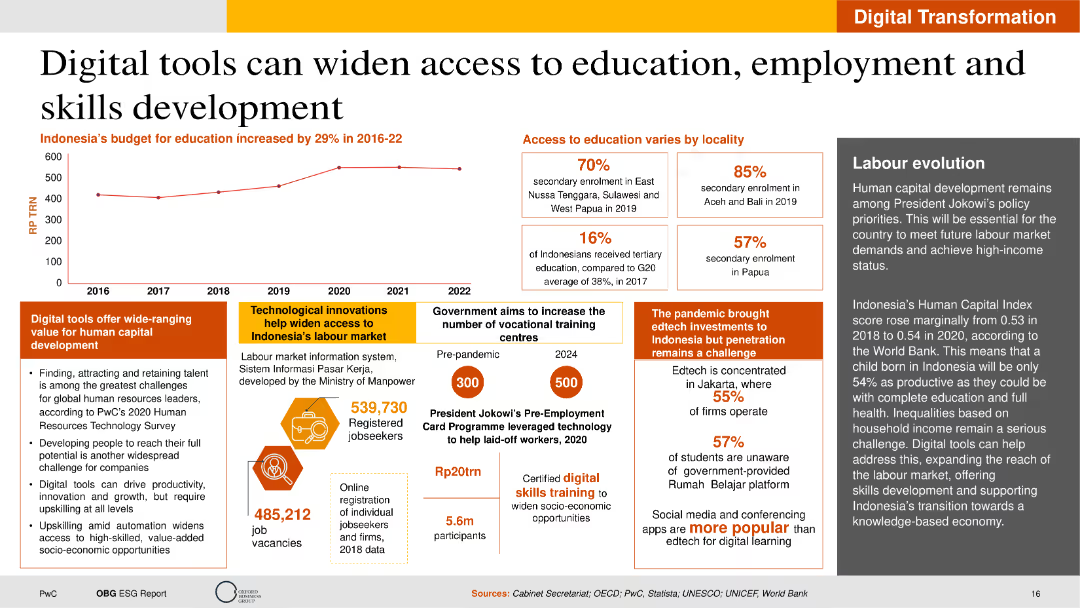
The slide includes text on digital tools, a line chart of education budget, and statistics on education access. The layout is structured to highlight key points with clear sections and supportive visual elements.
Technology and Digital Transformation
Education & Training
This slide highlights how digital tools can improve access to education and employment in Indonesia. It discusses technological innovations, government initiatives, and the impact of digital learning on human capital development.
Digital Tools, Education, Employment, Indonesia, Innovation
false
Technology and Digital Transformation
Education & Training education-and-training
Mixed Chart
PwC/Strategy&
View slide
Dominated by two sets of bar graphs, one for front-end and the other for back-end digital tools, the slide visually contrasts the anticipated increases in usage. It is color-coded in blue and beige, with a white background that aids readability.
Technology and Digital Transformation
Financial Services
This slide indicates the expected growth in the use of digital tools among merchants, focusing on marketing, website services, analytics, and various operational software. The information is crucial for those involved in technology strategy and digital transformation efforts within the financial services industry, highlighting the shift towards more technologically integrated operations.
Digital Tools, Merchants, Transformation, Marketing, Analytics, Operation Software, Growth, Technology Strategy, Financial Services, Integration
false
Technology and Digital Transformation
Financial Services financial-services
Mixed Chart
Bain
View slide
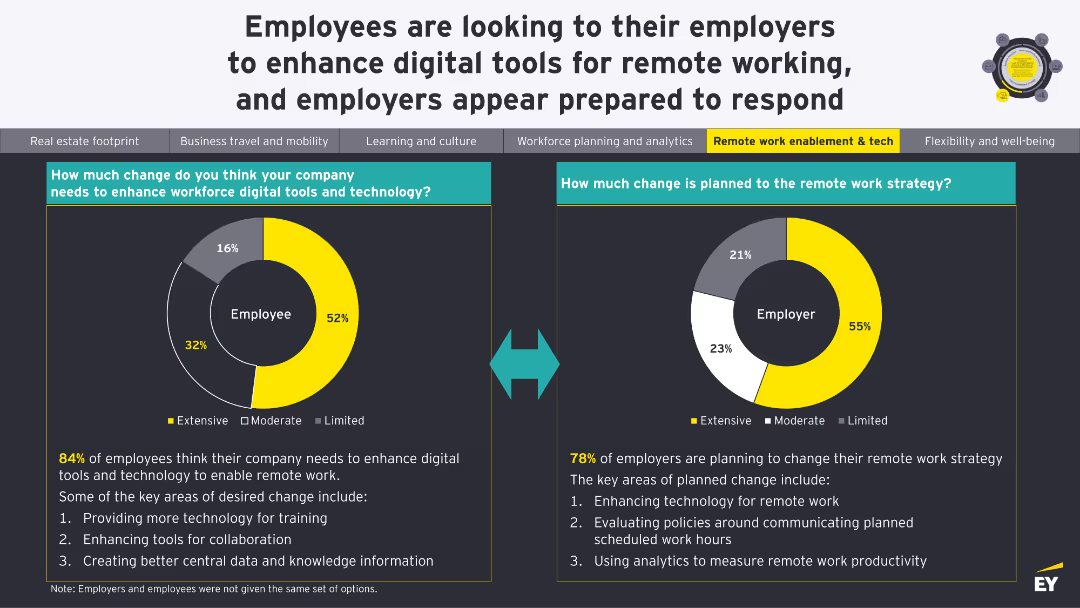
Two donut charts showing the extent of change needed in workforce digital tools and planned changes to remote work strategy.
Technology and Digital Transformation
Technology & Software
The slide compares the perceived need for digital tools among employees with the changes employers are planning for remote work strategies, highlighting key areas for enhancement.
Digital Tools, Remote Work, Change Management, Strategy, Technology
false
Technology and Digital Transformation
Technology & Software technology-and-software
Multiple Chart
EY
View slide
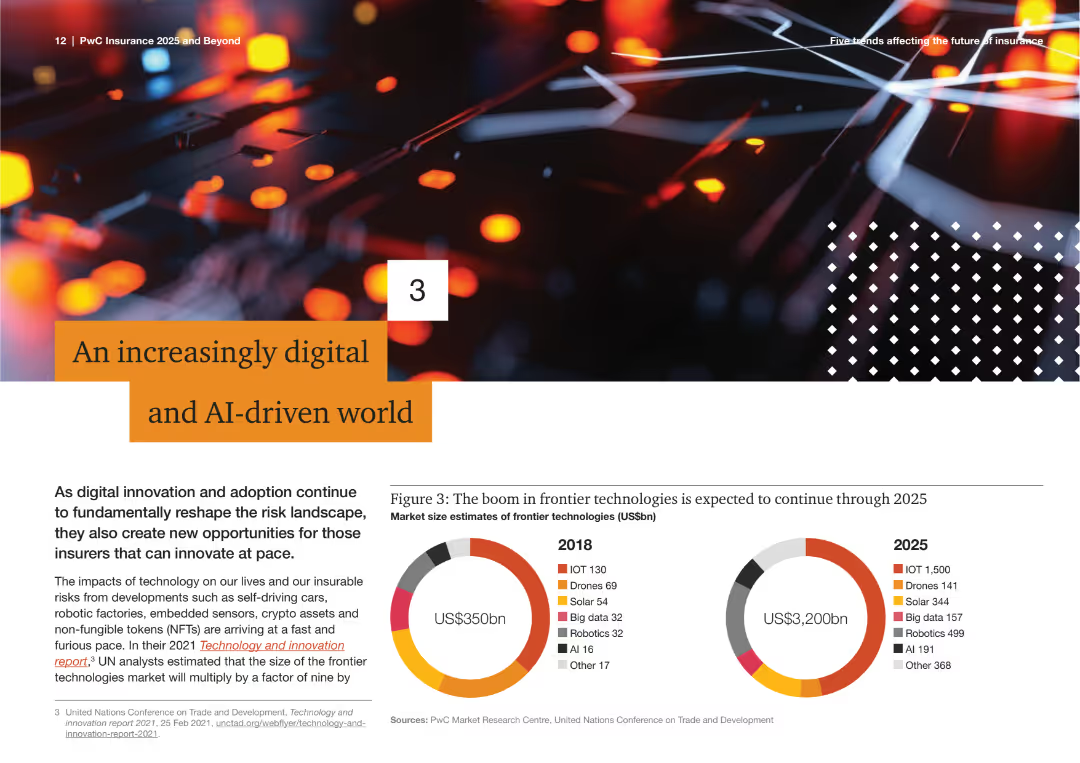
The slide shows a visually appealing graphic with a pie chart comparing market size estimates for frontier technologies in 2018 and 2025, including IoT, drones, solar, big data, robotics, AI, and other technologies.
Technology and Digital Transformation
Technology & Software
This slide discusses the rapid growth of digital and AI technologies, highlighting market size estimates for various frontier technologies from 2018 to 2025. It emphasizes the transformative impact of these technologies on the industry.
Digital Transformation, AI, Technology Growth, Market Size, Frontier Technologies, IoT, Drones, Robotics, Big Data, Solar
false
Technology and Digital Transformation
Technology & Software technology-and-software
Multiple Chart
PwC/Strategy&
View slide
Diagram showing a client-centric ecosystem, with circular flow and percentage growth indicators, executed in shades of blue and green.
Technology and Digital Transformation
Financial Services
Details the strategic move towards a digital network with a light physical footprint and increased digital capabilities, highlighting growth in ATMs and mobile users.
Digital Transformation, Client-Centric, Network, ATMs, Mobile Banking, Financial Advisors
false
Technology and Digital Transformation
Financial Services financial-services
Linear Flow
Citigroup
View slide
Features comparative bar graphs with annotations, indicating growth over time, using contrasting colors for clarity.
Market Analysis and Trends
Retail & E-commerce
Highlights the rapid growth of internet and smartphone users in India, suggesting a digitally transforming market. Important for digital strategy discussions.
Digital Transformation, India, Internet Users, Smartphone Adoption, Growth Analysis, Market Development, Technology Trends
true
Market Analysis and Trends
Retail & E-commerce retail-and-e-commerce
Multiple Chart
BCG
View slide
Slide divided into two halves; left side has text boxes with bullet points, right side has a timeline from 2015 to 2018 with key initiatives marked along it, indicating progress.
Strategic Planning
Financial Services
Details supplier onboarding time reduction efforts, highlighting digital transformation milestones and future focus areas. Useful for presenting historical achievements and forward-looking strategies in process optimization.
Digital Transformation, Onboarding, Efficiency, Timeline, Process Improvement, Strategy, Milestones, Future Focus, Legal, RPA
false
Strategic Planning
Financial Services financial-services
Text Only
Citigroup
View slide
The slide presents quantitative data via column charts and includes a photo of a branch and digital devices. Charts show trends over time with annotations for significant changes.
Technology and Digital Transformation
Financial Services
Depicts the bank's shift towards digital operations, emphasizing the reduction in physical branches and growth in digital transaction volumes, highlighting technological adoption in banking.
Digital Transition, Branches, Transactions
false
Technology and Digital Transformation
Financial Services financial-services
Multiple Chart
Goldman Sachs
View slide
Gartner Hype Cycle diagram for the digital workplace in 2020, showing different stages from innovation trigger to plateau of productivity.
Technology and Digital Transformation
Technology & Software
The slide presents the Gartner Hype Cycle for the digital workplace, illustrating the impact of the pandemic on accelerating digitalization. It highlights the various stages of workplace technologies and the future expectations for innovations that could enhance productivity and collaboration.
Digital Workplace, Pandemic, Hype Cycle
false
Technology and Digital Transformation
Technology & Software technology-and-software
Mixed Chart
Roland Berger
View slide
The slide includes a bar chart comparing the percentage of respondents expressing various concerns about digital health adoption in 2021 versus 2022, such as patient privacy and solution incompatibility.
Risk Assessment and Management
Healthcare & Pharmaceuticals
The slide addresses the growing concerns regarding digital health adoption, highlighting issues like increased concerns about patient privacy, incompatibility between digital solutions, and the shortage of talent for developing and implementing these solutions.
Digital adoption, concerns, patient privacy, compatibility
false
Risk Assessment and Management
Healthcare & Pharmaceuticals healthcare-and-pharmaceuticals
Single Chart
LEK
View slide
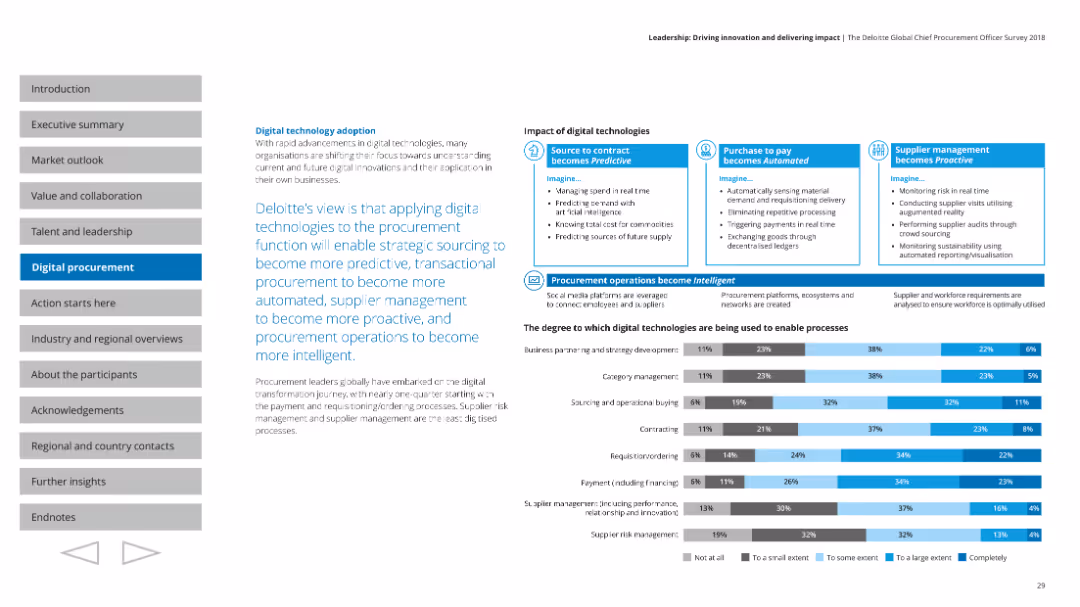
Contains a combination of charts and descriptive text blocks, highlighting the impact of digital technologies on procurement processes and strategies.
Technology and Digital Transformation
Professional Services
Describes the role of digital technologies in transforming procurement functions, making them more predictive, automated, and proactive.
Digital adoption, procurement, strategy, technology impact
false
Technology and Digital Transformation
Professional Services professional-services
Mixed Chart
Deloitte
View slide
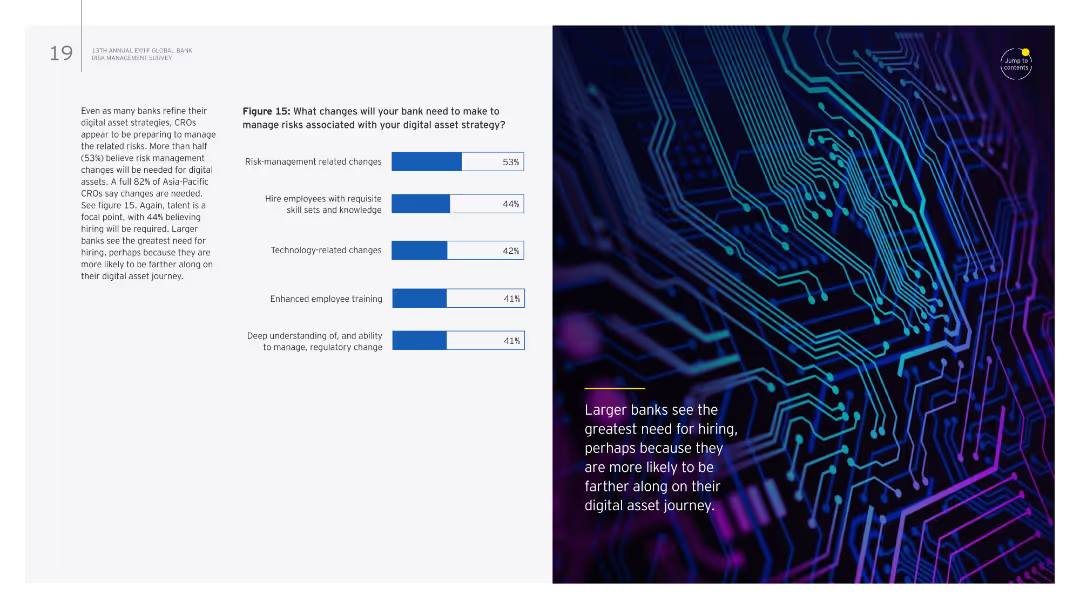
The slide combines text with a column chart on the right. The chart lists changes needed in banks to manage risks associated with digital asset strategies.
Risk Assessment and Management
Financial Services
It details necessary changes for banks to manage digital asset strategy risks, focusing on risk management, hiring, technology, training, and regulatory understanding.
Digital assets, risk management, hiring, technology, training
false
Risk Assessment and Management
Financial Services financial-services
Mixed Chart
EY
View slide
The slide features text and two column charts. The charts outline elements of digital asset strategy pursued by banks and methods for informing the strategy.
Technology and Digital Transformation
Financial Services
It discusses the development of digital asset strategies by banks, including key elements and methods for effectively implementing and managing digital assets.
Digital assets, strategy, development, banks, management
false
Technology and Digital Transformation
Financial Services financial-services
Multiple Chart
EY
View slide
Features column charts and informational text blocks discussing international banking revenue and digital banking.
Market Analysis and Trends
Financial Services
The slide outlines JPMorgan's strategy and positioning for growth in digital banking outside the U.S., with projections and comparative analysis.
Digital banking, market growth, international, revenue, cost analysis, traditional banking, digital challengers
false
Market Analysis and Trends
Financial Services financial-services
Multiple Chart
JP Morgan
View slide
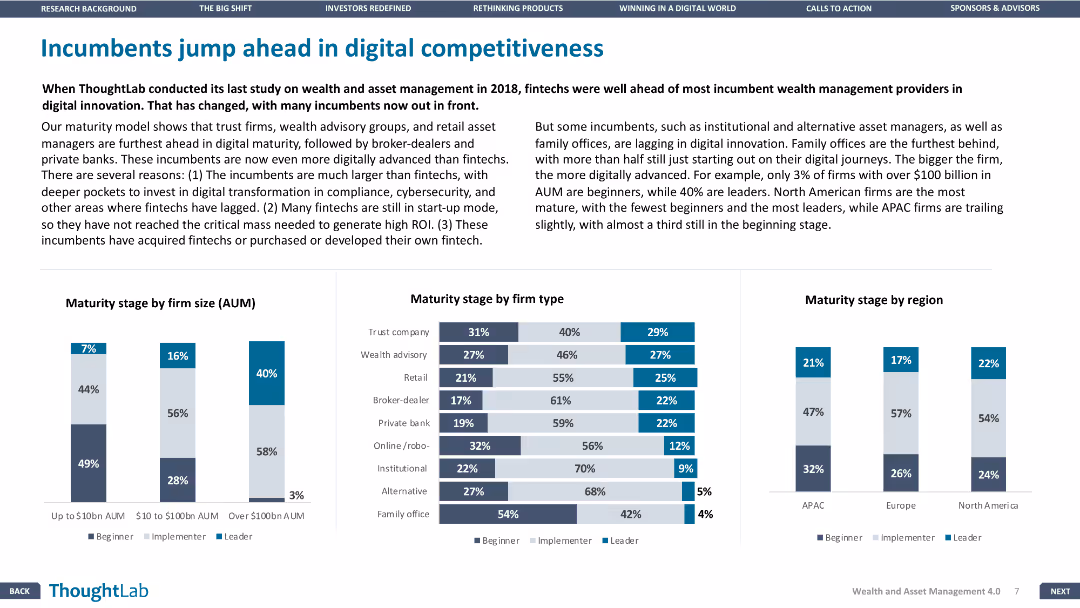
This slide features three column charts comparing maturity stages by firm size, type, and region. Text on the left provides context.
Competitive Landscape
Financial Services
The slide compares the digital maturity of various financial institutions, highlighting the differences in competitiveness by firm size, type, and region.
Digital competitiveness, Financial Services, Maturity, Firm size, Region
false
Competitive Landscape
Financial Services financial-services
Multiple Chart
Deloitte
View slide
A text-focused slide that includes icons representing various product categories to show changes in consumer purchasing trends over time, particularly noting an increase in online grocery shopping.
Operational Efficiency
Retail & E-commerce
Details the evolution of first-time digital consumer purchasing patterns, with a recent uptick in online grocery shopping, reflecting the impact of digital transformation and changing consumer preferences.
Digital consumer, shopping trends, online groceries, Southeast Asia, consumer behavior
false
Operational Efficiency
Retail & E-commerce retail-and-e-commerce
Header Horizontal
Bain
View slide
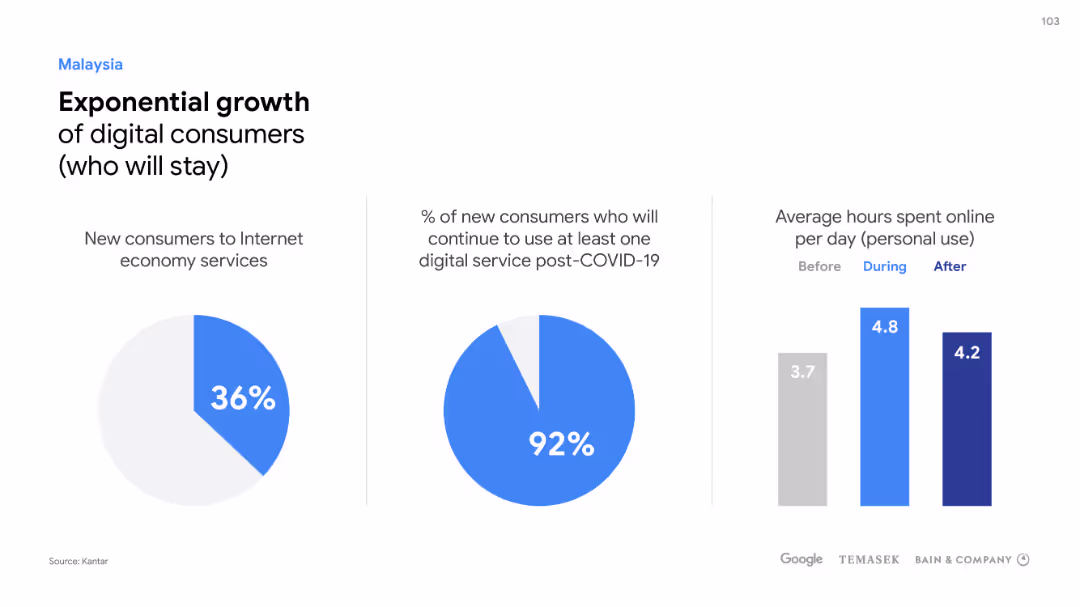
Two pie charts and a column chart detail Malaysia's digital consumer growth, continuity post-COVID-19, and online activity.
Market Analysis and Trends
Technology & Software
Demonstrates Malaysia's digital consumer surge and the ongoing engagement in internet economy services post-pandemic.
Digital consumers, Malaysia, Growth, Internet economy, COVID-19, Online activity, Engagement
false
Market Analysis and Trends
Technology & Software technology-and-software
Multiple Chart
Bain
Previous
Loading...
Hold On!
We are searching in our database
If nothing, comes up, please try different filters!
Column Chart
Heatmap
Chevron
Org Chart
Infographic
Callouts
Timeline
List
Graphic
Picture
Process Flow
Diagram
Paragraph
Map
Table
Framework
Subtitle
Takeaway Box
Icon
Other Chart
Radar Chart
Waterfall Chart
Mekko Chart
Pie Chart
Scatter Plot
Line Chart
Bar chart
Bullet points
Create a FREE account to continue browsing
Receive Instant Access to 1,000+ slides from companies like McKinsey, Google, and Goldman Sachs
First Name
Last Name
Email
Password
I agree to all
Terms & Privacy Policy
Thank you! Your submission has been received!
Oops! Something went wrong while submitting the form.
Have an account?
Sign in
Upgrade to PRO to Save slides
Advanced Search and Filters
Access to 15,000+ slides
Access to Category Pages
Save/Bookmark Slides
PowerPoint Template Library
Pick a Plan
MONTHLY
$12/month
Billed every month, Cancel anytime.
YEARLY
$9/year
Billed $108 annually, Cancel anytime.
Checkout for $12/month
Checkout for $108/yr
Secured by Stripe | AES-256 bit encryption