My Account
My Slides
Search by Category
Templates
View All Templates
Download Template Slides
Leave Feedback
Login
Logout
Get Started
Browse all Slides
Browse all Slides
Create a FREE Account
Instant access to 1,000+ real slides from top companies like McKinsey, BCG, Goldman Sachs, Google and many more!
First Name
Last Name
Email
Password
I agree to all
Terms & Privacy Policy
Thank you! Your submission has been received!
Oops! Something went wrong while submitting the form.
Have an account?
Sign in
Spark Your Next Big Idea with New Presentation Templates
VIEW ALL Templates
Welcome,
Welcome
PRO
Show Featured Only
Checkbox 8
Companies
Mckinsey
Bain
BCG
EY
Deloitte
Accenture
PwC/Strategy&
JP Morgan
Goldman Sachs
Morgan Stanley
Citigroup
Deutsche Bank
Barclays
LEK
KPMG
Kearney
Oliver Wyman
Booz Allen Hamilton
Gartner
IPSOS
Nielsen
Slide type
Text Only
Linear Flow
Vertical Flow
Single Chart
Header Horizontal
Mixed Chart
Header Vertical
Pillar
Multiple Chart
Graphic
Agenda
Title
Table
Framework
Industry
Technology & Software
Artificial Intelligence
Financial Services
Retail & E-commerce
Consumer Goods
Industrial & Manufacturing
Transportation & Logistics
Telecommunications
Real Estate & Construction
Hospitality & Tourism
Professional Services
Education & Training
Media & Entertainment
Agriculture & Food Production
Healthcare & Pharmaceuticals
Environmental Services & Sustainability
Government & Public Sector
Use Case
Mergers and Acquisitions
Performance Metrics and KPIs
Client Case Studies
Competitive Landscape
Corporate Finance and Valuation
Product and Service Analysis
Customer and Market Segmentation
Organizational Structure and Change
Industry Overview
Regulatory and Compliance
Risk Assessment and Management
Investment Analysis
Organizational Structure and Change
Human Resources and Talent Management
Financial Performance
Market Analysis and Trends
Sales and Business Development
Human Resources and Talent Management
Clear all
Thank you! Your submission has been received!
Oops! Something went wrong while submitting the form.
Tag
View slide
This slide contains bar charts and graphical representations of consumer growth data, juxtaposed with textual information to provide context.
Market Analysis and Trends
Technology & Software
Assesses the expansion of digital consumer bases in Singapore and their commitment to digital services, particularly e-commerce, reflecting consumer habits and preferences.
Digital consumers, Market expansion, E-commerce, Consumer commitment
false
Market Analysis and Trends
Technology & Software technology-and-software
Multiple Chart
Bain
View slide
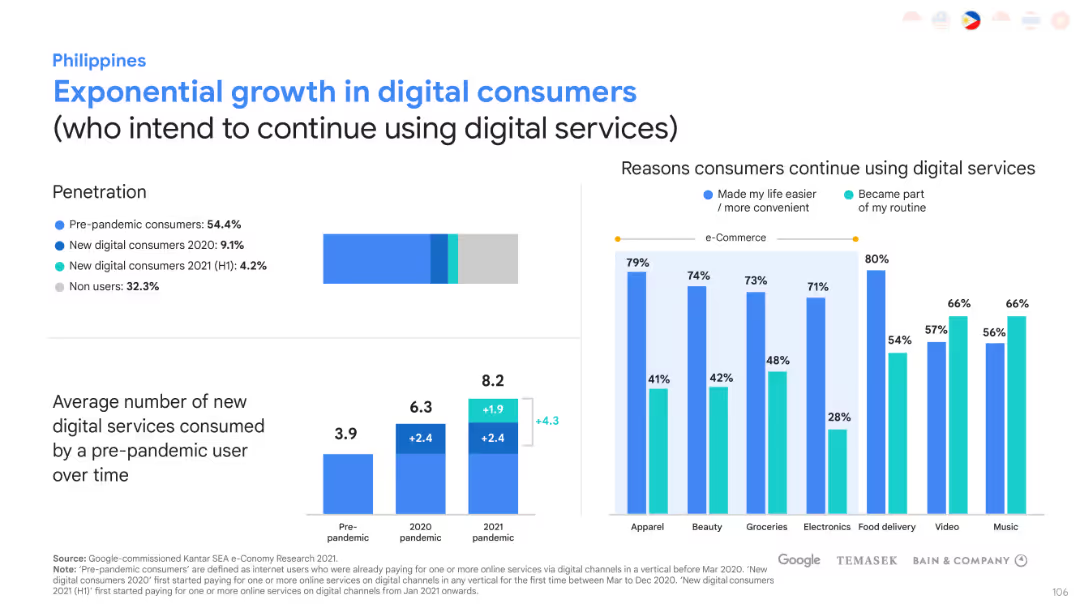
This slide has bar charts and graphs to represent the growth of digital consumers. The layout is balanced with textual information on one side and graphical data on the other.
Market Analysis and Trends
Technology & Software
Analyzes the digital consumer penetration and growth in the Philippines. It also explores the reasons consumers prefer to continue using digital services, highlighting e-commerce adoption.
Digital consumers, Market penetration, E-commerce, Consumer preferences
false
Market Analysis and Trends
Technology & Software technology-and-software
Multiple Chart
Bain
View slide
The slide features two pie charts and a column chart showing the growth of digital consumers in the Philippines.
Market Analysis and Trends
Technology & Software
Captures the Philippines' notable increase in digital consumers who are likely to continue using internet services post-COVID-19.
Digital consumers, Philippines, Growth, Internet services, COVID-19, Usage trends, Continuity
false
Market Analysis and Trends
Technology & Software technology-and-software
Multiple Chart
Bain
View slide
A slide with textual content on the left and two pie charts on the right showing demographics of digital consumers in terms of country, tier, age, and gender.
Market Analysis and Trends
Retail & E-commerce
Presents the demographic breakdown of a survey of over 16,000 digital consumers in Southeast Asia, giving insights into the regional digital consumer landscape.
Digital consumers, Southeast Asia, demographics, survey, pie chart
false
Market Analysis and Trends
Retail & E-commerce retail-and-e-commerce
Multiple Chart
Bain
View slide
The slide includes a pie chart and text highlighting the significance of short and medium-length videos in digital consumption habits.
Customer and Market Segmentation
Retail & E-commerce
Explains the integral role of short and medium videos in digital consumption, providing statistics on the average number of videos viewed each day by consumers, underscoring the importance for marketing strategies.
Digital consumption, videos, consumer habits, Southeast Asia, statistics
false
Customer and Market Segmentation
Retail & E-commerce retail-and-e-commerce
Single Chart
Bain
View slide
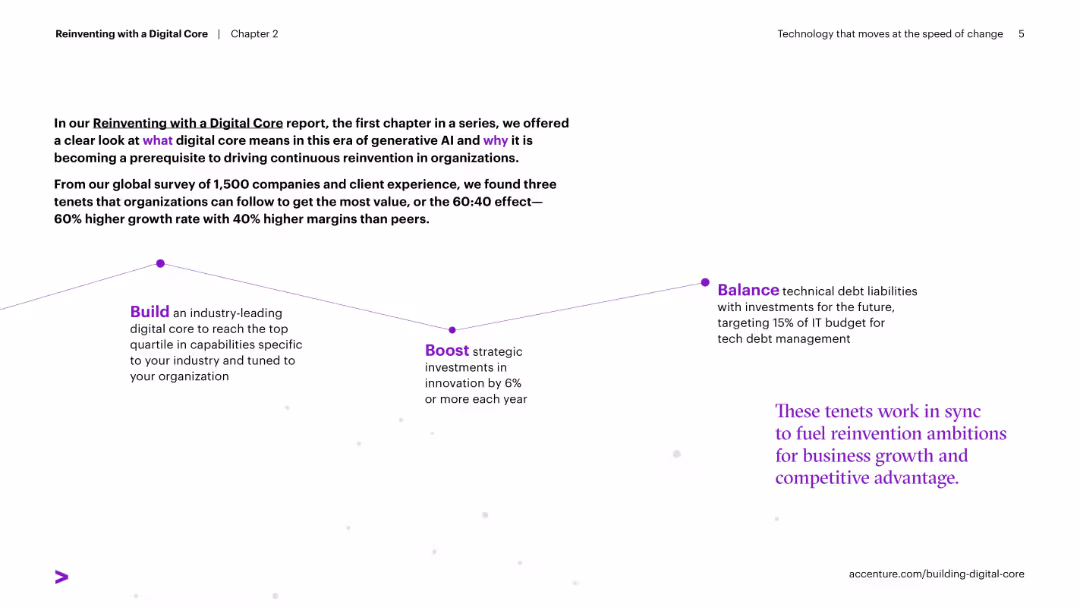
Clean white background with large minimal text and three central visual anchor points connected by lines.
Strategic Planning
Technology & Software
This slide outlines three core principles for digital transformation based on a global survey: Build a strong digital core, Boost innovation investment, and Balance tech debt. It emphasizes the importance of aligning digital efforts for competitive advantage in the era of AI-driven change.
Digital core, IT strategy, tech debt, innovation, business transformation
false
Strategic Planning
Technology & Software technology-and-software
Linear Flow
Accenture
View slide
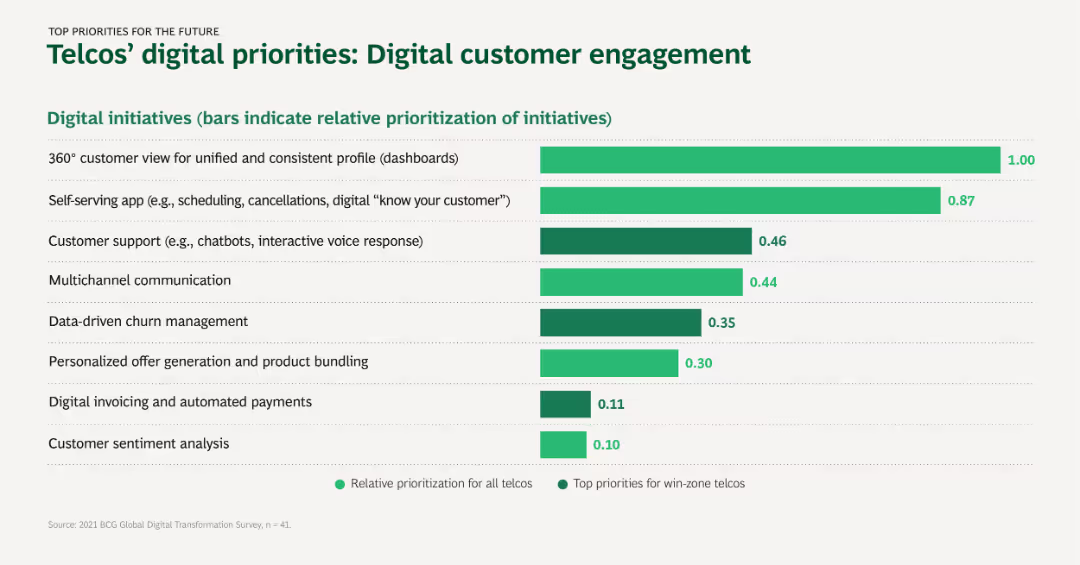
The slide features a bar chart ranking digital initiatives by their prioritization among telcos, with a focus on 360° customer view and self-serving apps.
Customer and Market Segmentation
Telecommunications
This slide highlights the top digital initiatives prioritized by telcos for enhancing customer engagement, emphasizing the importance of a unified customer view and interactive customer support tools.
Digital customer engagement, Telcos, Prioritization, 360° customer view, Self-serving apps
false
Customer and Market Segmentation
Telecommunications telecommunications
Single Chart
BCG
View slide
Clean design showcasing seven icons representing different sectors in the digital economy with captions, placed in a flow-like arrangement.
Market Analysis and Trends
Technology & Software
This slide covers the major sectors in the digital economy, indicating areas like e-commerce, payment systems, and health-tech among others.
Digital economy, sectors, e-commerce, payments, health-tech, SME services, lending, food delivery
false
Market Analysis and Trends
Technology & Software technology-and-software
Linear Flow
Kearney
View slide
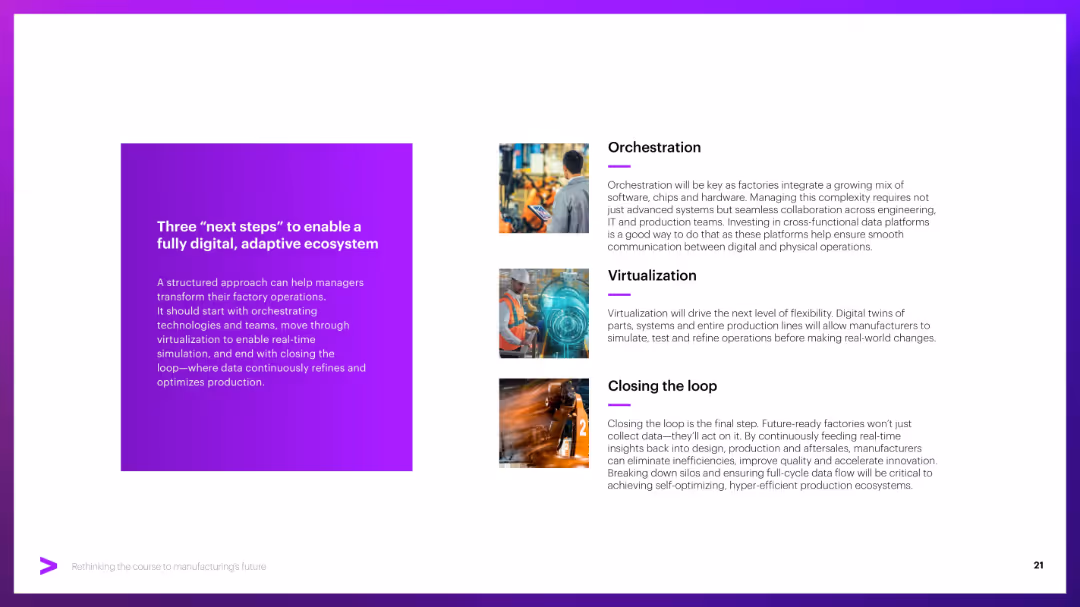
Left block with title on purple background; right side contains three vertical sections with icons and text (Orchestration, etc.).
Strategic Planning
Industrial & Manufacturing
Provides a three-step roadmap for achieving a digital factory: orchestration of systems, virtualization of processes, and closing the loop through data-driven continuous improvement.
Digital ecosystem, orchestration, virtualization, continuous improvement
false
Strategic Planning
Industrial & Manufacturing industrial-and-manufacturing
Vertical Flow
Accenture
View slide
Featuring a mobile device graphic, pie chart, and column chart, the slide is moderately detailed with text descriptions emphasizing digital client engagement and the value proposition.
Market Analysis and Trends
Financial Services
The slide demonstrates the role of digital channels in client acquisition and growth in self-directed investing accounts, emphasizing the integrated banking and investing experience. It is useful for illustrating the digital engagement trend and its impact on client account growth and banking integration.
Digital engagement, Client acquisition, Growth, Self-directed investing
false
Market Analysis and Trends
Financial Services financial-services
Multiple Chart
JP Morgan
View slide
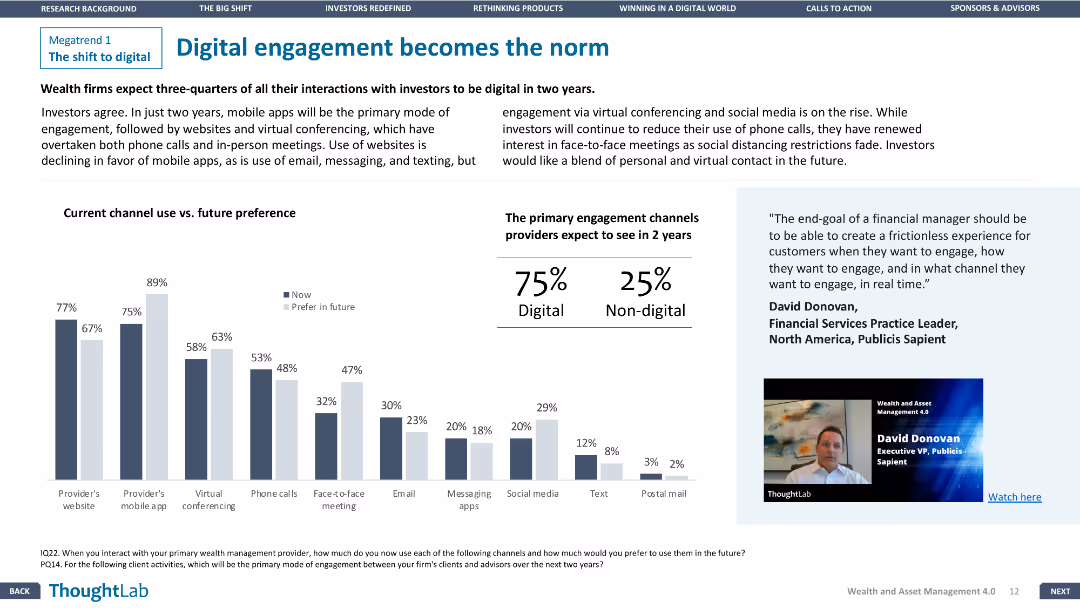
The slide features a column chart comparing current and future engagement channels and a quote on the right.
Technology and Digital Transformation
Financial Services
The slide discusses the shift towards digital engagement in wealth management, with a focus on future preferences for digital channels.
Digital engagement, Financial Services, Technology, Future trends, Channels
false
Technology and Digital Transformation
Financial Services financial-services
Mixed Chart
Deloitte
View slide
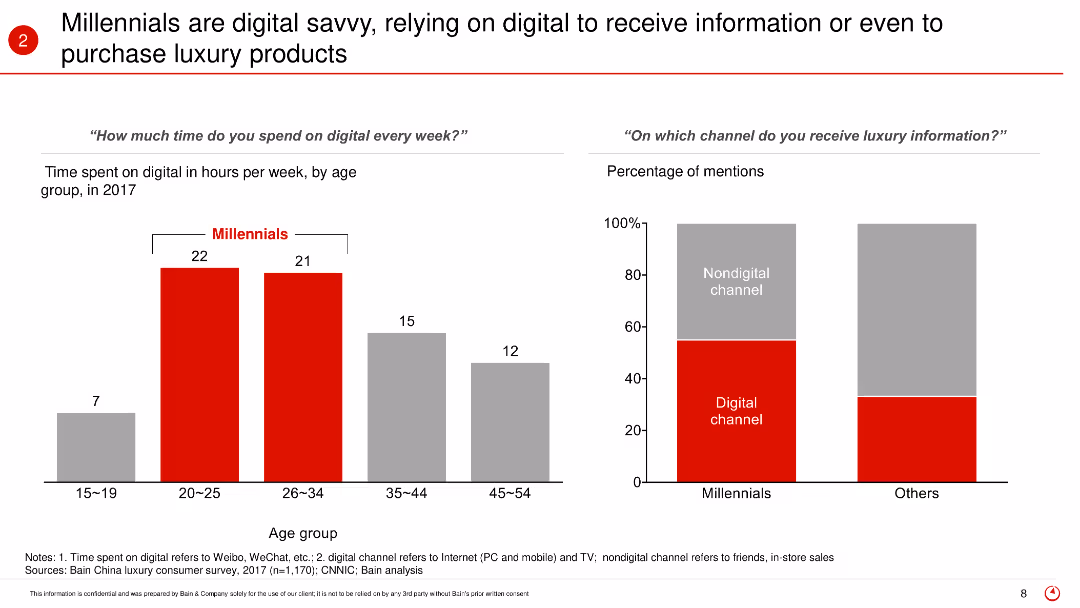
This slide features bar charts displaying the time spent on digital platforms by different age groups and the channels through which they receive luxury information. It highlights the digital engagement of Millennials compared to other age groups.
Market Analysis and Trends
Retail & E-commerce
The slide highlights the digital savviness of Millennials, showing how they rely heavily on digital platforms for receiving information and purchasing luxury products. It presents data on the average hours spent online per week and the preference for digital channels over non-digital ones for luxury information.
Digital engagement, Millennials, luxury products, online behavior, digital platforms, consumer information, purchasing habits, age groups
false
Market Analysis and Trends
Retail & E-commerce retail-and-e-commerce
Multiple Chart
Bain
View slide
The slide features three sets of column charts, displaying digital engagement, collaboration, and transaction metrics. The colors grey and blue differentiate between 1Q’19 and 1Q’21. A red banner at the bottom notes data inclusion from specific company divisions. Text boxes highlight key statistics.
Market Analysis and Trends
Financial Services
The purpose of this slide is to present the growth in digital engagement, collaboration, and transactions across an enterprise. It demonstrates the company’s progress in adopting digital tools and enhancing client interaction, which is crucial for staying competitive in the digital age.
Digital engagement, enterprise, collaboration, transactions, digital transformation, growth statistics, client interaction, competitive edge, market trends, digital tools
false
Market Analysis and Trends
Financial Services financial-services
Multiple Chart
Morgan Stanley
View slide
Showcases smartphone screenshots illustrating various digital banking services. The slide is visually engaging, with annotations and complementary icons to highlight each digital experience.
Technology and Digital Transformation
Financial Services
Highlights how an integrated suite of digital banking services enhances customer engagement. It's suitable for presenting digital strategy and customer experience improvements in financial services.
Digital experiences, Customer engagement, Financial services, Banking apps, Digital strategy
false
Technology and Digital Transformation
Financial Services financial-services
Graphic
JP Morgan
View slide
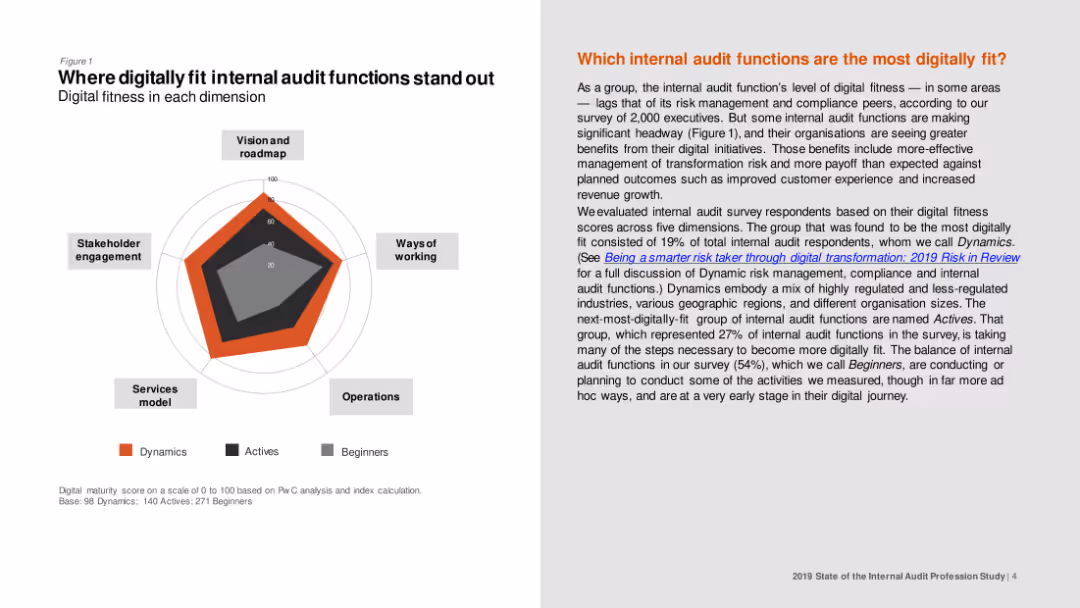
Spider chart illustrating digital fitness scores across dimensions like vision and roadmap, stakeholder engagement, and ways of working for different internal audit groups.
Technology and Digital Transformation
Professional Services
The slide highlights the areas where digitally fit internal audit functions excel, such as stakeholder engagement and services model, comparing Dynamics, Actives, and Beginners.
Digital fitness, internal audit, stakeholder engagement, vision, roadmap
false
Technology and Digital Transformation
Professional Services professional-services
Mixed Chart
PwC/Strategy&
View slide
Column chart showing the perceived value of digital health solutions across various SEA countries.
Technology and Digital Transformation
Healthcare & Pharmaceuticals
This slide presents the value derived from digital health solution adoption in SEA, emphasizing better patient care and new revenue streams.
Digital health, SEA, patient care, revenue streams, adoption
false
Technology and Digital Transformation
Healthcare & Pharmaceuticals healthcare-and-pharmaceuticals
Multiple Chart
LEK
View slide
Column chart showing the adoption of digital health solutions among public and private hospitals in SEA.
Technology and Digital Transformation
Healthcare & Pharmaceuticals
This slide details the adoption rates of digital health solutions in Southeast Asia hospitals, comparing public and private sector implementation.
Digital health, adoption, public hospitals, private hospitals, SEA
false
Technology and Digital Transformation
Healthcare & Pharmaceuticals healthcare-and-pharmaceuticals
Multiple Chart
LEK
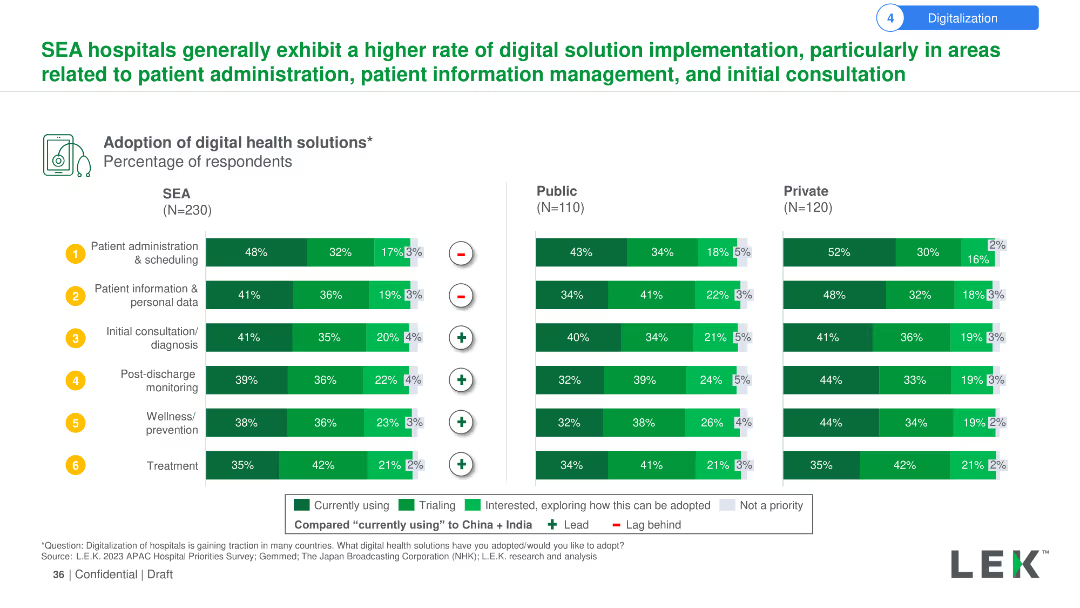
View slide
The slide uses a column chart to depict the adoption of various digital health solutions among hospitals in Southeast Asia, with comparisons to public and private hospitals. Each solution is marked with symbols indicating its priority and status compared to China and India.
Technology and Digital Transformation
Healthcare & Pharmaceuticals
The slide details the adoption rates of digital health solutions in SEA hospitals, comparing public and private sectors and indicating current use, trials, and interest levels. Highlights the leading solutions and their comparative status against China and India.
Digital health, adoption, solutions, hospitals, public, private, Southeast Asia, China, India, comparison
false
Technology and Digital Transformation
Healthcare & Pharmaceuticals healthcare-and-pharmaceuticals
Multiple Chart
LEK
View slide
The slide presents a bubble chart indicating the value from digital health solution adoption across different countries, focusing on metrics like staff efficiency, patient satisfaction, and medical error reduction.
Technology and Digital Transformation
Healthcare & Pharmaceuticals
The slide emphasizes the expected benefits of digital health solutions in hospitals worldwide, highlighting increases in staff efficiency, patient satisfaction, and the shift away from focusing solely on reducing medical errors.
Digital health, benefits, hospitals, efficiency, satisfaction
false
Technology and Digital Transformation
Healthcare & Pharmaceuticals healthcare-and-pharmaceuticals
Single Chart
LEK
View slide
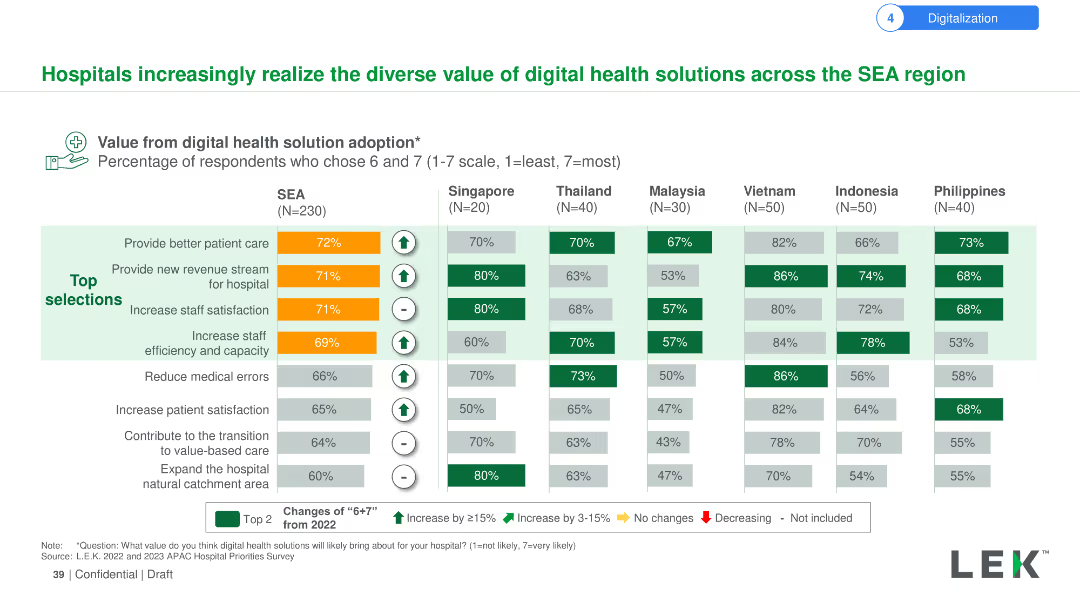
The slide uses a column chart to illustrate the perceived value from digital health solution adoption among hospitals in SEA, including better patient care, new revenue streams, and increased satisfaction. Percentages and trends are shown for multiple countries.
Technology and Digital Transformation
Healthcare & Pharmaceuticals
The slide presents the various benefits hospitals in SEA perceive from adopting digital health solutions, such as better patient care and new revenue streams. It compares these perceptions across different countries, highlighting key trends and changes from 2022.
Digital health, value, hospitals, SEA, patient care, revenue, satisfaction, adoption, countries, trends
false
Technology and Digital Transformation
Healthcare & Pharmaceuticals healthcare-and-pharmaceuticals
Multiple Chart
LEK
View slide
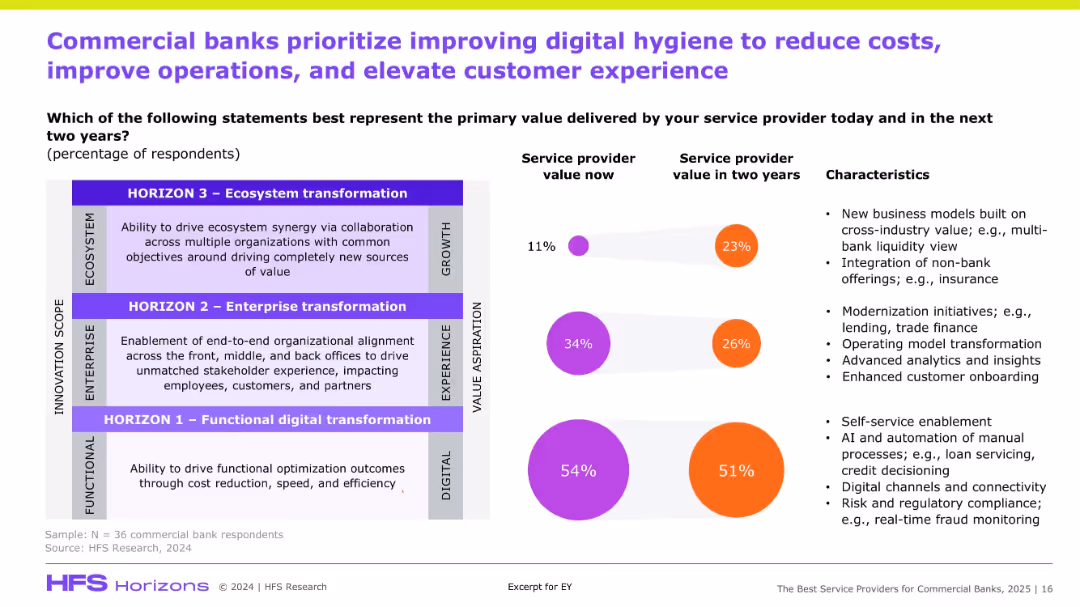
Split layout: value perception (left) vs. service priorities (right); color-coded circles and percentages.
Customer and Market Segmentation
Financial Services
The slide shows how commercial banks currently and expect to derive value from service providers, highlighting a shift from functional to ecosystem transformation over two years to enhance digital experience.
Digital hygiene, banking, transformation, cost reduction, AI, onboarding, value delivery
false
Customer and Market Segmentation
Financial Services financial-services
Mixed Chart
Accenture
View slide
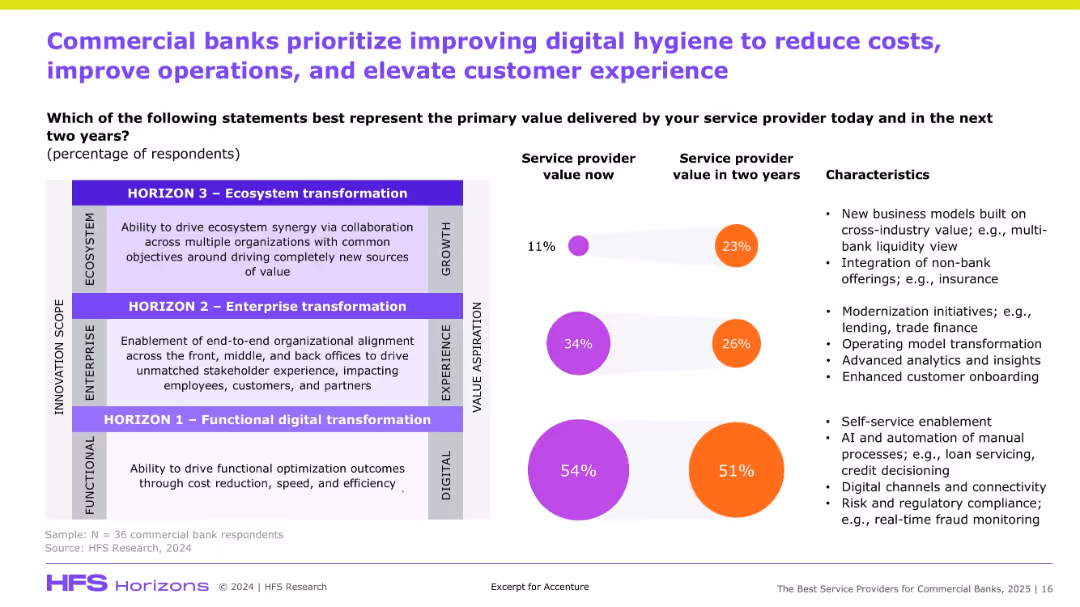
Split chart with percentage bubbles, columnar text on transformation horizons, and characteristics; right side lists drivers and definitions.
Strategic Planning
Financial Services
The slide identifies the evolving priorities of commercial banks, showing a projected shift in focus from basic functional digital transformation to ecosystem and enterprise transformations. It compares current vs future value expectations from service providers, and outlines characteristics like AI, advanced analytics, and business model integration.
Digital hygiene, transformation, ecosystem, enterprise alignment, AI, CX, cost reduction
false
Strategic Planning
Financial Services financial-services
Mixed Chart
Accenture
View slide
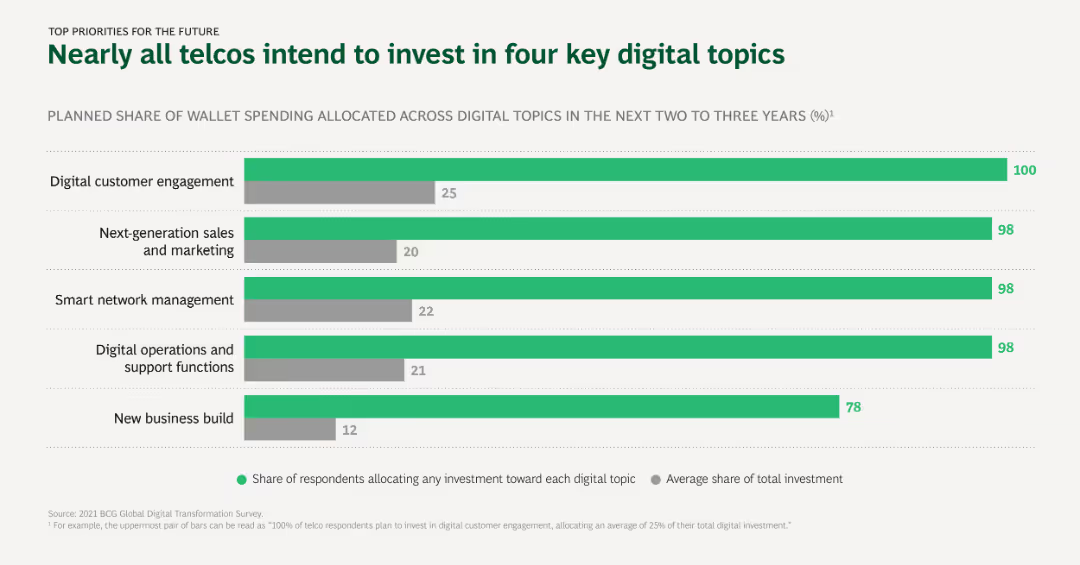
The slide uses horizontal bar charts to depict planned digital investment priorities among telcos, showing the share of wallet spending allocated to different digital topics over the next 2-3 years.
Investment Analysis
Telecommunications
This slide outlines the key digital topics that telcos plan to invest in, with digital customer engagement and next-generation sales and marketing being the top priorities.
Digital investment, Telcos, Priorities, Customer engagement, Sales and marketing
false
Investment Analysis
Telecommunications telecommunications
Single Chart
BCG
View slide
A line and bar graph depict the trend of digital investments in Indonesia from 2016 to 2020, with accompanying text on investment values and deal numbers.
Investment Analysis
Technology & Software
This slide presents the growing trend of digital investments in Indonesia, illustrating a doubling of investment in 2020.
Digital investments, trends, Indonesia, growth, deal value
false
Investment Analysis
Technology & Software technology-and-software
Single Chart
Kearney
View slide
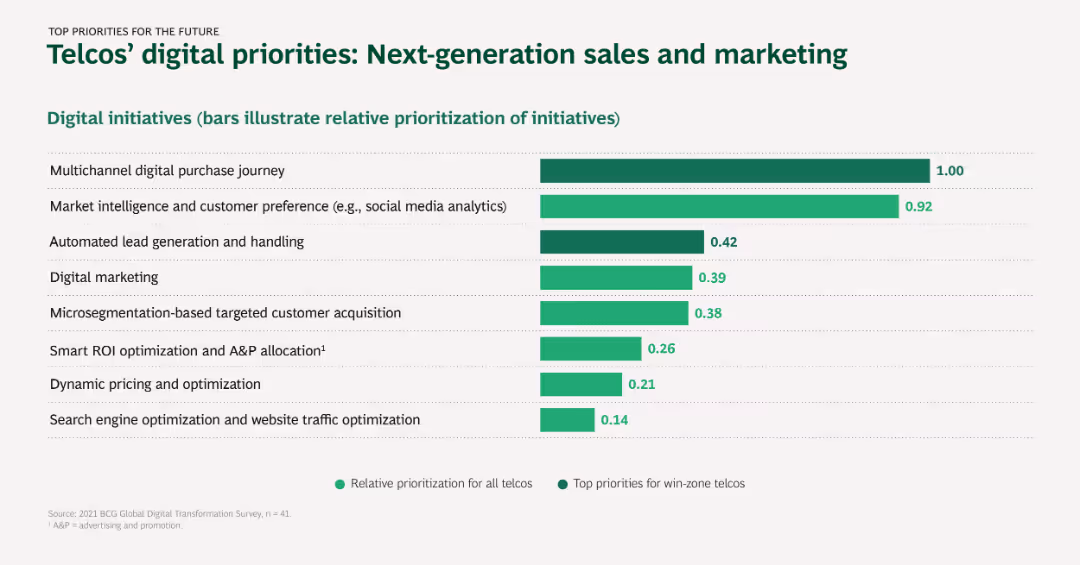
Horizontal bar chart showing the prioritization of digital initiatives in sales and marketing for telcos, with relative prioritization and top priorities highlighted.
Sales and Business Development
Telecommunications
The slide outlines telcos' focus on next-gen sales and marketing initiatives, including digital purchase journeys, market intelligence, and lead generation.
Digital marketing, Lead generation, Market intelligence, Sales optimization, Customer acquisition
false
Sales and Business Development
Telecommunications telecommunications
Single Chart
BCG
View slide
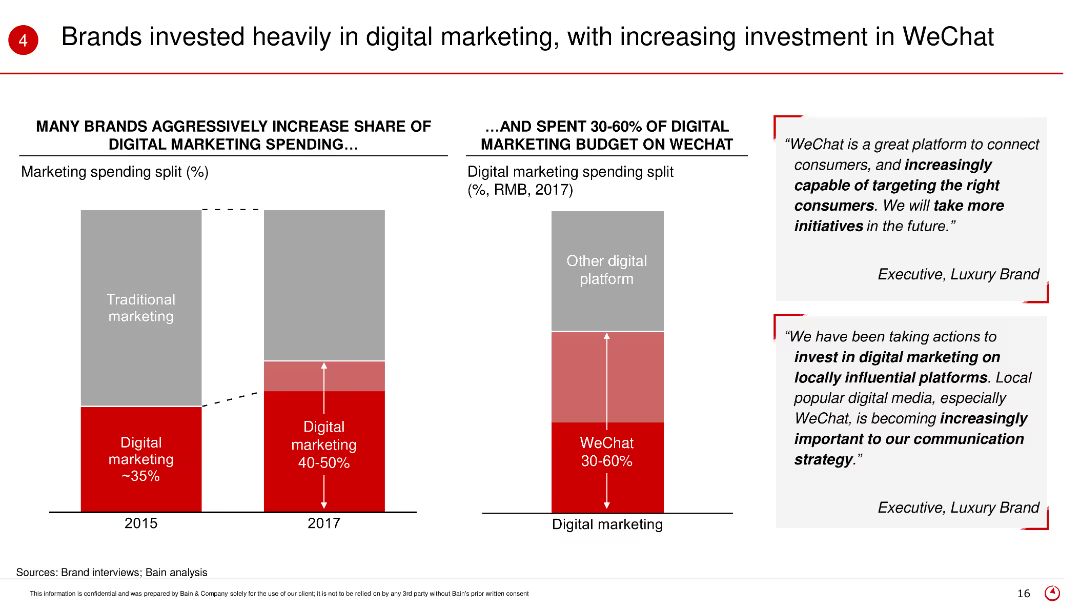
The slide shows bar charts comparing traditional and digital marketing spending in 2015 and 2017, and the proportion of digital marketing budget spent on WeChat. Text boxes include quotes from executives.
Market Analysis and Trends
Retail & E-commerce
This slide highlights the shift in marketing strategies among brands towards digital marketing, particularly emphasizing the significant investment in WeChat as a key platform for engagement.
Digital marketing, WeChat, marketing investment, traditional marketing, brand strategies
false
Market Analysis and Trends
Retail & E-commerce retail-and-e-commerce
Multiple Chart
Bain
View slide
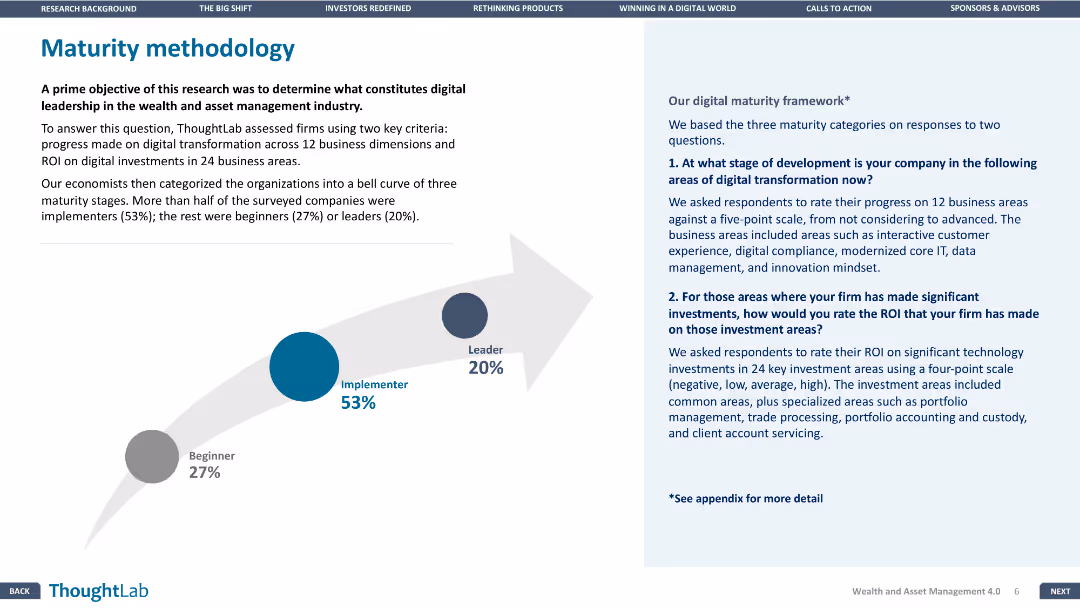
The slide features a bell curve with three maturity stages: Beginner (27%), Implementer (53%), Leader (20%). Text on the right explains the methodology.
Strategic Planning
Financial Services
The slide outlines a framework to categorize firms into three stages of digital maturity based on digital transformation progress and ROI.
Digital maturity, Transformation, ROI, Financial Services, Methodology
false
Strategic Planning
Financial Services financial-services
Mixed Chart
Deloitte
View slide
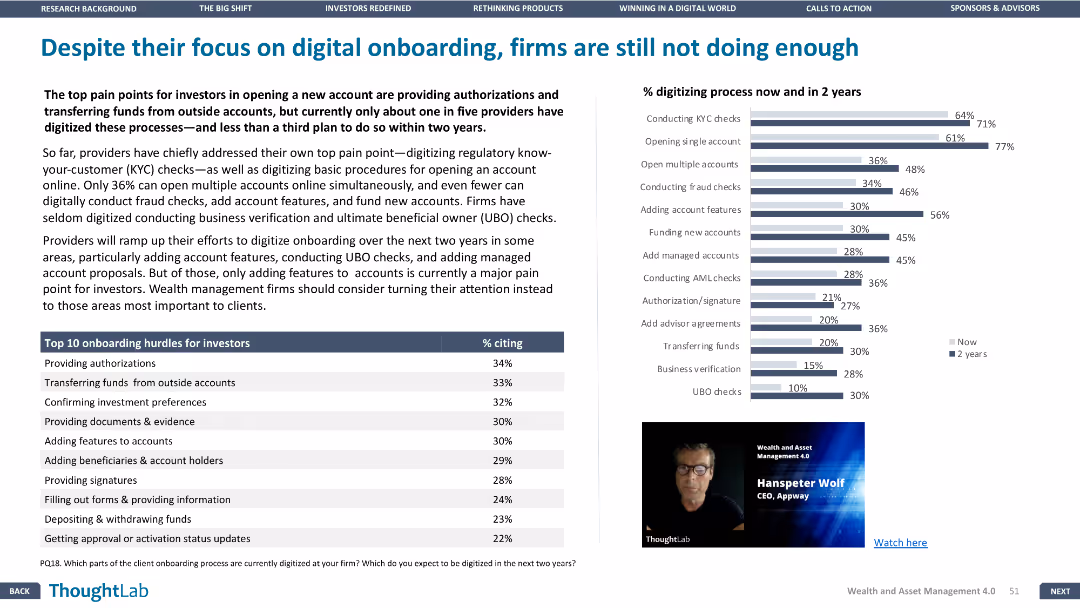
This slide features a column chart and a table. The layout is dense, with detailed data on the digitization of onboarding processes and the top onboarding hurdles for investors.
Technology and Digital Transformation
Financial Services
The slide points out that firms, despite investing in digital onboarding, are falling short in certain areas, with a focus on the percentage of firms digitizing various processes now and in two years.
Digital onboarding, digitization, investor hurdles, KYC, AML
false
Technology and Digital Transformation
Financial Services financial-services
Mixed Chart
Deloitte
View slide
The slide presents a bubble chart comparing digital penetration rates across various luxury sectors, such as personal goods, cars, and wine, with key insights.
Technology and Digital Transformation
Consumer Goods
Provides an overview of digital adoption in different luxury sectors, highlighting the leading role of personal luxury goods and the potential for growth in others.
Digital penetration, Luxury sectors, Technology adoption
false
Technology and Digital Transformation
Consumer Goods consumer-goods
Multiple Chart
Bain
View slide
The slide features percentage statistics in a column chart format with explanatory text beside each chart. Color coding is used to differentiate between the likelihood of increasing or maintaining usage.
Strategic Planning
Technology & Software
Focuses on the technological readiness of digital merchants in the Philippines and their anticipated adoption of digital platforms and financial services in the future.
Digital platforms, Financial services, Technological adoption, Future trends
false
Strategic Planning
Technology & Software technology-and-software
Multiple Chart
Bain
Previous
Loading...
Hold On!
We are searching in our database
If nothing, comes up, please try different filters!
Column Chart
Heatmap
Chevron
Org Chart
Infographic
Callouts
Timeline
List
Graphic
Picture
Process Flow
Diagram
Paragraph
Map
Table
Framework
Subtitle
Takeaway Box
Icon
Other Chart
Radar Chart
Waterfall Chart
Mekko Chart
Pie Chart
Scatter Plot
Line Chart
Bar chart
Bullet points
Create a FREE account to continue browsing
Receive Instant Access to 1,000+ slides from companies like McKinsey, Google, and Goldman Sachs
First Name
Last Name
Email
Password
I agree to all
Terms & Privacy Policy
Thank you! Your submission has been received!
Oops! Something went wrong while submitting the form.
Have an account?
Sign in
Upgrade to PRO to Save slides
Advanced Search and Filters
Access to 15,000+ slides
Access to Category Pages
Save/Bookmark Slides
PowerPoint Template Library
Pick a Plan
MONTHLY
$12/month
Billed every month, Cancel anytime.
YEARLY
$9/year
Billed $108 annually, Cancel anytime.
Checkout for $12/month
Checkout for $108/yr
Secured by Stripe | AES-256 bit encryption