My Account
My Slides
Search by Category
Templates
View All Templates
Download Template Slides
Leave Feedback
Login
Logout
Get Started
Browse all Slides
Browse all Slides
Create a FREE Account
Instant access to 1,000+ real slides from top companies like McKinsey, BCG, Goldman Sachs, Google and many more!
First Name
Last Name
Email
Password
I agree to all
Terms & Privacy Policy
Thank you! Your submission has been received!
Oops! Something went wrong while submitting the form.
Have an account?
Sign in
Spark Your Next Big Idea with New Presentation Templates
VIEW ALL Templates
Welcome,
Welcome
PRO
Show Featured Only
Checkbox 8
Companies
Mckinsey
Bain
BCG
EY
Deloitte
Accenture
PwC/Strategy&
JP Morgan
Goldman Sachs
Morgan Stanley
Citigroup
Deutsche Bank
Barclays
LEK
KPMG
Kearney
Oliver Wyman
Booz Allen Hamilton
Gartner
IPSOS
Nielsen
Slide type
Text Only
Linear Flow
Vertical Flow
Single Chart
Header Horizontal
Mixed Chart
Header Vertical
Pillar
Multiple Chart
Graphic
Agenda
Title
Table
Framework
Industry
Technology & Software
Artificial Intelligence
Financial Services
Retail & E-commerce
Consumer Goods
Industrial & Manufacturing
Transportation & Logistics
Telecommunications
Real Estate & Construction
Hospitality & Tourism
Professional Services
Education & Training
Media & Entertainment
Agriculture & Food Production
Healthcare & Pharmaceuticals
Environmental Services & Sustainability
Government & Public Sector
Use Case
Mergers and Acquisitions
Performance Metrics and KPIs
Client Case Studies
Competitive Landscape
Corporate Finance and Valuation
Product and Service Analysis
Customer and Market Segmentation
Organizational Structure and Change
Industry Overview
Regulatory and Compliance
Risk Assessment and Management
Investment Analysis
Organizational Structure and Change
Human Resources and Talent Management
Financial Performance
Market Analysis and Trends
Sales and Business Development
Human Resources and Talent Management
Clear all
Thank you! Your submission has been received!
Oops! Something went wrong while submitting the form.
Tag
View slide
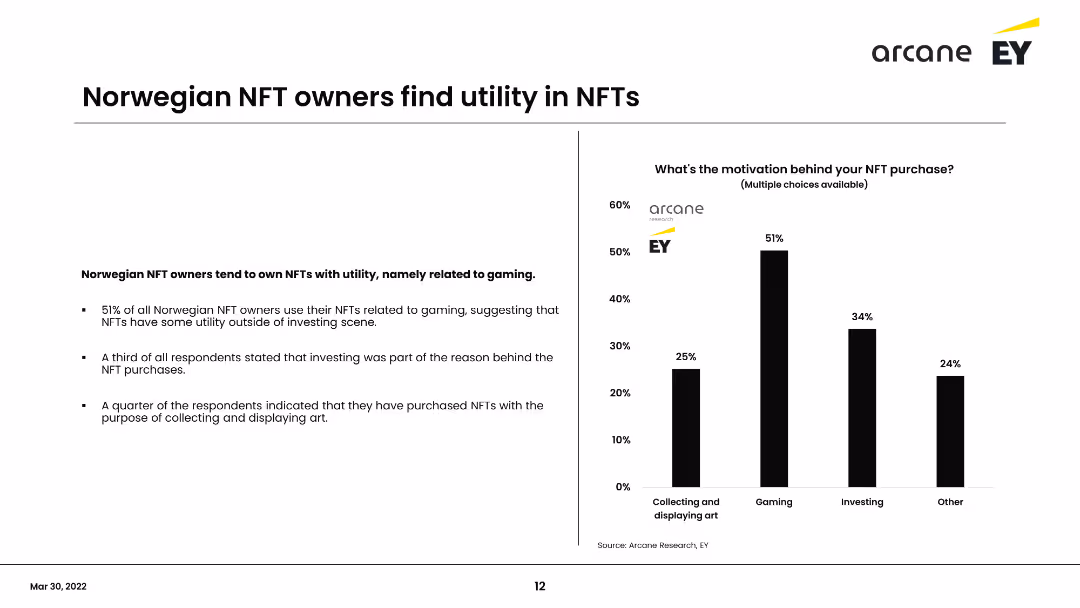
Utilizes a split design with data on the left, a column chart in the center and an image of a user interface on the right. There's a notable use of blue tones and digital motifs.
Operational Efficiency
Technology & Software
Outlines the firm's digital portal features, its revenue impact, and the upcoming developer tools designed to enhance user experience and connectivity.
Digital portal, revenue growth, developer tools, user interface, API, technology, financial services, user experience
false
Operational Efficiency
Technology & Software technology-and-software
Mixed Chart
JP Morgan
View slide
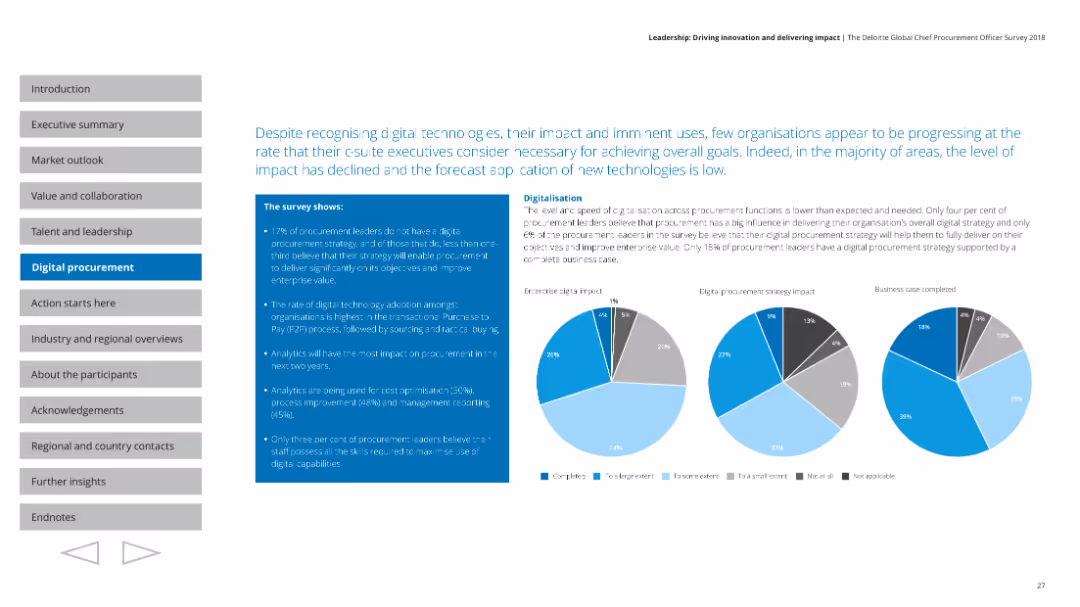
The slide includes column charts and pie charts, visually dense with key data points and statistics on digital procurement strategies and their impact.
Technology and Digital Transformation
Professional Services
Highlights the lack of digital procurement strategies among leaders, the adoption rates of digital technology, and key areas of digital impact.
Digital procurement, analytics, adoption, strategy, impact
false
Technology and Digital Transformation
Professional Services professional-services
Multiple Chart
Deloitte
View slide
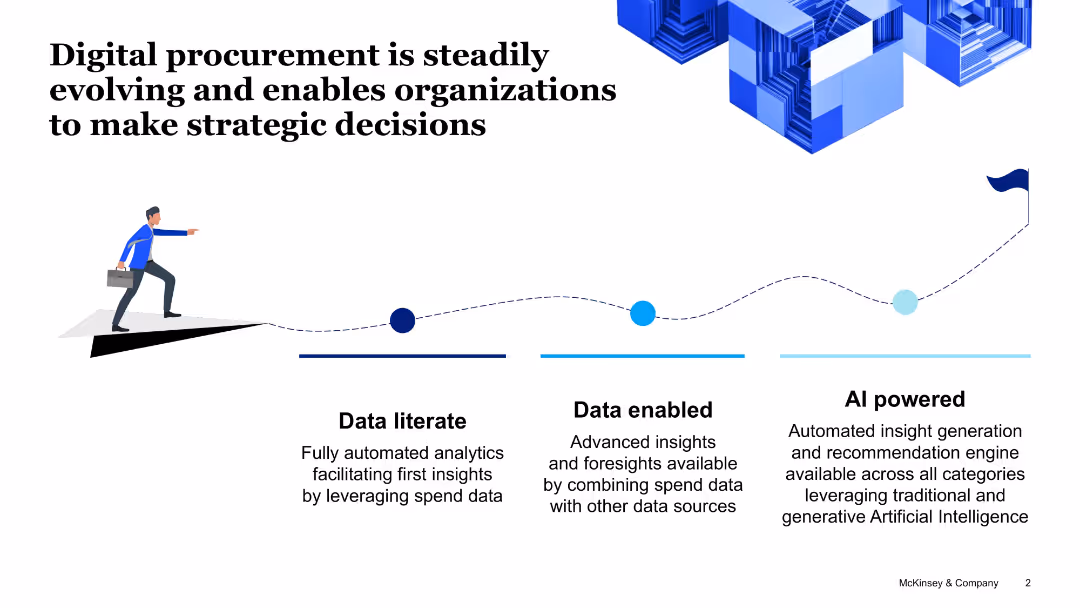
Clean white background with a progressive illustration showing a businessperson moving forward; text and three segments below (Data Literate, Data Enabled, AI Powered).
Technology and Digital Transformation
Professional Services
This slide outlines the maturity stages of digital procurement—from leveraging spend data for initial insights to combining it with other sources, culminating in AI-powered automation and recommendations.
Digital procurement, data literate, data enabled, AI, analytics, insights, automation, strategy
false
Technology and Digital Transformation
Professional Services professional-services
Linear Flow
McKinsey
View slide
The slide presents a series of column charts with percentage values, supplemented with descriptive text beside each set of data. Color differentiation highlights various aspects of technology adoption.
Strategic Planning
Technology & Software
Explores the preparedness of Singapore's digital merchants for future technological adoption, particularly in digital platforms and financial services, projecting growth and usage trends.
Digital readiness, Tech adoption, Financial services, Growth trends
false
Strategic Planning
Technology & Software technology-and-software
Multiple Chart
Bain
View slide
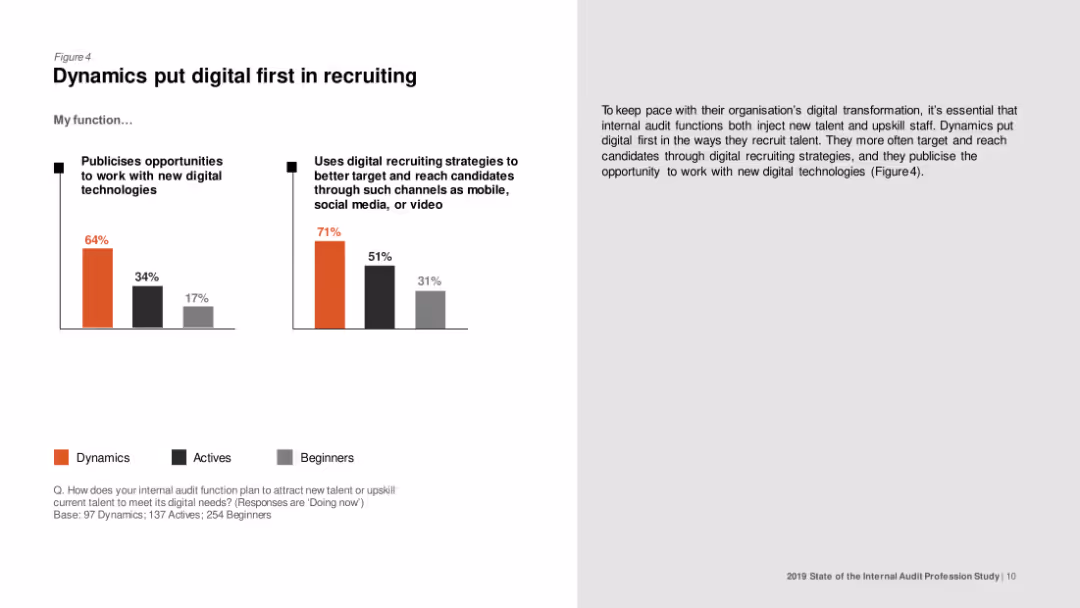
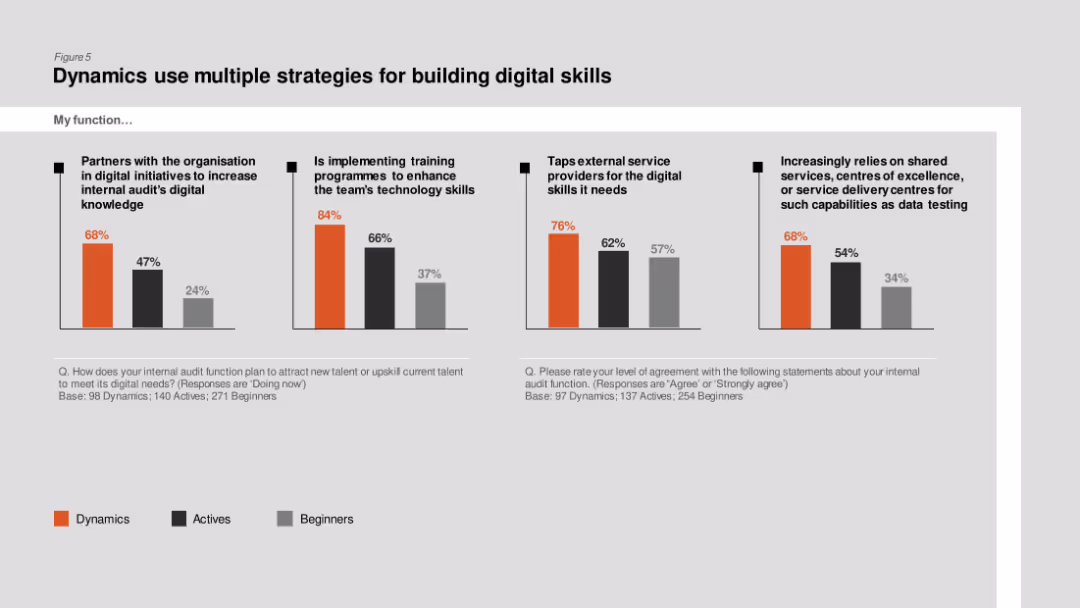
Column chart comparing the use of digital recruiting strategies and publicizing opportunities to work with new digital technologies among Dynamics, Actives, and Beginners.
Human Resources and Talent Management
Professional Services
The slide examines how internal audit functions are using digital strategies to recruit talent, showing higher adoption in Dynamics compared to Actives and Beginners.
Digital recruiting, internal audit, talent acquisition, Dynamics, Actives
false
Human Resources and Talent Management
Professional Services professional-services
Multiple Chart
PwC/Strategy&
View slide
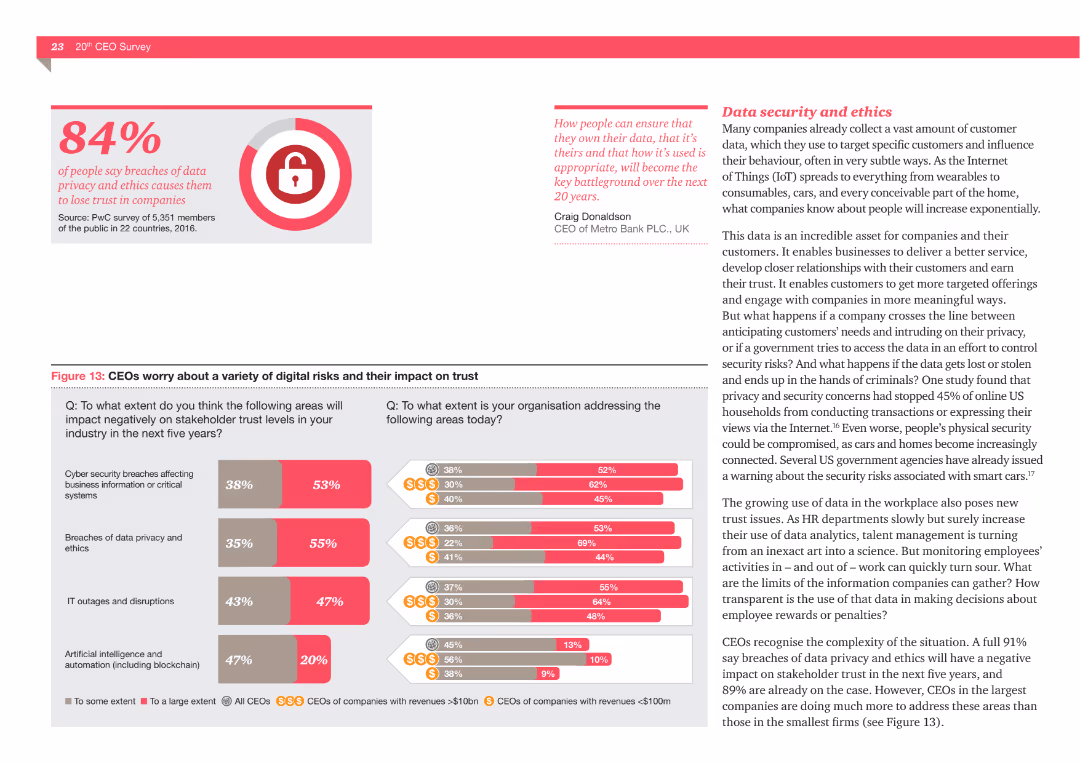
The slide includes a bar chart detailing CEOs' concerns about digital risks like cybersecurity breaches and IT outages, and their impact on stakeholder trust. It shows the extent to which these risks are being addressed.
Risk Assessment and Management
Technology & Software
This slide addresses the digital risks that concern CEOs, such as cybersecurity breaches, data privacy issues, and IT outages, and how these risks impact stakeholder trust. It also highlights the efforts made to address these risks.
Digital risks, cybersecurity, data privacy, IT outages, stakeholder trust, CEOs
false
Risk Assessment and Management
Technology & Software technology-and-software
Multiple Chart
PwC/Strategy&
View slide
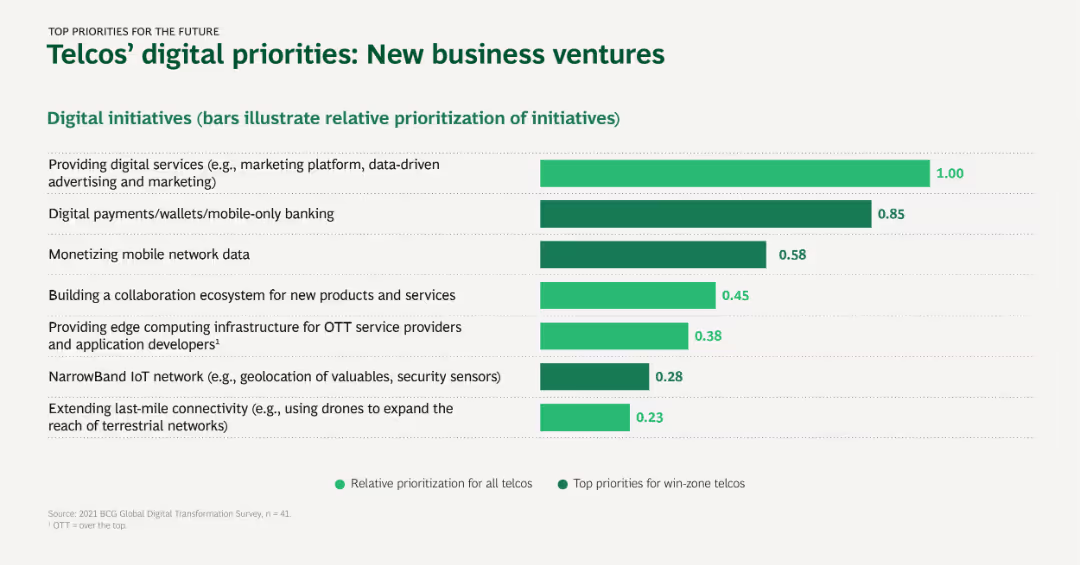
Horizontal bar chart representing the prioritization of digital initiatives for new business ventures in telcos, with a focus on top and relative priorities.
Market Analysis and Trends
Telecommunications
This slide details the digital initiatives telcos are prioritizing for new business ventures, including digital services, mobile banking, and IoT networks.
Digital services, Mobile banking, Network data, IoT, Business ventures
false
Market Analysis and Trends
Telecommunications telecommunications
Single Chart
BCG
View slide
Column charts comparing strategies like partnerships, training programs, and external service providers for building digital skills among Dynamics, Actives, and Beginners.
Human Resources and Talent Management
Professional Services
The slide details various strategies used by internal audit functions to enhance digital skills, showing higher implementation of training programs and partnerships in Dynamics.
Digital skills, training programs, internal audit, partnerships, Dynamics
false
Human Resources and Talent Management
Professional Services professional-services
Multiple Chart
PwC/Strategy&
View slide
Column chart detailing the adoption of digital solutions in patient administration, treatment, and post-discharge monitoring in SEA hospitals.
Technology and Digital Transformation
Healthcare & Pharmaceuticals
This slide highlights the higher adoption of digital solutions in SEA hospitals for patient management, treatment, and post-discharge monitoring.
Digital solutions, SEA hospitals, patient management, treatment, monitoring
false
Technology and Digital Transformation
Healthcare & Pharmaceuticals healthcare-and-pharmaceuticals
Multiple Chart
LEK
View slide
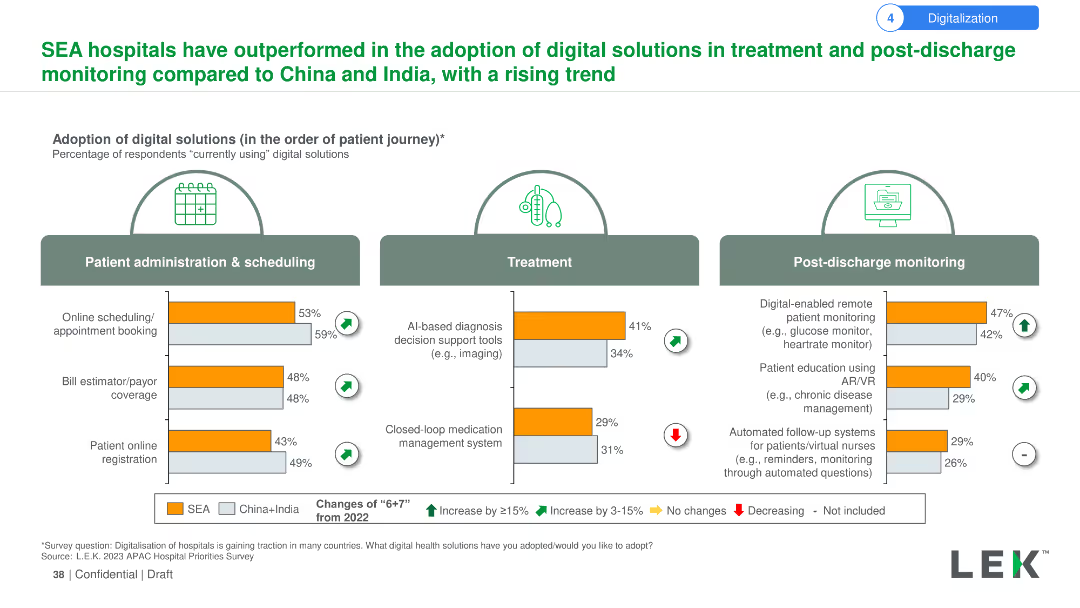
The slide uses column charts to show the adoption rates of digital solutions in patient administration, treatment, and post-discharge monitoring among hospitals in SEA compared to China and India. Indicators show the changes from 2022 in adoption rates.
Market Analysis and Trends
Healthcare & Pharmaceuticals
The slide highlights SEA hospitals' superior adoption rates of digital solutions in patient administration, treatment, and post-discharge monitoring compared to China and India. It also indicates the percentage changes from 2022 in these areas.
Digital solutions, adoption, SEA, hospitals, patient administration, treatment, post-discharge, China, India, comparison
false
Market Analysis and Trends
Healthcare & Pharmaceuticals healthcare-and-pharmaceuticals
Multiple Chart
LEK
View slide
This slide features graphics showing digital solutions like e-wallet and self-setup for collections, with icons and diagrams that illustrate the flow of operations and processes.
Operational Efficiency
Financial Services
Describes solutions to improve Limpa Nome's collection process, including e-wallet integrations and self-setup modules to expedite and streamline operations.
Digital solutions, e-wallet, finance
false
Operational Efficiency
Financial Services financial-services
Linear Flow
Barclays
View slide
The slide presents a side-by-side comparison of digital spending across various sectors, represented through colored horizontal bars, contrasting online spenders among internet users in India, China, and the US.
Market Analysis and Trends
Financial Services
It compares the percentage of internet users engaging in digital spending across different sectors such as e-commerce, travel & hotel, and financial services in three countries, highlighting the evolution of digital consumer behavior.
Digital spending, internet users, e-commerce, travel, financial services
false
Market Analysis and Trends
Financial Services financial-services
Single Chart
BCG
View slide
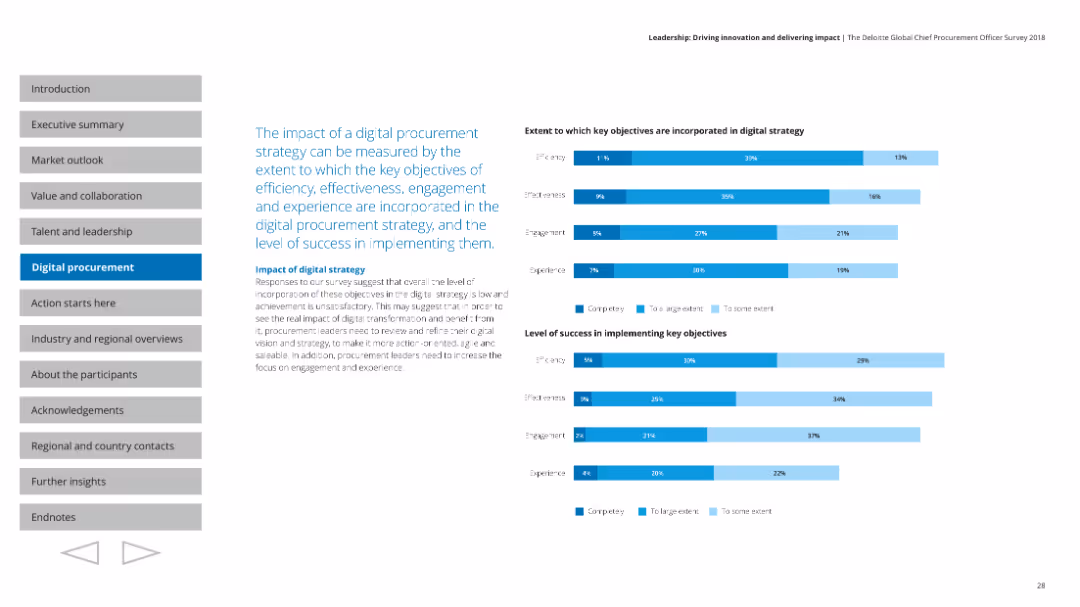
Features multiple column charts showing the extent to which key objectives are incorporated into digital strategy and the success level of implementation.
Technology and Digital Transformation
Professional Services
Measures the impact of digital procurement strategy, covering efficiency, effectiveness, engagement, and experience in implementation success.
Digital strategy, impact, objectives, efficiency, success
false
Technology and Digital Transformation
Professional Services professional-services
Multiple Chart
Deloitte
View slide
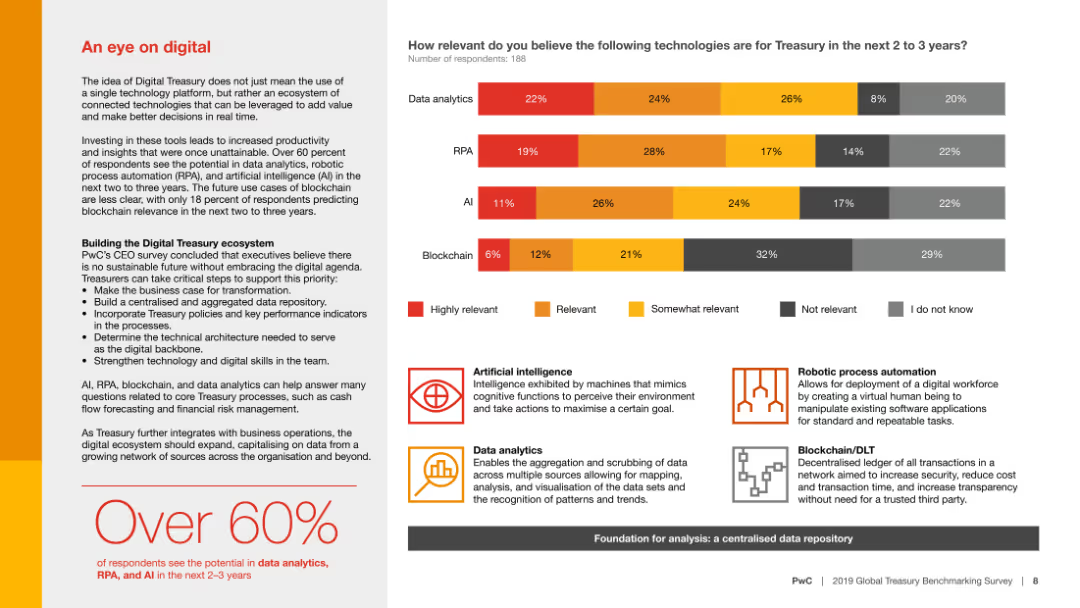
Column chart showing relevance of technologies like data analytics, RPA, AI, and blockchain for treasury in the next 2-3 years, with detailed descriptions for each technology.
Technology and Digital Transformation
Financial Services
The slide discusses the potential impact of various digital technologies on treasury operations, emphasizing the importance of data analytics, RPA, and AI over the next few years.
Digital technology, treasury, data analytics, RPA, AI
false
Technology and Digital Transformation
Financial Services financial-services
Mixed Chart
PwC/Strategy&
View slide
The slide presents layered blocks in gradient colors representing strategic interventions across different types of shoppers to drive growth in digital transactions.
Strategic Planning
Retail & E-commerce
This slide outlines strategic actions for digital transaction growth, targeting non-buyers, occasional, and frequent shoppers with tailored approaches such as simplification, attractive propositions, and loyalty incentives.
Digital transactions, growth strategies, e-commerce
false
Strategic Planning
Retail & E-commerce retail-and-e-commerce
Pillar
BCG
View slide
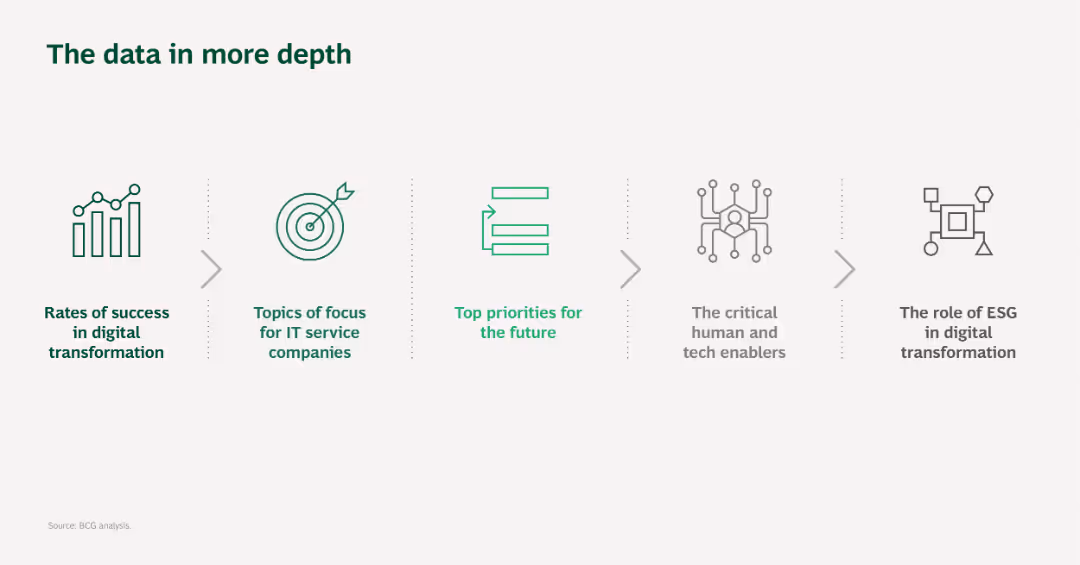
Simple layout with five icons representing different aspects of digital transformation data analysis.
Market Analysis and Trends
Telecommunications
This slide provides an overview of the topics covered in the presentation, including digital transformation success rates, IT service focus areas, and future priorities.
Digital transformation, Data analysis, IT services, Priorities, Topics overview
false
Market Analysis and Trends
Telecommunications telecommunications
Pillar
BCG
View slide
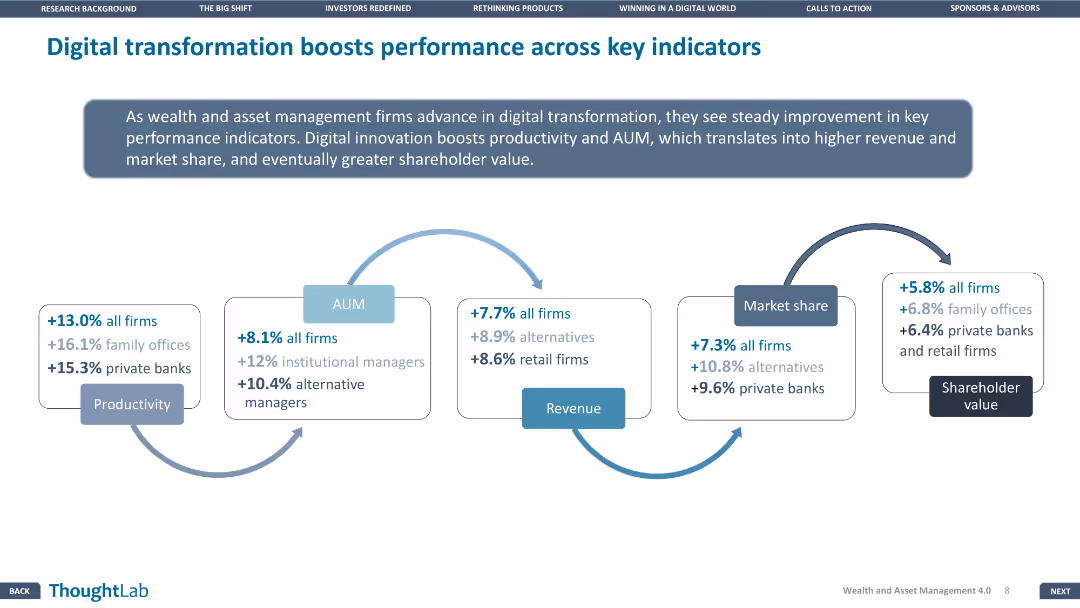
The slide uses a flow diagram to show the positive impact of digital transformation on key performance indicators like productivity, AUM, revenue, market share, and shareholder value.
Operational Efficiency
Financial Services
The slide demonstrates how digital transformation enhances performance in wealth and asset management through various key indicators.
Digital transformation, Key indicators, Financial Services, Performance, Productivity
false
Operational Efficiency
Financial Services financial-services
Linear Flow
Deloitte
View slide
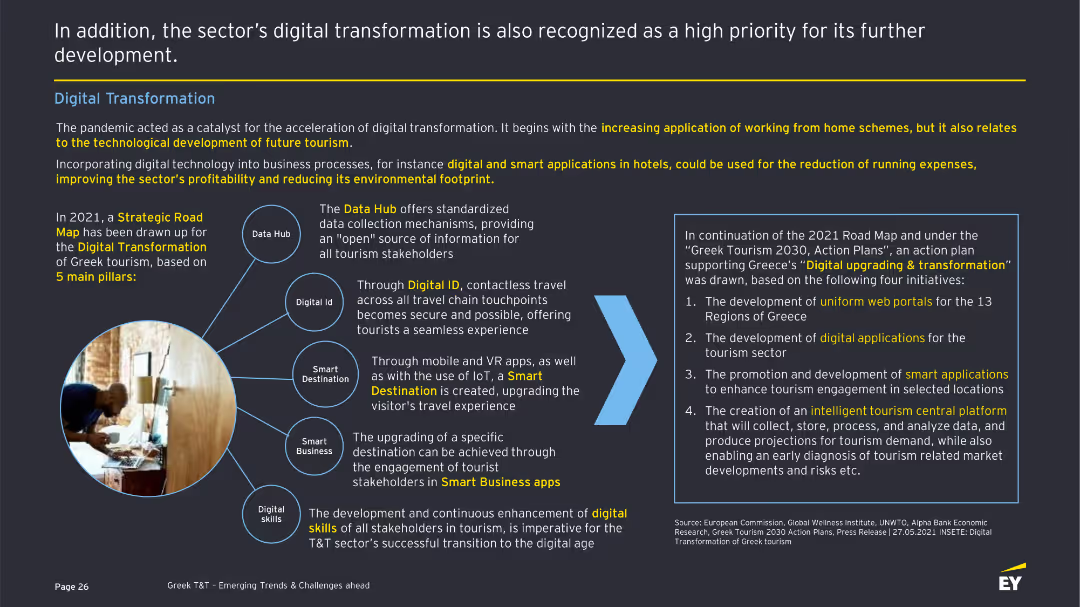
The slide showcases the digital transformation in the T&T sector with a diagram illustrating five pillars: Data Hub, Digital ID, Smart Destination, Smart Business, and Digital Skills. There are descriptions of each pillar and related initiatives.
Technology and Digital Transformation
Hospitality & Tourism
Highlights the acceleration of digital transformation in the Greek T&T sector, focusing on initiatives like Data Hub, Digital ID, and smart applications to improve profitability and reduce environmental impact. Details strategic goals and actions.
Digital transformation, Technology, T&T sector, Smart applications, Digital skills
false
Technology and Digital Transformation
Hospitality & Tourism hospitality-and-tourism
Framework
EY
View slide
The slide showcases the digital transformation in the T&T sector with a diagram illustrating five pillars: Data Hub, Digital ID, Smart Destination, Smart Business, and Digital Skills. There are descriptions of each pillar and related initiatives.
Technology and Digital Transformation
Hospitality & Tourism
Highlights the acceleration of digital transformation in the Greek T&T sector, focusing on initiatives like Data Hub, Digital ID, and smart applications to improve profitability and reduce environmental impact. Details strategic goals and actions.
Digital transformation, Technology, T&T sector, Smart applications, Digital skills
false
Technology and Digital Transformation
Hospitality & Tourism hospitality-and-tourism
Mixed Chart
EY
View slide
The slide uses a simple layout with five icons and brief text descriptions, visually connected by arrows, representing different focus areas in digital transformation for telcos.
Technology and Digital Transformation
Telecommunications
This slide provides an overview of the data topics covered in more detail later, focusing on digital transformation in the telecommunications sector.
Digital transformation, Telcos, Focus areas, Technology, Data analysis
false
Technology and Digital Transformation
Telecommunications telecommunications
Pillar
BCG
View slide
This slide includes text and a column chart on the right. The chart highlights the top constraints to digital transformation, with a percentage breakdown.
Technology and Digital Transformation
Financial Services
It discusses major constraints faced by banks in accelerating digital transformation, including scale of change, limited budgets, and technology challenges.
Digital transformation, constraints, scale of change, budgets, technology
false
Technology and Digital Transformation
Financial Services financial-services
Mixed Chart
EY
View slide
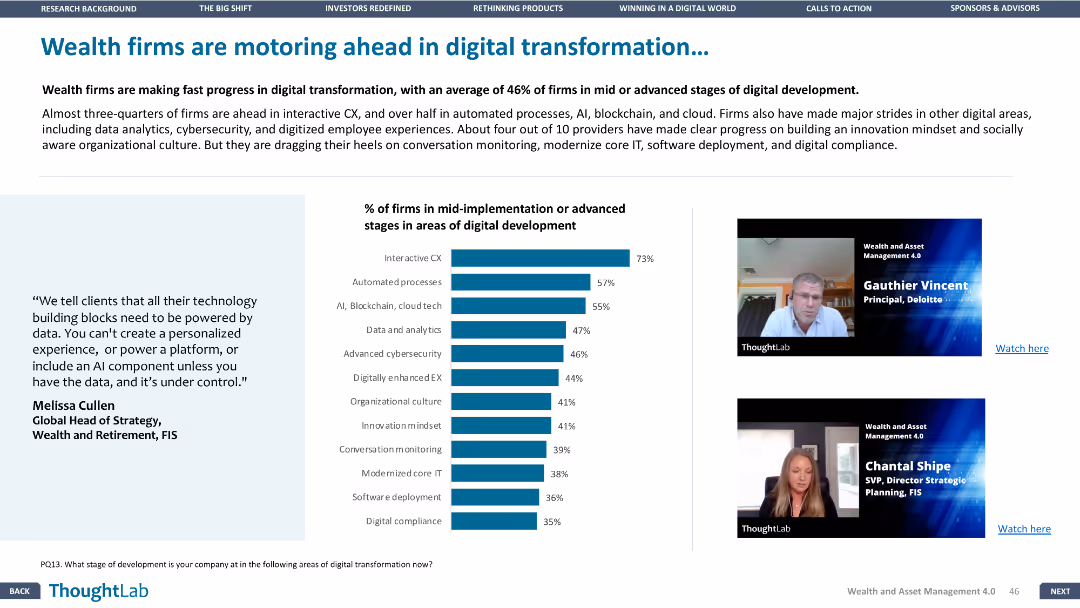
The slide includes a column chart and images of two speakers. The layout is moderately dense, with a focus on visual elements.
Technology and Digital Transformation
Financial Services
The slide details the progress of wealth firms in digital transformation, highlighting areas such as interactive customer experience, automated processes, and data analytics.
Digital transformation, customer experience, automation, analytics, wealth firms
false
Technology and Digital Transformation
Financial Services financial-services
Mixed Chart
Deloitte
View slide
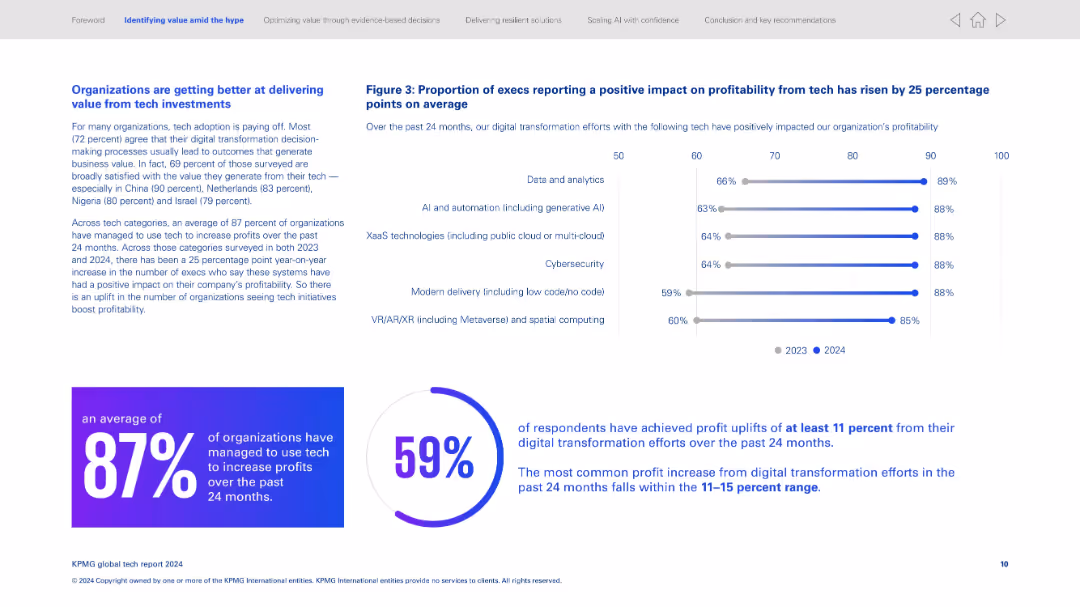
Split layout; left side has text-heavy content, right side has horizontal bar graph; bottom features two percentage callouts in circular design.
Strategic Planning
Technology & Software
Highlights how organizations are increasingly generating value from tech investments, especially digital transformation. Key statistics show 87% of organizations increased profits through tech, and 59% saw profit uplifts of at least 11%. The graph shows improved profitability across various tech domains from 2023 to 2024.
Digital transformation, profitability, AI adoption, data analytics, tech ROI, global survey, tech satisfaction, percentage uplift, cloud tech, VR/AR
false
Strategic Planning
Technology & Software technology-and-software
Multiple Chart
KPMG
View slide
Icons and text blocks outlining key achievements and strategies for digital transformation and technology upgrades.
Technology and Digital Transformation
Technology & Software
Describes the initiatives and achievements in digital transformation at UBS, focusing on technology and culture.
Digital transformation, technology, agile, AI, automation, UBS, digital culture, client services
false
Technology and Digital Transformation
Technology & Software technology-and-software
Pillar
UBS
View slide
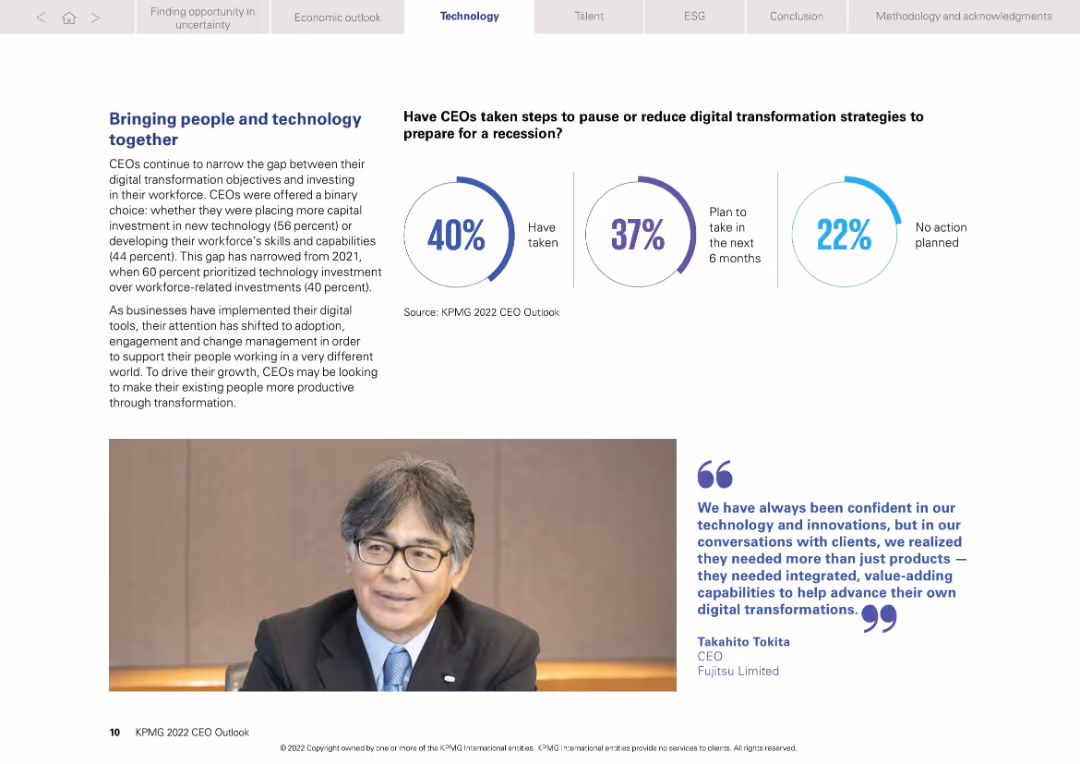
Left-aligned text with CEO quote and donut-style chart of strategic responses on right
Technology and Digital Transformation
Technology & Software
Emphasizes the narrowing gap between tech and workforce investment. Shows 40% of CEOs have paused digital initiatives due to economic conditions, with 37% planning future action. CEO commentary underscores the need for integrated, value-adding transformations.
Digital transformation, workforce, technology investment, CEO strategy
false
Technology and Digital Transformation
Technology & Software technology-and-software
Mixed Chart
KPMG
View slide
Dense text and graphics detailing 'Digital Twins' technology, its maturity, and applicability in industries, alongside sidebars for additional insights.
Technology and Digital Transformation
Technology & Software
Offers a deep dive into the technology of digital twins, explaining its functionality, benefits to companies, and industry applications. The slide also assesses the maturity and future development horizons of this technology.
Digital twins, technology analysis, industry application
false
Technology and Digital Transformation
Technology & Software technology-and-software
Header Horizontal
McKinsey
View slide
A combination of bar charts and graphs show digital consumer growth and the reasons for using digital services, with a clean layout.
Market Analysis and Trends
Technology & Software
Analyzes the dramatic increase in digital consumers in Thailand and their commitment to continue using digital services.
Digital, Consumers, Thailand, Growth, Services, Penetration, E-commerce, Reasons, Continuation
false
Market Analysis and Trends
Technology & Software technology-and-software
Multiple Chart
Bain
View slide
A bar chart depicting the perceived effectiveness of digital paid channels like email, search, and social media. Each bar is segmented by confidence levels among marketers, similar to the previous slide.
Market Analysis and Trends
Media & Entertainment
This slide provides insights into marketers' confidence in the effectiveness of various digital paid media channels. It includes data on channels like email, search, and social media, showing how marketers rate their effectiveness.
Digital, Media, Effectiveness, Channels, Confidence
false
Market Analysis and Trends
Media & Entertainment media-and-entertainment
Mixed Chart
Nielsen
View slide
A two-column slide with a large image of a lion on the left, a title with a yellow number "5" in a box, and text with statistics and a bar chart on the right. The slide is visually moderate with a mix of text, image, and a column chart.
Risk Assessment and Management
Technology & Software
The slide emphasizes the importance for boards to understand the risks associated with digital transformations, citing a survey about board confidence and effective oversight. It suggests measures to improve resilience, like education and collaboration with CTOs.
Digital, Risk, Technology, Board, Survey, Confidence
false
Risk Assessment and Management
Technology & Software technology-and-software
Mixed Chart
EY
View slide
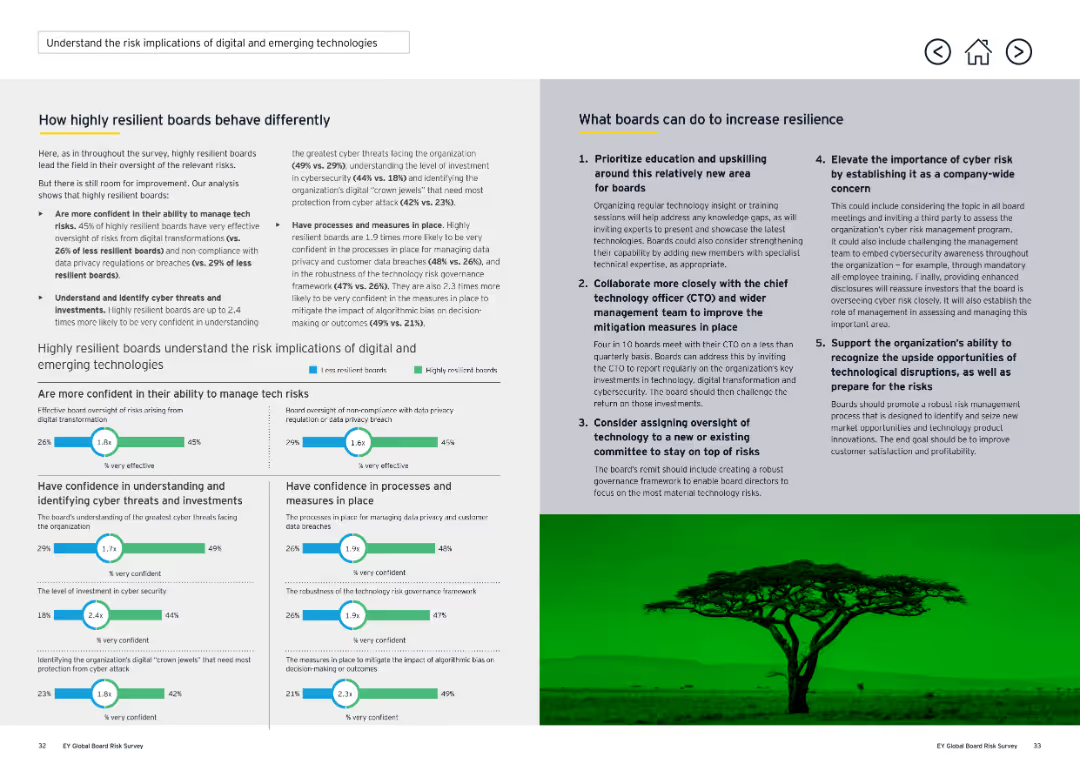
This two-column slide contains detailed text on both sides, with a horizontal line separating sections. It includes several comparative statistics and recommendations. The visual complexity is moderate.
Risk Assessment and Management
Technology & Software
The slide details how highly resilient boards manage tech risks better and what boards can do to increase resilience. It compares the confidence levels of different boards in managing technology risks and provides strategies for improvement, such as prioritizing education and upskilling.
Digital, Risk, Technology, Resilience, Boards
false
Risk Assessment and Management
Technology & Software technology-and-software
Multiple Chart
EY
Previous
Loading...
Hold On!
We are searching in our database
If nothing, comes up, please try different filters!
Column Chart
Heatmap
Chevron
Org Chart
Infographic
Callouts
Timeline
List
Graphic
Picture
Process Flow
Diagram
Paragraph
Map
Table
Framework
Subtitle
Takeaway Box
Icon
Other Chart
Radar Chart
Waterfall Chart
Mekko Chart
Pie Chart
Scatter Plot
Line Chart
Bar chart
Bullet points
Create a FREE account to continue browsing
Receive Instant Access to 1,000+ slides from companies like McKinsey, Google, and Goldman Sachs
First Name
Last Name
Email
Password
I agree to all
Terms & Privacy Policy
Thank you! Your submission has been received!
Oops! Something went wrong while submitting the form.
Have an account?
Sign in
Upgrade to PRO to Save slides
Advanced Search and Filters
Access to 15,000+ slides
Access to Category Pages
Save/Bookmark Slides
PowerPoint Template Library
Pick a Plan
MONTHLY
$12/month
Billed every month, Cancel anytime.
YEARLY
$9/year
Billed $108 annually, Cancel anytime.
Checkout for $12/month
Checkout for $108/yr
Secured by Stripe | AES-256 bit encryption