My Account
My Slides
Search by Category
Templates
View All Templates
Download Template Slides
Leave Feedback
Login
Logout
Get Started
Browse all Slides
Browse all Slides
Create a FREE Account
Instant access to 1,000+ real slides from top companies like McKinsey, BCG, Goldman Sachs, Google and many more!
First Name
Last Name
Email
Password
I agree to all
Terms & Privacy Policy
Thank you! Your submission has been received!
Oops! Something went wrong while submitting the form.
Have an account?
Sign in
Spark Your Next Big Idea with New Presentation Templates
VIEW ALL Templates
Welcome,
Welcome
PRO
Show Featured Only
Checkbox 8
Companies
Mckinsey
Bain
BCG
EY
Deloitte
Accenture
PwC/Strategy&
JP Morgan
Goldman Sachs
Morgan Stanley
Citigroup
Deutsche Bank
Barclays
LEK
KPMG
Kearney
Oliver Wyman
Booz Allen Hamilton
Gartner
IPSOS
Nielsen
Slide type
Text Only
Linear Flow
Vertical Flow
Single Chart
Header Horizontal
Mixed Chart
Header Vertical
Pillar
Multiple Chart
Graphic
Agenda
Title
Table
Framework
Industry
Technology & Software
Artificial Intelligence
Financial Services
Retail & E-commerce
Consumer Goods
Industrial & Manufacturing
Transportation & Logistics
Telecommunications
Real Estate & Construction
Hospitality & Tourism
Professional Services
Education & Training
Media & Entertainment
Agriculture & Food Production
Healthcare & Pharmaceuticals
Environmental Services & Sustainability
Government & Public Sector
Use Case
Mergers and Acquisitions
Performance Metrics and KPIs
Client Case Studies
Competitive Landscape
Corporate Finance and Valuation
Product and Service Analysis
Customer and Market Segmentation
Organizational Structure and Change
Industry Overview
Regulatory and Compliance
Risk Assessment and Management
Investment Analysis
Organizational Structure and Change
Human Resources and Talent Management
Financial Performance
Market Analysis and Trends
Sales and Business Development
Human Resources and Talent Management
Clear all
Thank you! Your submission has been received!
Oops! Something went wrong while submitting the form.
Tag
View slide
Slide contains charts and visual elements that illustrate the enhancement of digital services.
Technology and Digital Transformation
Financial Services
Discusses the role of digital transformation in enhancing service delivery, focusing on customer experience and operational efficiency.
Digital, Services, Enhancement, Technology
false
Technology and Digital Transformation
Financial Services financial-services
Single Chart
Barclays
View slide
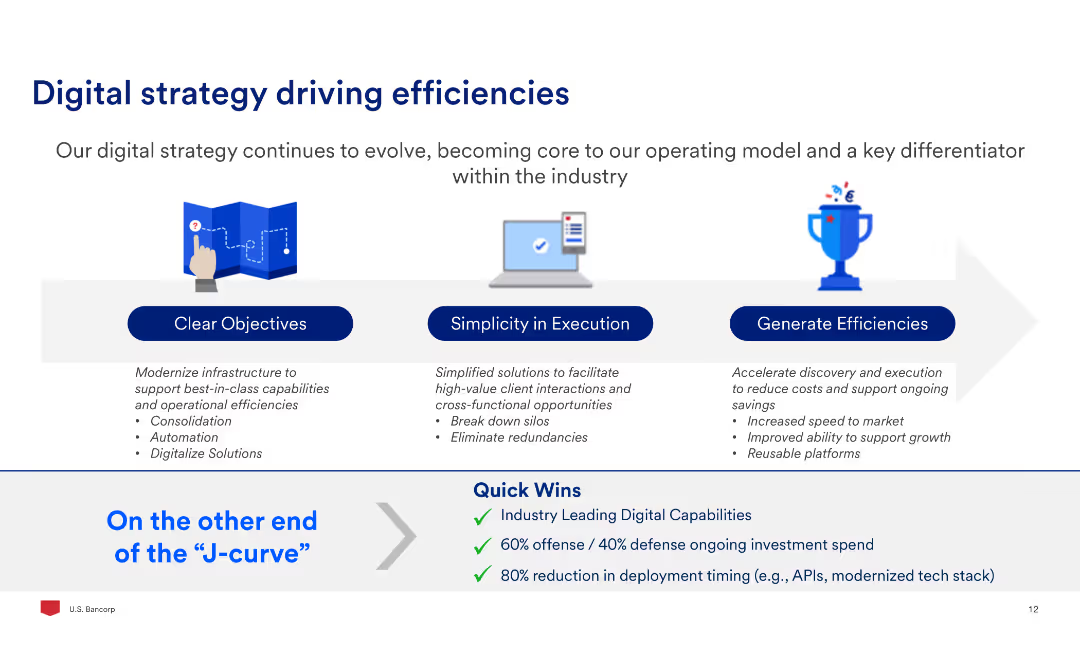
The slide features a process flow with three main sections: Clear Objectives, Simplicity in Execution, and Generate Efficiencies, supported by a list of key actions and quick wins.
Strategic Planning
Financial Services
The slide outlines the digital strategy focusing on modernizing infrastructure, simplifying execution, and generating efficiencies, highlighting the key actions and expected quick wins.
Digital, Strategy, Efficiency, Execution, Objectives, Planning
false
Strategic Planning
Financial Services financial-services
Pillar
Barclays
View slide
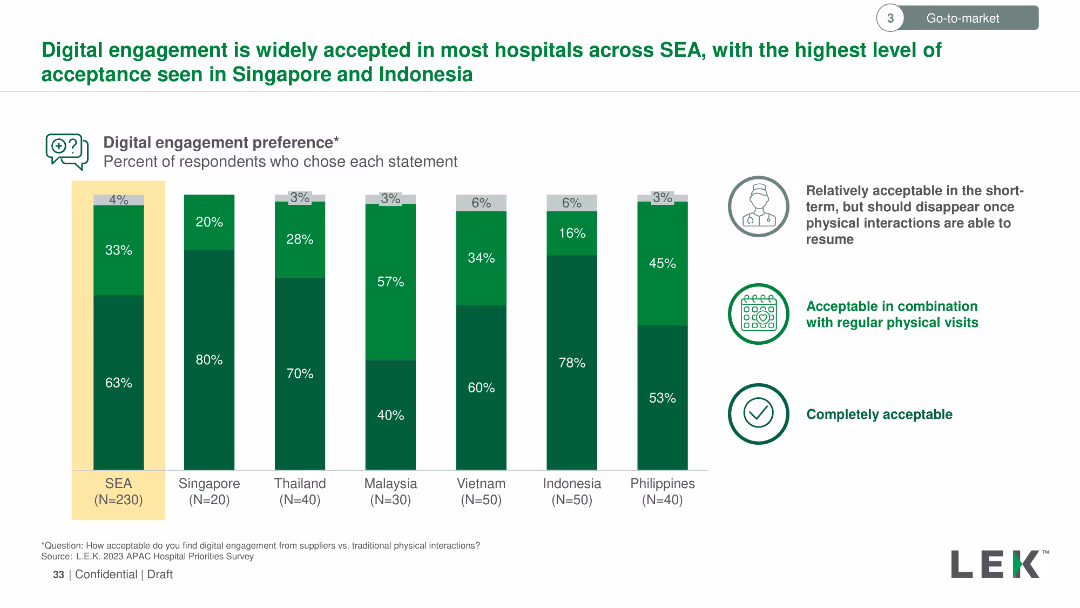
The slide uses a column chart to represent the percentage of respondents' acceptance of digital engagement in hospitals across various countries. Green shades indicate different levels of acceptance.
Market Analysis and Trends
Healthcare & Pharmaceuticals
The slide shows the acceptance levels of digital engagement in hospitals in Southeast Asia, highlighting the highest acceptance in Singapore and Indonesia. Data segments responses into three categories: short-term, regular physical visits, and completely acceptable.
Digital, engagement, hospitals, acceptance, Southeast Asia, Singapore, Indonesia, percentage, short-term, visits, acceptable
false
Market Analysis and Trends
Healthcare & Pharmaceuticals healthcare-and-pharmaceuticals
Mixed Chart
LEK
View slide
Bar charts, color-coded data, percentage indicators.
Investment Analysis
Technology & Software
Illustrates CEO plans to increase digital investments post-COVID-19.
Digital, investment, CEOs, COVID-19, cybersecurity, sustainability, R&D, supply chain
false
Investment Analysis
Technology & Software technology-and-software
Single Chart
PwC/Strategy&
View slide
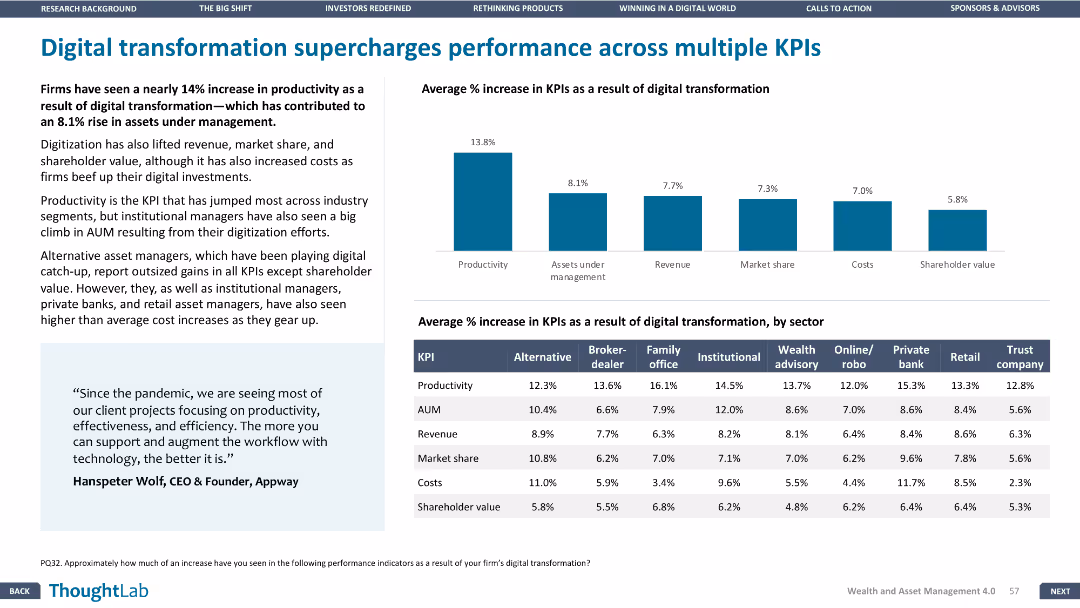
Column chart depicting average percentage increase in KPIs due to digital transformation across various sectors.
Performance Metrics and KPIs
Financial Services
Shows the impact of digital transformation on productivity, AUM, revenue, market share, costs, and shareholder value.
Digital, transformation, KPIs, performance, productivity
false
Performance Metrics and KPIs
Financial Services financial-services
Multiple Chart
Deloitte
View slide
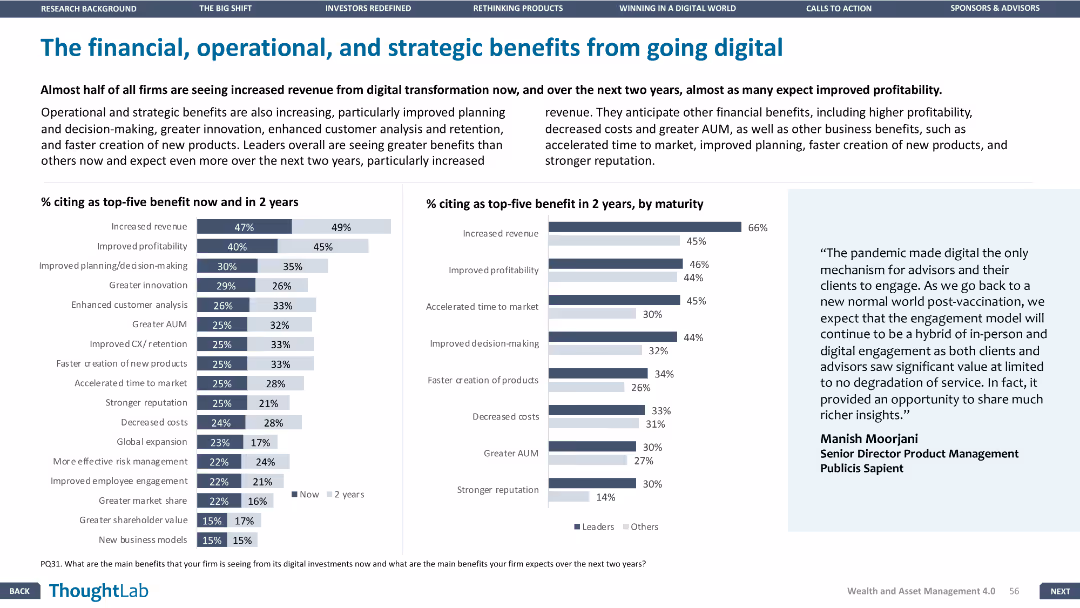
A column chart showing percentage citing top-five benefits now and in 2 years and another column chart by maturity.
Technology and Digital Transformation
Financial Services
Highlights the expected benefits from digital transformation over the next two years, emphasizing revenue increase and profitability.
Digital, transformation, revenue, benefits, strategy
false
Technology and Digital Transformation
Financial Services financial-services
Multiple Chart
Deloitte
View slide
The slide presents a data-driven layout with bullet points, icons, and statistics to showcase the capabilities in digital-underwriting and data analytics.
Technology and Digital Transformation
Financial Services
Describes JPMorgan Chase's data assets and their applications in digital-underwriting, credit line increases, and fraud detection to improve efficiency and customer experience.
Digital-underwriting, data analytics, fraud detection, efficiency, customer experience
false
Technology and Digital Transformation
Financial Services financial-services
Pillar
JP Morgan
View slide
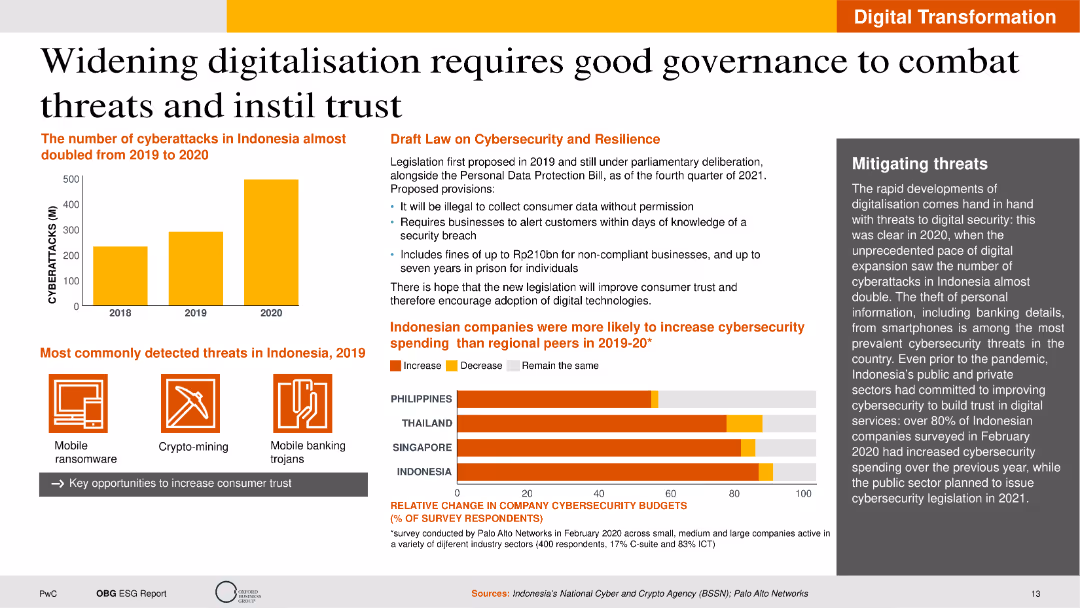
The slide features text sections on cybersecurity threats, a bar chart of cyberattack statistics, and a policy draft description. The layout is information-heavy with a clear distinction between visual and textual elements.
Technology and Digital Transformation
Telecommunications
It discusses the importance of good governance in digitalization, focusing on cybersecurity threats and the legislative response in Indonesia. The slide provides data on cyberattacks and highlights efforts to improve digital security.
Digitalisation, Cybersecurity, Governance, Indonesia, Threats
false
Technology and Digital Transformation
Telecommunications telecommunications
Multiple Chart
PwC/Strategy&
View slide
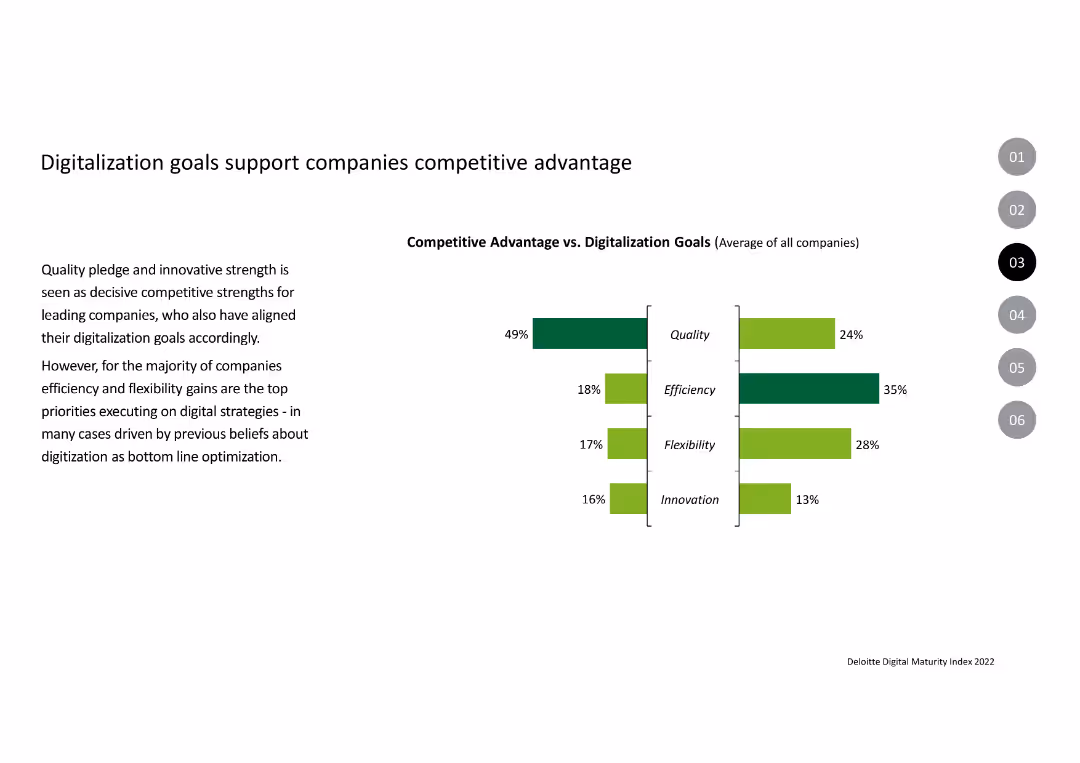
The slide contains a column chart comparing competitive advantages vs. digitalization goals across metrics like quality, efficiency, flexibility, and innovation.
Strategic Planning
Professional Services
This slide shows how companies align their digitalization goals with competitive advantages, focusing on quality, efficiency, flexibility, and innovation.
Digitalization, Competitive Advantage, Quality, Efficiency, Flexibility, Innovation
false
Strategic Planning
Professional Services professional-services
Multiple Chart
Deloitte
View slide
Circular diagram illustrating the data value chain from data collection to monetization, with a column chart projecting total data traffic from 2020 to 2026.
Technology and Digital Transformation
Technology & Software
The slide emphasizes the market opportunities created by digitalization along the data value chain. It outlines the process from data collection to value creation and monetization, projecting a substantial increase in data traffic and highlighting the economic potential of data-driven business models.
Digitalization, Data Value Chain, Monetization, Data Traffic
false
Technology and Digital Transformation
Technology & Software technology-and-software
Mixed Chart
Roland Berger
View slide
Slide with iconographic bullet points detailing digital features for home buying and refinancing, and bar charts depicting customer acquisition and retention metrics.
Technology and Digital Transformation
Financial Services
Highlights the digitalization efforts and successes in home lending services, suitable for presenting technological advancement in banking services.
Digitalization, Home Buying, Customer Retention, Banking Services
false
Technology and Digital Transformation
Financial Services financial-services
Table
JP Morgan
View slide
The slide features bar charts showing risks and opportunities percentages. Text boxes detail risks and opportunities, and a summary box highlights key takeaways.
Market Analysis and Trends
Transportation & Logistics
It presents survey results indicating a need for repositioning in aerospace and defense functions due to digitalization, with focus on production and logistics.
Digitalization, aerospace, defense, risks, opportunities, production, logistics
false
Market Analysis and Trends
Transportation & Logistics transportation-and-logistics
Multiple Chart
Roland Berger
View slide
The slide features bar charts showing risks and opportunities percentages. Text boxes detail risks and opportunities, and a summary box highlights key takeaways.
Market Analysis and Trends
Transportation & Logistics
It shows survey results indicating a high need for repositioning in automotive functions due to digitalization, with focus on production, procurement, and logistics.
Digitalization, automotive, risks, opportunities, production, procurement, logistics
false
Market Analysis and Trends
Transportation & Logistics transportation-and-logistics
Multiple Chart
Roland Berger
View slide
The slide features bar charts showing risks and opportunities percentages. Text boxes detail risks and opportunities, and a summary box highlights key takeaways.
Market Analysis and Trends
Healthcare & Pharmaceuticals
It shows survey results indicating a high need for repositioning in chemicals and pharma functions due to digitalization, focusing on sales, R&D, and innovation.
Digitalization, chemicals, pharma, risks, opportunities, sales, R&D, innovation
false
Market Analysis and Trends
Healthcare & Pharmaceuticals healthcare-and-pharmaceuticals
Multiple Chart
Roland Berger
View slide
The slide features bar charts showing risks and opportunities percentages. Text boxes detail risks and opportunities, and a summary box highlights key takeaways.
Market Analysis and Trends
Retail & E-commerce
It presents survey results indicating a high need for repositioning in consumer goods and retail functions due to digitalization, with a focus on controlling, service, and logistics.
Digitalization, consumer goods, retail, risks, opportunities, controlling, service, logistics
false
Market Analysis and Trends
Retail & E-commerce retail-and-e-commerce
Multiple Chart
Roland Berger
View slide
The slide features bar charts showing risks and opportunities percentages. Text boxes detail risks and opportunities, and a summary box highlights key takeaways.
Market Analysis and Trends
Financial Services
It shows survey results indicating a high need for repositioning in financial services functions due to digitalization, with a focus on service, procurement, and WCM.
Digitalization, financial services, risks, opportunities, service, procurement, WCM
false
Market Analysis and Trends
Financial Services financial-services
Multiple Chart
Roland Berger
View slide
The slide features bar charts showing risks and opportunities percentages. Text boxes detail risks and opportunities, and a summary box highlights key takeaways.
Market Analysis and Trends
Industrial & Manufacturing
It shows survey results indicating a need for repositioning in industrial products functions due to digitalization, with focus on controlling, procurement, and logistics.
Digitalization, industrial products, risks, opportunities, controlling, procurement, logistics
false
Market Analysis and Trends
Industrial & Manufacturing industrial-and-manufacturing
Multiple Chart
Roland Berger
View slide
The slide features bar charts showing risks and opportunities percentages. Text boxes detail risks and opportunities, and a summary box highlights key takeaways.
Market Analysis and Trends
Industrial & Manufacturing
It shows survey results indicating a lower perceived need for repositioning in industrial services and IT functions due to digitalization, focusing on R&D and innovation.
Digitalization, industrial services, IT, risks, opportunities, R&D, innovation
false
Market Analysis and Trends
Industrial & Manufacturing industrial-and-manufacturing
Multiple Chart
Roland Berger
View slide
The slide includes a column chart assessing risks and opportunities by corporate function. There are icons for each function and highlights per industry.
Strategic Planning
Transportation & Logistics
Analyzes the risks and opportunities of digitalization across various corporate functions, with a focus on logistics and finance sectors leveraging new technologies.
Digitalization, logistics, finance, opportunities, risks, strategic planning
false
Strategic Planning
Transportation & Logistics transportation-and-logistics
Table
Roland Berger
View slide
The slide features bar charts showing risks and opportunities percentages. Text boxes detail risks and opportunities, and a summary box highlights key takeaways.
Market Analysis and Trends
Technology & Software
It shows the survey results on digitalization risks and opportunities, emphasizing the need for corporate functions to reposition to exploit new technologies as enablers.
Digitalization, risks, opportunities, survey, functions, technology, enablers
false
Market Analysis and Trends
Technology & Software technology-and-software
Multiple Chart
Roland Berger
View slide
The slide features a colorful index grid titled 'MGI Sector Digitization Index' comparing various sectors in terms of digital assets, usage, and labor. Accompanying the grid is a legend explaining the degree of digitization.
Market Analysis and Trends
Technology & Software
The slide provides an analysis of digitization levels across different sectors using an index that evaluates digital assets, usage, and labor. Each sector is color-coded to indicate its relative degree of digitization. This serves as a strategic tool to understand where digitization is most advanced and where there is potential for growth, aiding in decision-making for digital transformation initiatives.
Digitization Index, Sectors, Assets, Usage, Labor, ICT, Media, Finance, Manufacturing, Services, B2B, Technology Adoption
false
Market Analysis and Trends
Technology & Software technology-and-software
Mixed Chart
McKinsey
View slide
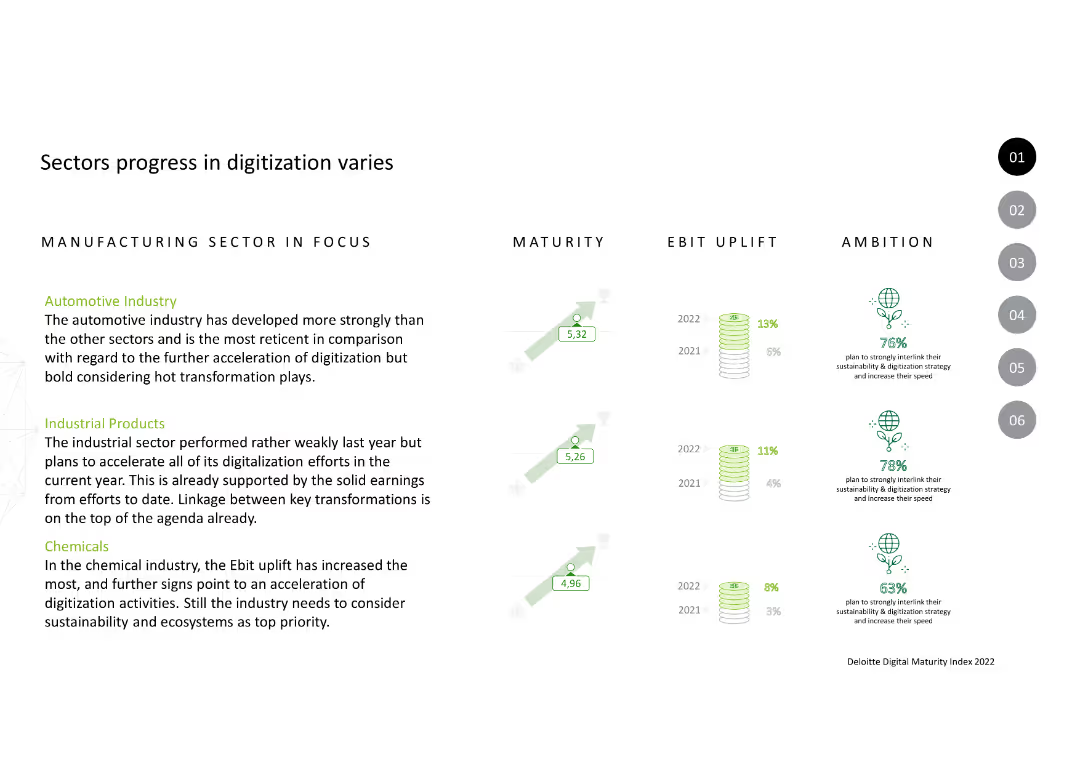
The slide compares three sectors: Automotive, Industrial Products, and Chemicals. It includes text descriptions, maturity ratings, EBIT uplift percentages, and ambition icons for each sector.
Market Analysis and Trends
Industrial & Manufacturing
The slide details how different sectors are progressing in digitization, focusing on maturity, EBIT uplift, and sustainability ambitions.
Digitization, Maturity, EBIT, Automotive, Industrial, Chemicals, Sustainability, Transformation
false
Market Analysis and Trends
Industrial & Manufacturing industrial-and-manufacturing
Multiple Chart
Deloitte
View slide
Graphs, data matrix, and a strong purple and white color theme.
Strategic Planning
Technology & Software
The slide emphasizes the executive focus on digitizing supply chains for transforming business models. It shows a prioritization matrix with different digital transformation aspects rated on importance. Ideal for discussing strategic planning and digital transformation initiatives in the technology industry, where the priority is to enhance supply chain operations through digital advancements.
Digitization, Supply Chain, C-Suite, Transformation, Business Models, Technology, Strategic Planning, Digital Advancements, Operations, Priority
false
Strategic Planning
Technology & Software technology-and-software
Table
Accenture
View slide
This slide contains a large pie chart showing the percentage of the US economy impacted by digitization, with a list of examples to its right. Additionally, there is a series of stacked horizontal bars representing different categories of digital engagement, with percentages next to each bar.
Industry Overview
Technology & Software
This slide illustrates the vast impact of digitization on the US economy, denoting that a significant majority is affected. Accompanying examples provide context for various sectors within the economy. The horizontal bar graph categorizes different aspects of digital engagement by percentage, from retail e-commerce to high-speed internet access, emphasizing the pervasive nature of digitization.
Digitization, US Economy, Digital Engagement, E-commerce, ICT Investment, Smartphones, Streaming Services, Technology Adoption
false
Industry Overview
Technology & Software technology-and-software
Multiple Chart
McKinsey
View slide
The slide features a column chart illustrating the ratio of direct to distributed traffic based on an alternative approach, considering outlet homepages within the last 5 steps and excluding subsequent visits. Detailed annotations included.
Market Analysis and Trends
Media & Entertainment
This slide presents an alternative approach to analyzing the ratio of direct to distributed traffic, focusing on outlet homepages within the last 5 steps before reaching news articles and excluding subsequent visits, highlighting traffic patterns.
Direct Traffic, Distributed Traffic, Alternative Approach, Column Chart, Traffic Ratio
false
Market Analysis and Trends
Media & Entertainment media-and-entertainment
Single Chart
IPSOS
View slide
The slide features a column chart comparing the ratio of direct to distributed traffic for various news article webpages. It includes detailed annotations explaining the variations in traffic ratios among different news outlets.
Market Analysis and Trends
Media & Entertainment
This slide analyzes the ratio of direct to distributed traffic to news article webpages, highlighting the variations among different news outlets and providing insights into traffic patterns and sources.
Direct Traffic, Distributed Traffic, News Articles, Column Chart, Traffic Ratio
false
Market Analysis and Trends
Media & Entertainment media-and-entertainment
Mixed Chart
IPSOS
View slide
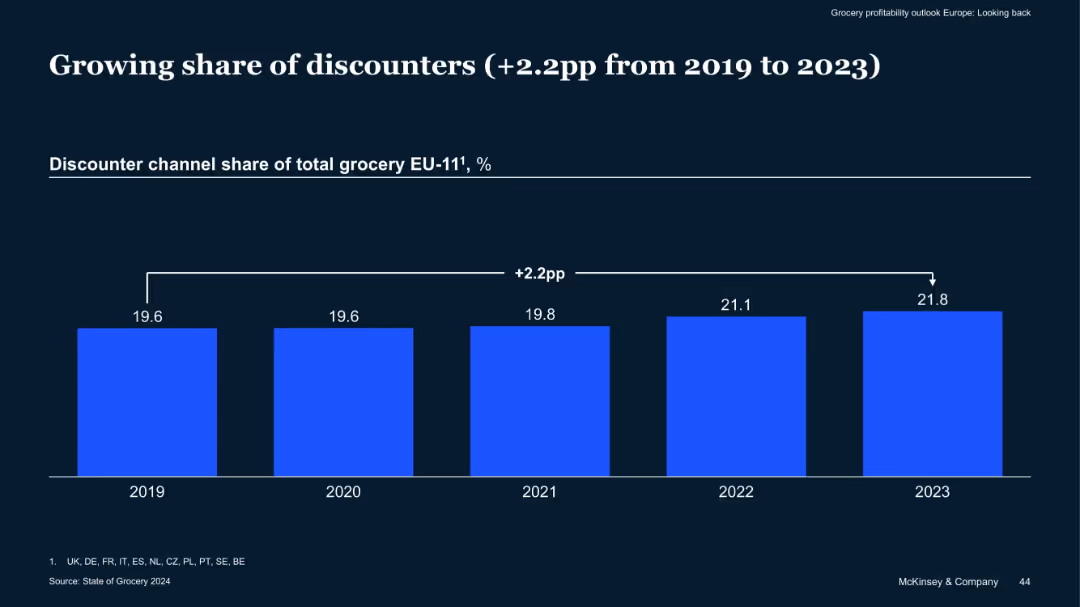
Single bar chart comparing discounter channel share of grocery sales from 2019–2023
Market Analysis and Trends
Retail & E-commerce
Discounter grocery channels have increased their share by 2.2 percentage points across EU-11 countries from 2019 to 2023, suggesting a shift in consumer preference towards cost-saving formats in a high-inflation environment.
Discounters, Grocery Share, EU Market, Cost-Sensitive Shoppers, Trends
false
Market Analysis and Trends
Retail & E-commerce retail-and-e-commerce
Single Chart
McKinsey
View slide
A slide with detailed text analysis on the left and a pie chart on the right illustrating the preferred online discovery channels for consumers.
Market Analysis and Trends
Retail & E-commerce
Analyzes the preferred online channels for product discovery, indicating a high preference for social media and video content as sources for finding new products and making purchasing decisions.
Discovery commerce, social media, video content, consumer preferences, pie chart
false
Market Analysis and Trends
Retail & E-commerce retail-and-e-commerce
Single Chart
Bain
View slide
The slide features a process flow diagram showing current and future states of call center operations. It has a balanced mix of text and visual elements, with clear depiction of process changes.
Operational Efficiency
Professional Services
Slide features a flowchart comparing current and future call center processes, along with text explaining potential improvements.
Discusses redesigning business processes within DEHS to improve efficiency, detailing current and proposed call center workflows and their expected benefits.
false
Operational Efficiency
Professional Services professional-services
Linear Flow
Alvarez & Marsal
View slide
This slide includes a content layout with an organized table, icons for different aspects (People, Process, Technology), and a timeline outline. The slide is dense with text and data.
Regulatory and Compliance
Government & Public Sector
Slide includes implementation requirements, timeline outline, and risks. Features text blocks and icons for each section.
Discusses the development of in-state ITS residential options for individuals with complex care needs, outlining necessary steps and potential risks.
false
Regulatory and Compliance
Government & Public Sector government-and-public-sector
Table
Alvarez & Marsal
Previous
Loading...
Hold On!
We are searching in our database
If nothing, comes up, please try different filters!
Column Chart
Heatmap
Chevron
Org Chart
Infographic
Callouts
Timeline
List
Graphic
Picture
Process Flow
Diagram
Paragraph
Map
Table
Framework
Subtitle
Takeaway Box
Icon
Other Chart
Radar Chart
Waterfall Chart
Mekko Chart
Pie Chart
Scatter Plot
Line Chart
Bar chart
Bullet points
Create a FREE account to continue browsing
Receive Instant Access to 1,000+ slides from companies like McKinsey, Google, and Goldman Sachs
First Name
Last Name
Email
Password
I agree to all
Terms & Privacy Policy
Thank you! Your submission has been received!
Oops! Something went wrong while submitting the form.
Have an account?
Sign in
Upgrade to PRO to Save slides
Advanced Search and Filters
Access to 15,000+ slides
Access to Category Pages
Save/Bookmark Slides
PowerPoint Template Library
Pick a Plan
MONTHLY
$12/month
Billed every month, Cancel anytime.
YEARLY
$9/year
Billed $108 annually, Cancel anytime.
Checkout for $12/month
Checkout for $108/yr
Secured by Stripe | AES-256 bit encryption