My Account
My Slides
Search by Category
Templates
View All Templates
Download Template Slides
Leave Feedback
Login
Logout
Get Started
Browse all Slides
Browse all Slides
Create a FREE Account
Instant access to 1,000+ real slides from top companies like McKinsey, BCG, Goldman Sachs, Google and many more!
First Name
Last Name
Email
Password
I agree to all
Terms & Privacy Policy
Thank you! Your submission has been received!
Oops! Something went wrong while submitting the form.
Have an account?
Sign in
Spark Your Next Big Idea with New Presentation Templates
VIEW ALL Templates
Welcome,
Welcome
PRO
Show Featured Only
Checkbox 8
Companies
Mckinsey
Bain
BCG
EY
Deloitte
Accenture
PwC/Strategy&
JP Morgan
Goldman Sachs
Morgan Stanley
Citigroup
Deutsche Bank
Barclays
LEK
KPMG
Kearney
Oliver Wyman
Booz Allen Hamilton
Gartner
IPSOS
Nielsen
Slide type
Text Only
Linear Flow
Vertical Flow
Single Chart
Header Horizontal
Mixed Chart
Header Vertical
Pillar
Multiple Chart
Graphic
Agenda
Title
Table
Framework
Industry
Technology & Software
Artificial Intelligence
Financial Services
Retail & E-commerce
Consumer Goods
Industrial & Manufacturing
Transportation & Logistics
Telecommunications
Real Estate & Construction
Hospitality & Tourism
Professional Services
Education & Training
Media & Entertainment
Agriculture & Food Production
Healthcare & Pharmaceuticals
Environmental Services & Sustainability
Government & Public Sector
Use Case
Mergers and Acquisitions
Performance Metrics and KPIs
Client Case Studies
Competitive Landscape
Corporate Finance and Valuation
Product and Service Analysis
Customer and Market Segmentation
Organizational Structure and Change
Industry Overview
Regulatory and Compliance
Risk Assessment and Management
Investment Analysis
Organizational Structure and Change
Human Resources and Talent Management
Financial Performance
Market Analysis and Trends
Sales and Business Development
Human Resources and Talent Management
Clear all
Thank you! Your submission has been received!
Oops! Something went wrong while submitting the form.
Tag
View slide
Financial analysis of connectivity models by region
Strategic Planning
Telecommunications
Bar graphs showing the financial performance of different connectivity funding models for an average school in various regions. The graphs use red and blue to highlight costs and gaps clearly, presenting a direct visual comparison of each model's financial feasibility.
Discusses the financial implications of various connectivity funding models for schools in Kalimantan, Sulawesi, Nusa Tenggara, and Papua, highlighting the differences in potential financial outcomes.
false
Strategic Planning
Telecommunications telecommunications
Multiple Chart
BCG
View slide
Includes a column chart for ASEAN-6 y/y CPI (2023-2025F), a line chart for unemployment and real earnings growth rate (2016-2025F), and a bar chart for total trade.
Market Analysis and Trends
Financial Services
Analyzes disinflation trends in ASEAN, economic risks, and central bank policies. Discusses inflation, earnings growth, and trade outlook.
Disinflation, ASEAN, CPI, Trade, Earnings
false
Market Analysis and Trends
Financial Services financial-services
Multiple Chart
EY
View slide
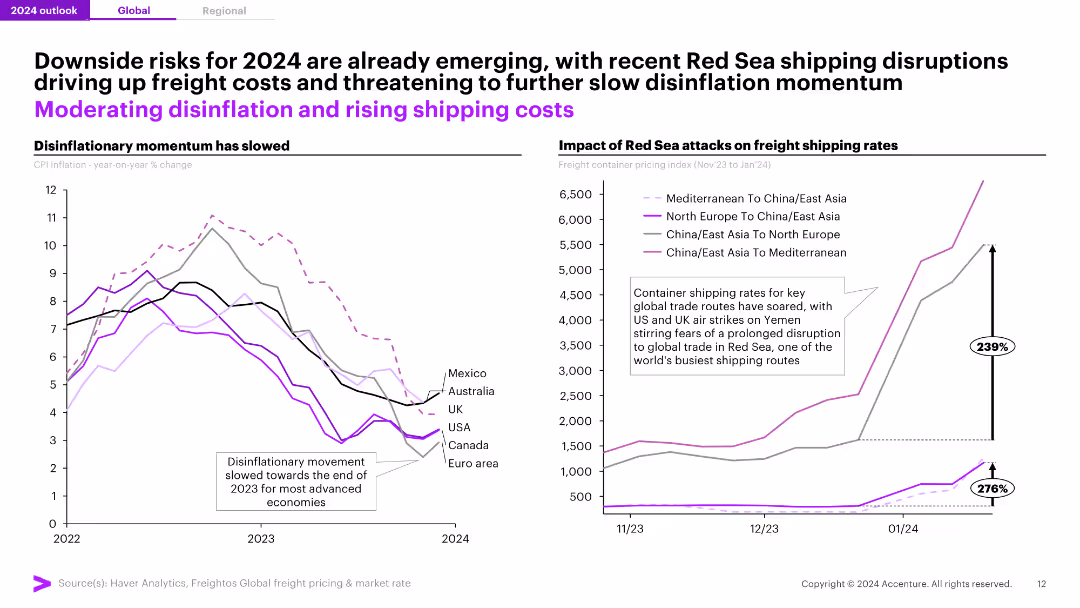
Two line charts: one showing the slowing disinflationary momentum for CPI inflation across key economies, and the other depicting the impact of Red Sea attacks on freight shipping rates, with significant increases in rates.
Risk Assessment and Management
Transportation & Logistics
The slide discusses emerging risks for 2024, including shipping disruptions in the Red Sea affecting global trade routes and increasing freight costs, along with the slowing disinflationary momentum in key economies.
Disinflation, Shipping, Freight, Risks, 2024
false
Risk Assessment and Management
Transportation & Logistics transportation-and-logistics
Multiple Chart
Accenture
View slide
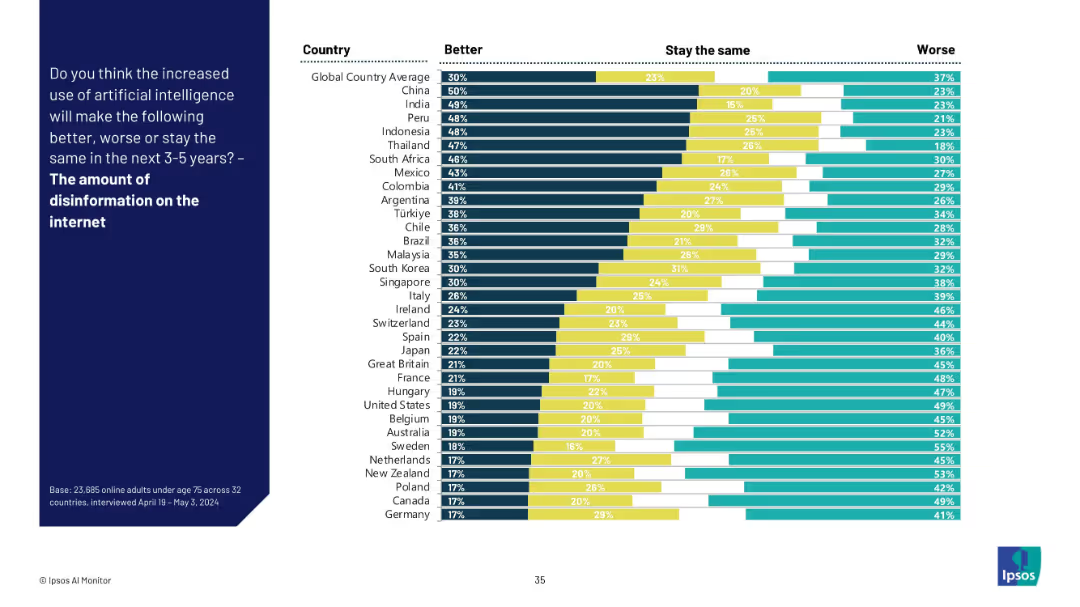
Stacked bar chart with three response categories for each country about AI’s role in internet disinformation.
Risk Assessment and Management
Artificial Intelligence
This slide explores global sentiment about AI’s effect on internet disinformation. While some countries believe AI can help reduce it, many believe it will worsen the problem, especially in Europe and North America.
Disinformation, AI ethics, internet, trust issues, information quality, public perception, AI governance, misinformation risk
false
Risk Assessment and Management
Artificial Intelligence artificial-intelligence
Mixed Chart
IPSOS
View slide
Utilizes icons and text to illustrate the potential disruptions in various industries due to advanced connectivity.
Market Analysis and Trends
Telecommunications
Outlines the potential impact of connectivity advancements across several key industries.
Disruption, Connectivity, Automotive, Healthcare, Aerospace, Defense, Retail
false
Market Analysis and Trends
Telecommunications telecommunications
Header Vertical
McKinsey
View slide
Slide features three overlapping circles in blue, green, and grey, labeled Work, People, and Technology. Within the intersection of all three is a central question about harnessing insights for performance.
Risk Assessment and Management
Technology & Software
Discusses the interplay between work, people, and technology, and how to harness insights to drive performance. Ideal for discussions on managing disruption and leveraging insights in business.
Disruption, Insights, Performance, Technology
false
Risk Assessment and Management
Technology & Software technology-and-software
Diagram
Deloitte
View slide
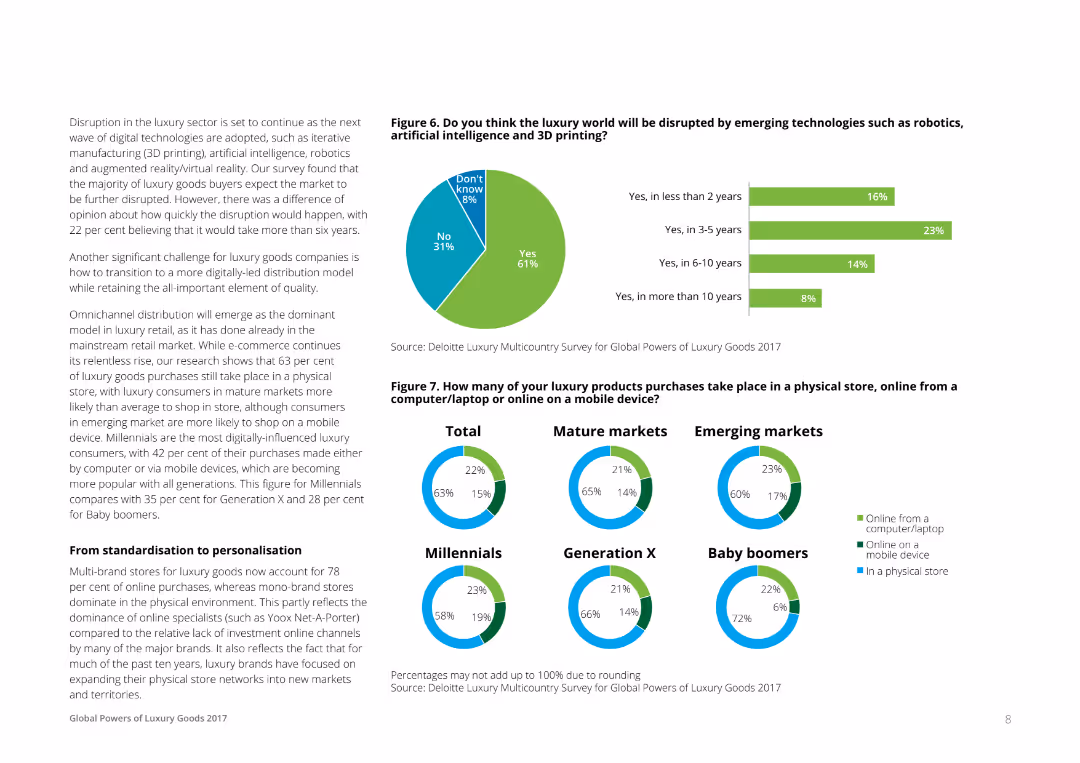
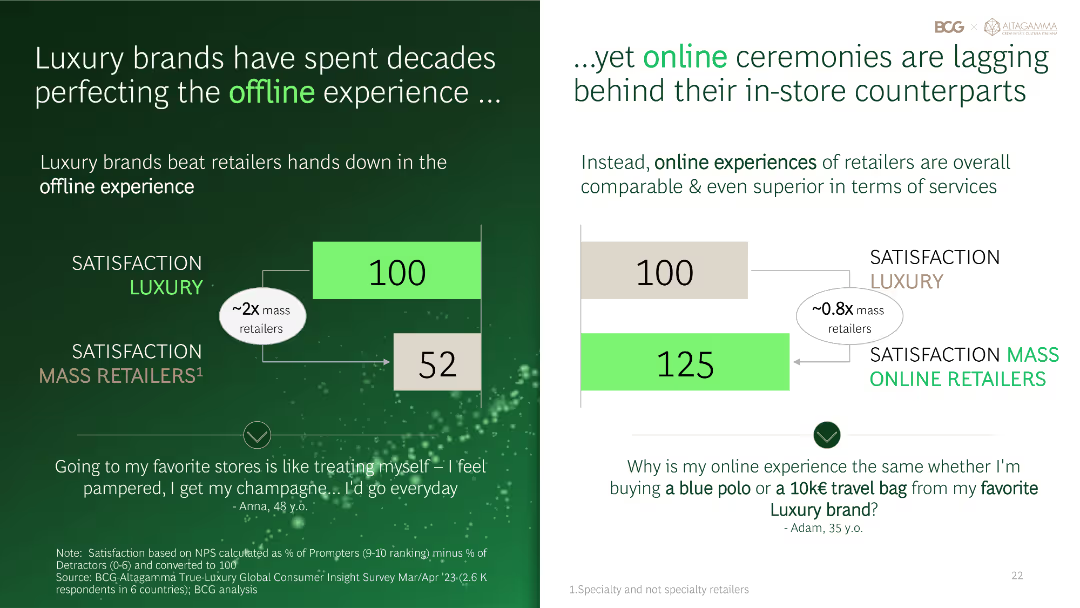
Text on the left discussing disruption, with a pie chart on the right showing opinions on how soon the luxury market will be disrupted by technologies like AI and 3D printing. Another set of pie charts show where luxury purchases are made (store, online).
Market Analysis and Trends
Consumer Goods
This slide addresses the anticipated disruption in the luxury sector due to emerging technologies and the shift towards digital and omnichannel distribution models. It includes survey data on consumer opinions and shopping behaviors.
Disruption, Technology, Luxury, Market, Trends
false
Market Analysis and Trends
Consumer Goods consumer-goods
Multiple Chart
Deloitte
View slide
Utilizes a scatter plot and bar graph to discuss types and frequencies of business disruptions.
Risk Assessment and Management
Industrial & Manufacturing
Analyzes different types of business disruptions and their predictability, offering a framework for understanding the likelihood and impact of various events like pandemics and cyber attacks.
Disruptions, Business, Framework, Predictability, Impact
false
Risk Assessment and Management
Industrial & Manufacturing industrial-and-manufacturing
Multiple Chart
McKinsey
View slide
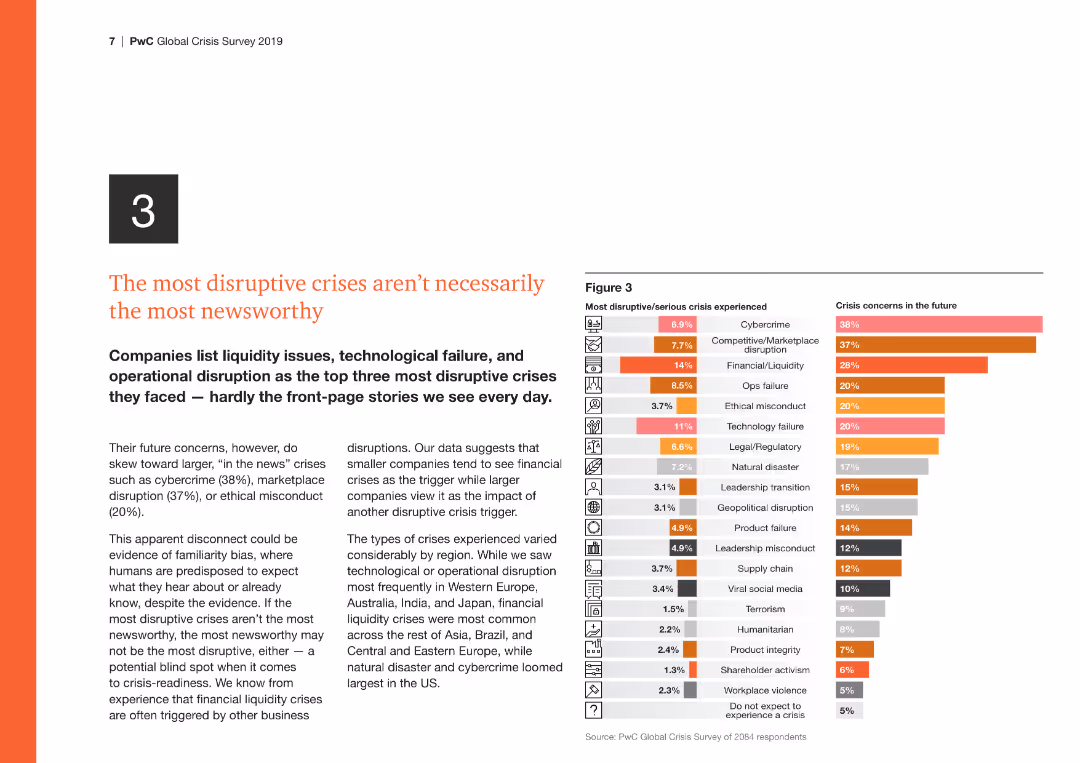
The slide features a column chart on the right comparing the most disruptive/serious crises experienced with future crisis concerns, highlighting cybercrime and financial issues.
Risk Assessment and Management
Financial Services
This slide discusses the disconnect between the most disruptive crises and those most reported, emphasizing the need for attention to operational and tech disruptions.
Disruptive crises, cybercrime, financial, operational, future concerns
false
Risk Assessment and Management
Financial Services financial-services
Multiple Chart
PwC/Strategy&
View slide
Features a central triangle with each vertex labeled with a question about work, worker, or workplace. It shows the contrast between future and current work options through a graphical element representing a spectrum.
Strategic Planning
Technology & Software
Examines the disruptors in the future of work, focusing on who can do the work, where, and how. This slide is beneficial for strategic planning regarding workforce evolution.
Disruptors, Future of Work, Strategy, Workforce
false
Strategic Planning
Technology & Software technology-and-software
Diagram
Deloitte
View slide
Column chart displaying dissatisfaction levels across different demographics and product categories, with notable dissatisfaction in online experiences.
Market Analysis and Trends
Consumer Goods
Highlights dissatisfaction with online experiences among various demographics and product categories, emphasizing the digital gap in consumer satisfaction.
Dissatisfaction, digital, demographics, product, analysis
false
Market Analysis and Trends
Consumer Goods consumer-goods
Multiple Chart
BCG
View slide
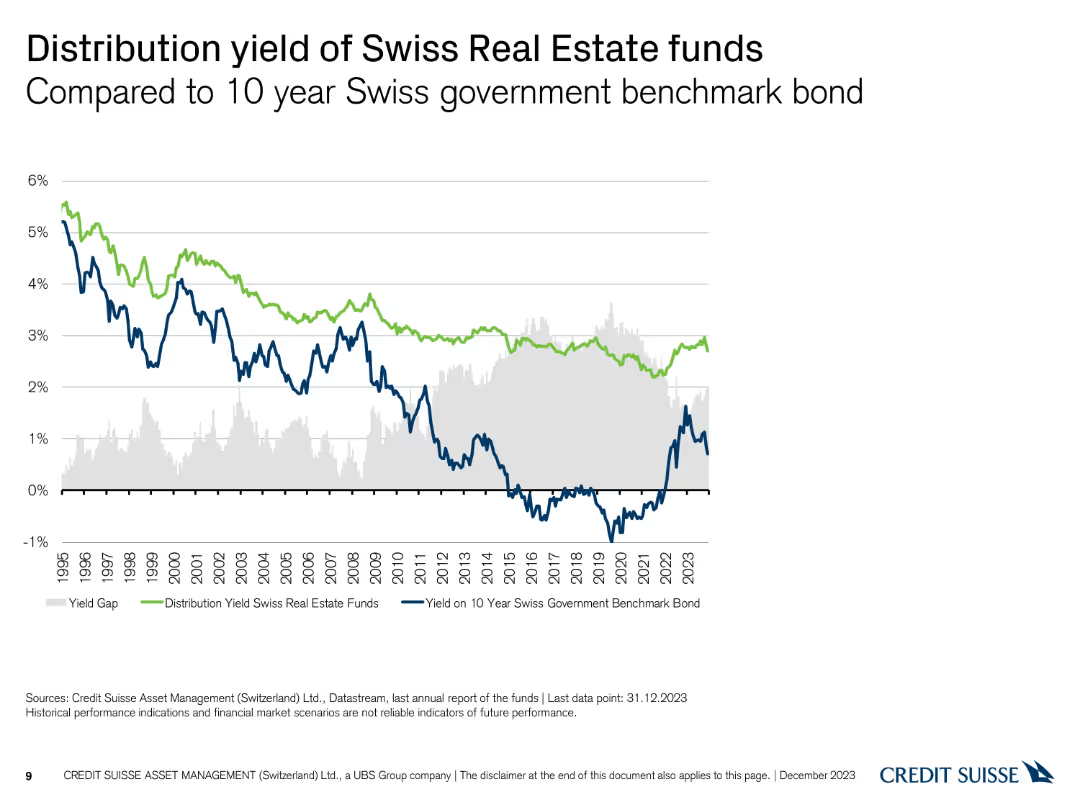
A line chart comparing the distribution yield of Swiss real estate funds to the 10-year Swiss government benchmark bond yield, with a highlighted yield gap.
Financial Performance
Financial Services
This slide analyzes the distribution yield of Swiss real estate funds in comparison to the 10-year Swiss government benchmark bond, highlighting the yield gap over time.
Distribution Yield, Government Bond, Yield Gap, Comparison
false
Financial Performance
Financial Services financial-services
Single Chart
Credit Suisse
View slide
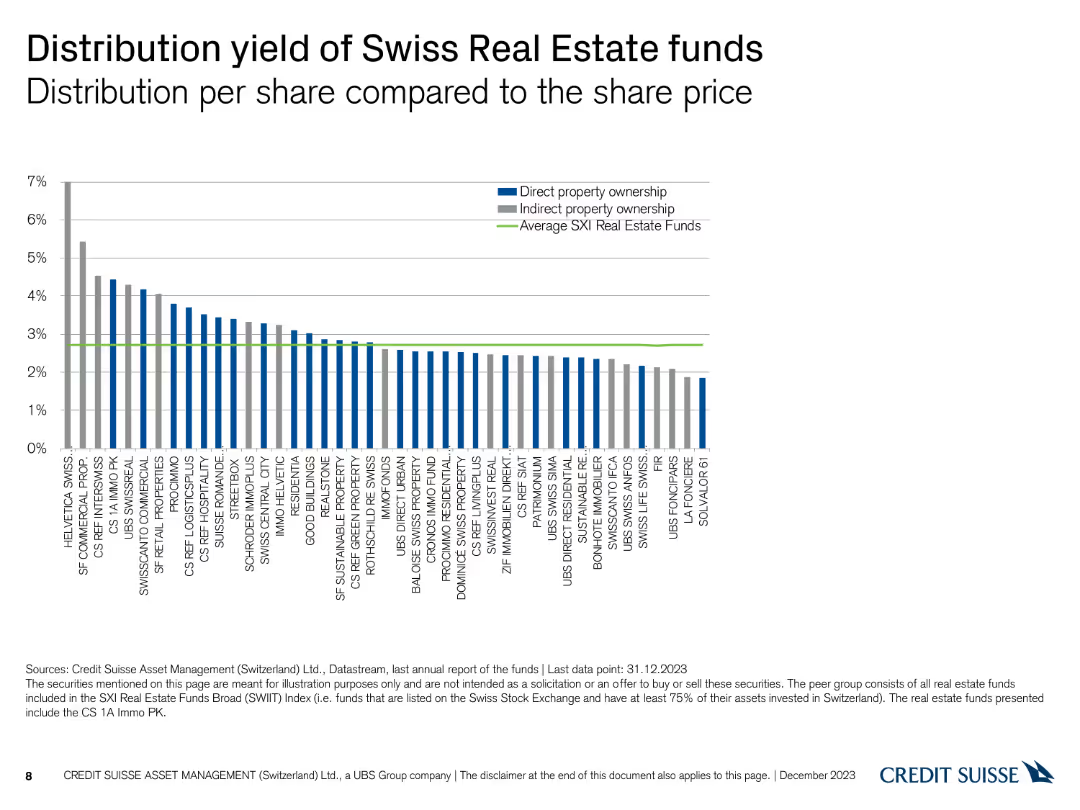
A column chart comparing the distribution yield per share for various Swiss real estate funds, with average yields highlighted.
Financial Performance
Financial Services
This slide compares the distribution yields of Swiss real estate funds, presenting data on direct and indirect property ownership against the average SXI real estate funds.
Distribution Yield, Real Estate Funds, Ownership, Yields
false
Financial Performance
Financial Services financial-services
Single Chart
Credit Suisse
View slide
A bullet point list of key summaries with a gray and blue color scheme and dollar symbol graphic.
Strategic Planning
Financial Services
Summarizes the potential of US distribution and maintenance markets, fragmentation, and value-added services.
Distribution, MRO, Fragmentation, Value, Margins, Financial Summary
false
Strategic Planning
Financial Services financial-services
Agenda
EY
View slide
The slide shows a complex layout with multiple circular diagrams and infographics on business diversification and global presence.
Market Analysis and Trends
Financial Services
Designed to demonstrate the company's diversification across regions, staff distribution, and business mix over time. Suited for presenting to investors or during annual meetings.
Diversification, Global Presence, Annuity, Business Mix, Staff Distribution
false
Market Analysis and Trends
Financial Services financial-services
Multiple Chart
Morgan Stanley
View slide
Slide includes pie charts and detailed lists comparing product types and their market share over time.
Financial Performance
Financial Services
Discusses the diversification of financial products over years, analyzing risk-adjusted returns and market growth strategies.
Diversification, Products, Growth, Financial
false
Financial Performance
Financial Services financial-services
Multiple Chart
Barclays
View slide
This slide includes a blue pie chart detailing net revenue mix, with comparative financial performance data from two consecutive years on a light background.
Financial Performance
Financial Services
Discusses the revenue growth and improvements in key financial metrics over the years, demonstrating the advantages of a diversified franchise.
Diversification, Revenue, Performance, Metrics, Growth, Financial, Franchise
false
Financial Performance
Financial Services financial-services
Mixed Chart
Goldman Sachs
View slide
Three donut charts showing diversification by source, remaining maturity, and currency, providing a detailed breakdown of the funding structure.
Financial Performance
Financial Services
Detailed view of UBS's long-term wholesale funding diversification across different sources, maturities, and currencies.
Diversification, funding, sources, maturity, currency
false
Financial Performance
Financial Services financial-services
Multiple Chart
UBS
View slide
The slide has moderate complexity, featuring a multi-layered column chart illustrating investment diversification across sectors, labeled with years and sectors.
Market Analysis and Trends
Financial Services
Focuses on investment diversification, showing how funds are allocated across various sectors like e-commerce, online media, and others with a year-on-year comparison.
Diversification, investment, sectors, e-commerce, online media
false
Market Analysis and Trends
Financial Services financial-services
Single Chart
Bain
View slide
Includes various column charts, textual analysis, and quantitative data showcasing business diversity.
Risk Assessment and Management
Financial Services
Discusses the benefits of diversification across businesses and client geographies in challenging environments.
Diversification, mortgage trading, client geographies, business resilience, economic challenges
false
Risk Assessment and Management
Financial Services financial-services
Multiple Chart
JP Morgan
View slide
The slide contains four colored boxes with lists, headlines in blue, and subtext. A header sentence spans the top, with a footer sentence below.
Industry Overview
Financial Services
Presents four pillars of a diversified business model, positioning for market outperformance, and foundational principles.
Diversified franchise, client franchises, principles, shareholder value, business practices
false
Industry Overview
Financial Services financial-services
Table
JP Morgan
View slide
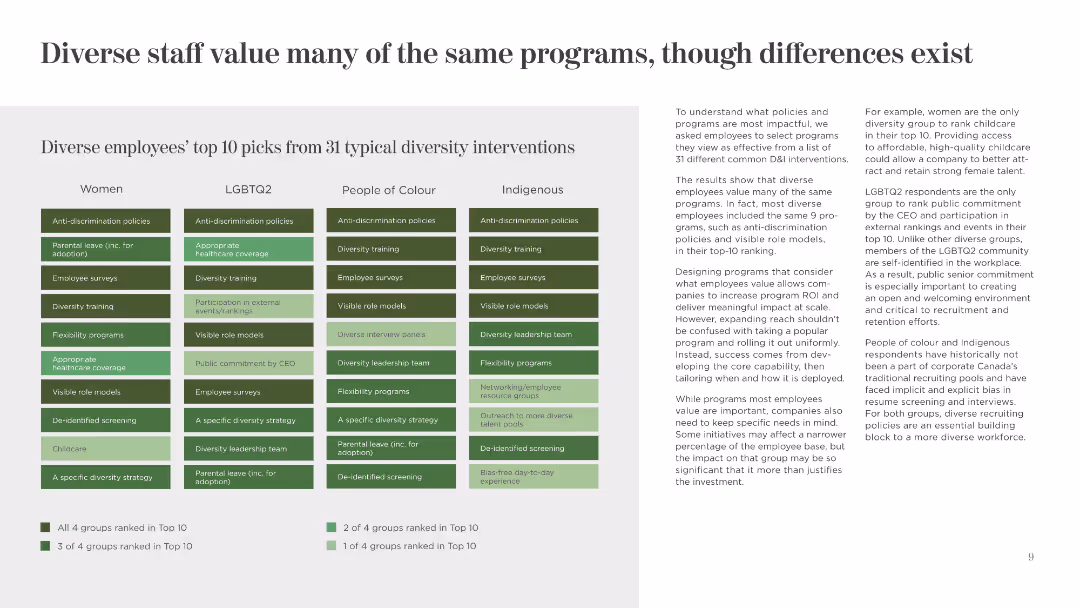
This slide uses a matrix layout to show the top 10 diversity interventions valued by different groups. It uses shades of green and clear headers to distinguish between categories.
Human Resources and Talent Management
Government & Public Sector
The slide lists and compares the top diversity interventions preferred by women, LGBTQ2, people of color, and Indigenous employees, highlighting commonalities and differences.
Diversity Interventions, Value, Comparison, Women, LGBTQ2, People of Colour, Indigenous, Programs, Preferences
false
Human Resources and Talent Management
Government & Public Sector government-and-public-sector
Table
BCG
View slide
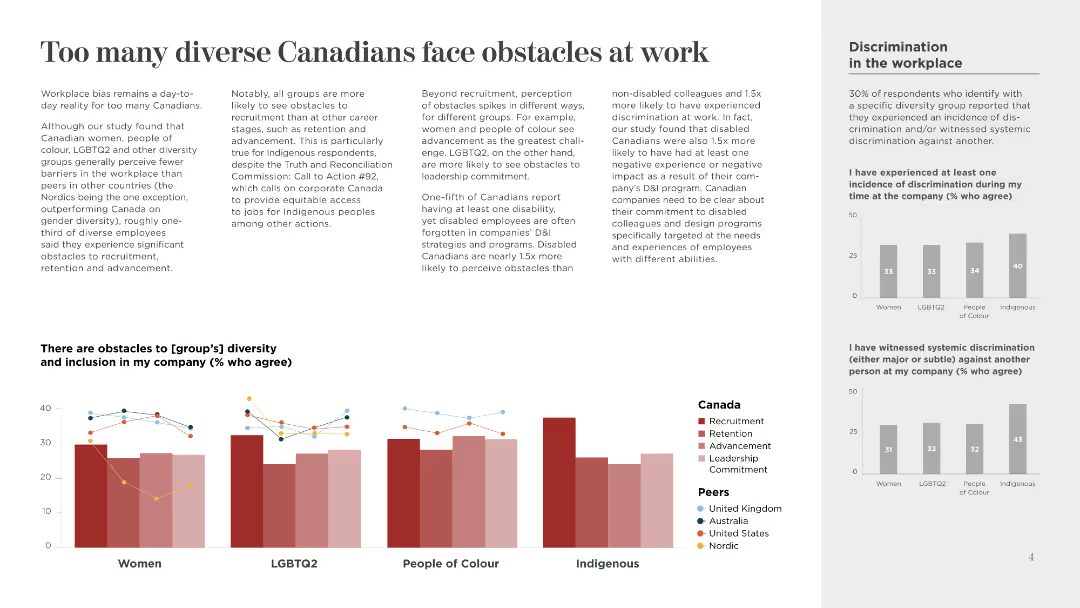
This slide features a column chart and multiple text sections. It uses a combination of light and dark text on a white background, with minimalistic icons and color-coded sections.
Human Resources and Talent Management
Government & Public Sector
The slide discusses the challenges faced by diverse groups in Canadian workplaces, highlighting recruitment, retention, and advancement obstacles. It also compares discrimination experiences.
Diversity, Discrimination, Inclusion, Workplace, Canada, Recruitment, Retention, Advancement, Leadership, Commitment
false
Human Resources and Talent Management
Government & Public Sector government-and-public-sector
Multiple Chart
BCG
View slide
The slide has a background image of a sunset over the sea, with quotes and two column charts showing council members' opinions on diversity and inclusion issues.
Regulatory and Compliance
Media & Entertainment
Addresses the challenges and expectations for companies to take a stance on diversity and inclusion issues.
Diversity, Inclusion, Compliance, Public Perception, Media
false
Regulatory and Compliance
Media & Entertainment media-and-entertainment
Mixed Chart
IPSOS
View slide
The slide uses a content layout with bullet points, an embedded image, and a bar chart. The visual design is moderately complex, including various text elements and color coding for clarity.
Organizational Structure and Change
Professional Services
This slide highlights the diversity initiatives and accomplishments within the organization, focusing on gender representation, disability inclusion, and LGBTQ+ support strategies.
Diversity, Inclusion, Gender, LGBTQ+, Strategy
false
Organizational Structure and Change
Professional Services professional-services
Mixed Chart
PwC/Strategy&
View slide
A vibrant graphic representing various diversity dimensions encircles textual explanations, flanked by images portraying diversity in the workplace.
Human Resources and Talent Management
Industrial & Manufacturing
Showcases Michelin's progress in diversity and inclusion for 2022, indicating scores and goals, reinforcing their commitment to a varied and inclusive work environment.
Diversity, Inclusion, Michelin, Work Environment, Corporate Culture, Progress, IMDI Score, Gender Balance, Equal Opportunity, Talent Development
false
Human Resources and Talent Management
Industrial & Manufacturing industrial-and-manufacturing
Framework
Morgan Stanley
View slide
Features a combination of icons and text outlining diversity and operational goals, with a clear emphasis on sustainability and inclusion within the firm's strategy.
Organizational Structure and Change
Financial Services
Describes the company's goals for improving operational efficiency and diversity, including specific targets for hiring, energy efficiency, and waste reduction, reinforcing the company's commitment to sustainable operations and an inclusive work environment.
Diversity, Operations, Sustainability, Inclusion, Energy Efficiency, Waste Reduction
false
Organizational Structure and Change
Financial Services financial-services
Table
Goldman Sachs
View slide
Slide features multiple bar charts and percentage graphics.
Market Analysis and Trends
Professional Services
Displays diversity statistics across various economic sectors by gender, ethnicity, and disability status, highlighting differences in representation in marketing roles.
Diversity, Statistics, Marketing, Economic Sectors, Representation, Gender, Ethnicity, Disability, Comparison, Bar Charts
false
Market Analysis and Trends
Professional Services professional-services
Mixed Chart
Deloitte
View slide
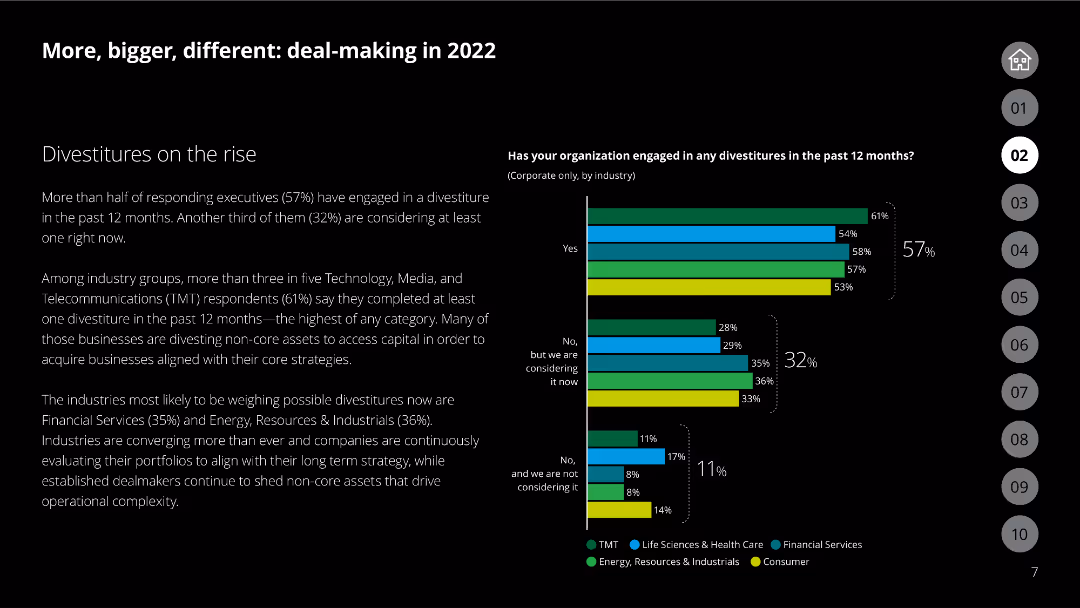
Column chart showing engagement in divestitures by industry, with categories like TMT, financial services, and energy
Mergers and Acquisitions
Financial Services
Discusses the rise in divestitures across various industries, emphasizing the strategic reasons behind these decisions.
Divestitures, industries, strategy, TMT, financial services
false
Mergers and Acquisitions
Financial Services financial-services
Mixed Chart
Deloitte
View slide
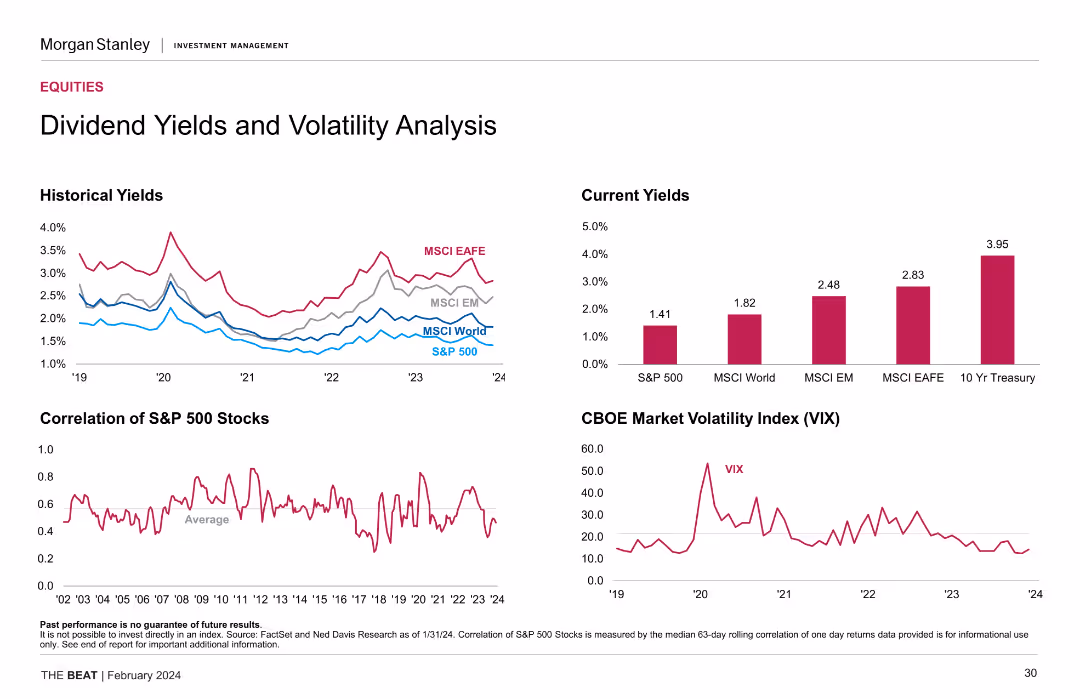
The slide features several charts: a line chart for historical yields, a bar chart for current yields, and a line chart for the CBOE Market Volatility Index.
Financial Performance
Financial Services
This slide analyzes dividend yields and volatility, comparing historical and current yields and showing the market volatility index, aiding investment decisions.
Dividend Yields, Volatility, Historical Yields, Current Yields, VIX
false
Financial Performance
Financial Services financial-services
Multiple Chart
Morgan Stanley
Previous
Loading...
Hold On!
We are searching in our database
If nothing, comes up, please try different filters!
Column Chart
Heatmap
Chevron
Org Chart
Infographic
Callouts
Timeline
List
Graphic
Picture
Process Flow
Diagram
Paragraph
Map
Table
Framework
Subtitle
Takeaway Box
Icon
Other Chart
Radar Chart
Waterfall Chart
Mekko Chart
Pie Chart
Scatter Plot
Line Chart
Bar chart
Bullet points
Create a FREE account to continue browsing
Receive Instant Access to 1,000+ slides from companies like McKinsey, Google, and Goldman Sachs
First Name
Last Name
Email
Password
I agree to all
Terms & Privacy Policy
Thank you! Your submission has been received!
Oops! Something went wrong while submitting the form.
Have an account?
Sign in
Upgrade to PRO to Save slides
Advanced Search and Filters
Access to 15,000+ slides
Access to Category Pages
Save/Bookmark Slides
PowerPoint Template Library
Pick a Plan
MONTHLY
$12/month
Billed every month, Cancel anytime.
YEARLY
$9/year
Billed $108 annually, Cancel anytime.
Checkout for $12/month
Checkout for $108/yr
Secured by Stripe | AES-256 bit encryption