My Account
My Slides
Search by Category
Templates
View All Templates
Download Template Slides
Leave Feedback
Login
Logout
Get Started
Browse all Slides
Browse all Slides
Create a FREE Account
Instant access to 1,000+ real slides from top companies like McKinsey, BCG, Goldman Sachs, Google and many more!
First Name
Last Name
Email
Password
I agree to all
Terms & Privacy Policy
Thank you! Your submission has been received!
Oops! Something went wrong while submitting the form.
Have an account?
Sign in
Spark Your Next Big Idea with New Presentation Templates
VIEW ALL Templates
Welcome,
Welcome
PRO
Show Featured Only
Checkbox 8
Companies
Mckinsey
Bain
BCG
EY
Deloitte
Accenture
PwC/Strategy&
JP Morgan
Goldman Sachs
Morgan Stanley
Citigroup
Deutsche Bank
Barclays
LEK
KPMG
Kearney
Oliver Wyman
Booz Allen Hamilton
Gartner
IPSOS
Nielsen
Slide type
Text Only
Linear Flow
Vertical Flow
Single Chart
Header Horizontal
Mixed Chart
Header Vertical
Pillar
Multiple Chart
Graphic
Agenda
Title
Table
Framework
Industry
Technology & Software
Artificial Intelligence
Financial Services
Retail & E-commerce
Consumer Goods
Industrial & Manufacturing
Transportation & Logistics
Telecommunications
Real Estate & Construction
Hospitality & Tourism
Professional Services
Education & Training
Media & Entertainment
Agriculture & Food Production
Healthcare & Pharmaceuticals
Environmental Services & Sustainability
Government & Public Sector
Use Case
Mergers and Acquisitions
Performance Metrics and KPIs
Client Case Studies
Competitive Landscape
Corporate Finance and Valuation
Product and Service Analysis
Customer and Market Segmentation
Organizational Structure and Change
Industry Overview
Regulatory and Compliance
Risk Assessment and Management
Investment Analysis
Organizational Structure and Change
Human Resources and Talent Management
Financial Performance
Market Analysis and Trends
Sales and Business Development
Human Resources and Talent Management
Clear all
Thank you! Your submission has been received!
Oops! Something went wrong while submitting the form.
Tag
View slide
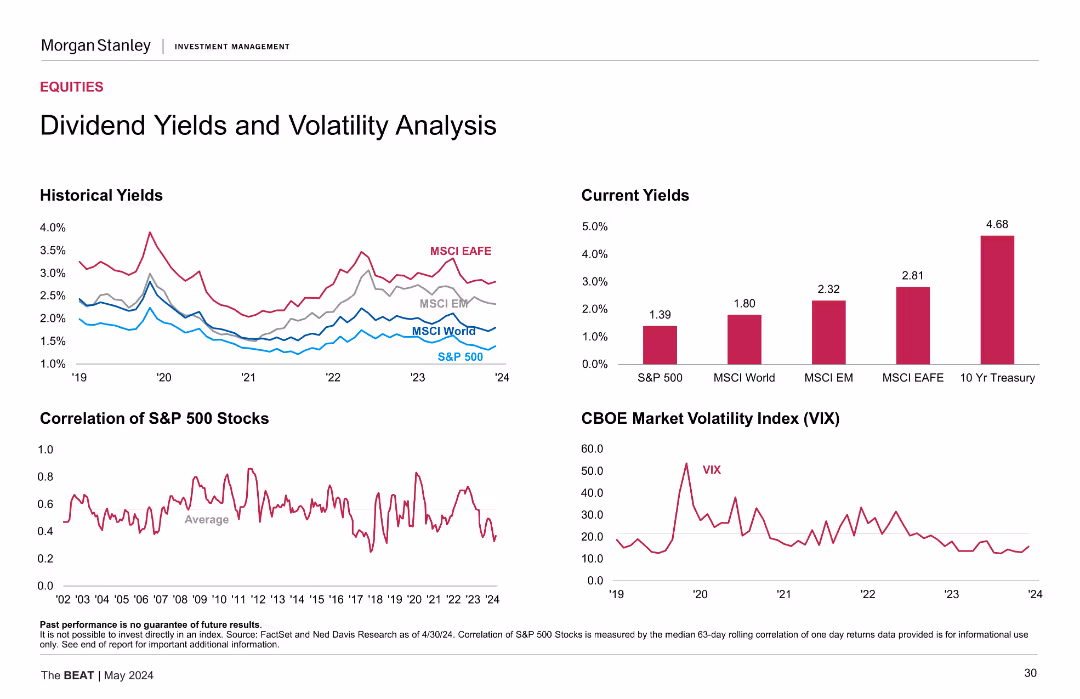
Line charts for historical yields of various indices, a bar chart for current yields, and a line chart for the CBOE Market Volatility Index (VIX).
Market Analysis and Trends
Financial Services
Analyzes dividend yields and market volatility, providing historical and current data for various indices and the VIX.
Dividend Yields, Volatility, Historical Yields, Market Analysis, VIX
false
Market Analysis and Trends
Financial Services financial-services
Multiple Chart
Morgan Stanley
View slide
The slide includes multiple line charts and a column chart. The line charts show historical yields for various indices and the correlation of S&P 500 stocks. The column chart displays current yields for S&P 500, MSCI World, MSCI EM, MSCI EAFE, and 10 Yr Treasury. The CBOE Market Volatility Index (VIX) is also plotted as a line chart.
Financial Performance
Financial Services
The slide analyzes dividend yields and market volatility, comparing historical and current yields for various indices, and the correlation of S&P 500 stocks.
Dividend yields, volatility, S&P 500, MSCI, VIX, correlation
false
Financial Performance
Financial Services financial-services
Multiple Chart
Morgan Stanley
View slide
The slide shows bar graphs comparing Booz Allen's dividend growth to peer average, alongside textual information.
Financial Performance
Financial Services
Highlights the company's quarterly dividend growth compared to peers, reflecting on Booz Allen's strong performance. Used in investment analysis or shareholder presentations.
Dividend, Growth, Comparison, Performance, Market
false
Financial Performance
Financial Services financial-services
Single Chart
Booz Allen Hamilton
View slide
A column chart showing regular and supplemental dividend history from Q2'20 to Q4'23, with corresponding dividend yields.
Financial Performance
Financial Services
This slide illustrates the dividend history of the company over several quarters, indicating the consistency and growth of dividend payouts and their yields.
Dividends, Column Chart, Financial History, Yields, Q2'20-Q4'23
false
Financial Performance
Financial Services financial-services
Mixed Chart
Morgan Stanley
View slide
Features a combination of column charts showing dividend per share over time and a bar chart representing emission intensity reductions of operations.
Financial Performance
Financial Services
It's likely intended for investors, detailing dividend trends and corporate sustainability efforts.
Dividends, Emission Intensity, Sustainability, Financial, Investments, Shareholders, Trends
false
Financial Performance
Financial Services financial-services
Multiple Chart
Goldman Sachs
View slide
Includes three line graphs for 'Historical Yields' and 'Correlation of S&P 500 Stocks', plus column chart for 'Current Yields' and a line graph for 'CBOE Market Volatility Index (VIX)'. The slide has a clear separation of sections, with color-coded elements and succinct axis labeling.
Investment Analysis
Financial Services
Targeting investors, this slide analyzes dividend yields and market volatility, contrasting historical and current data. It highlights yield trends and the correlation within the S&P 500, alongside the VIX trend, crucial for understanding market stability and potential investment risks.
Dividends, Yields, Volatility, S&P 500, VIX
false
Investment Analysis
Financial Services financial-services
Multiple Chart
Morgan Stanley
View slide
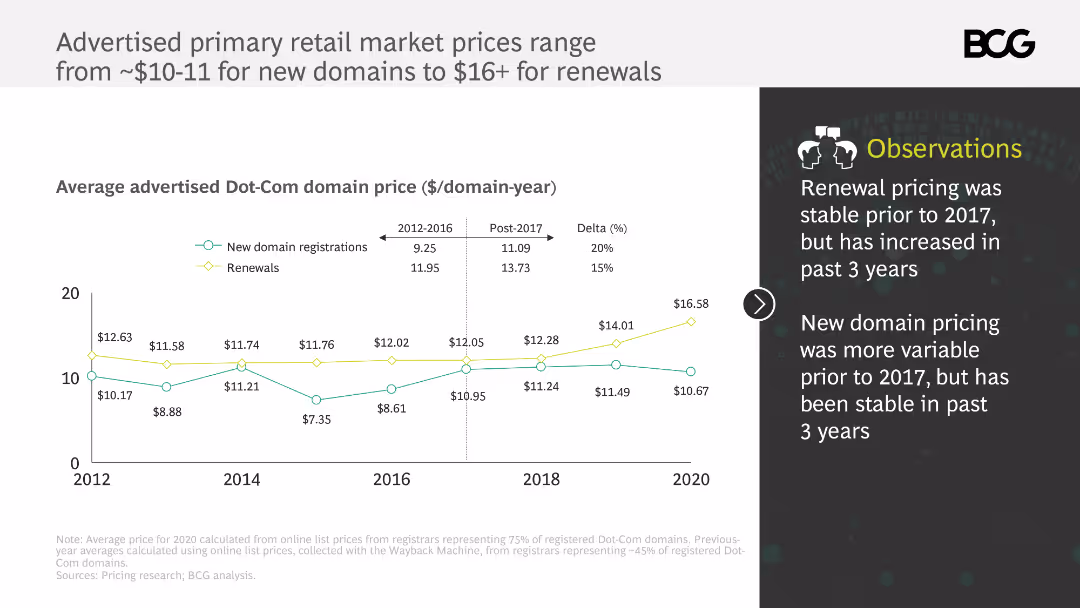
This slide includes a line chart showing the advertised primary retail market prices for Dot-Com domains from 2012 to 2020. It uses different colors to differentiate between new domain registrations and renewals, with annotations explaining price trends.
Pricing Strategies
Telecommunications
The slide analyzes the advertised primary retail market prices for Dot-Com domains, noting that renewal prices have increased since 2017 while new domain prices have remained stable. It provides insights into pricing stability and recent trends.
Dot-Com domains, pricing, renewals, new registrations, price trends
false
Pricing Strategies
Telecommunications telecommunications
Mixed Chart
BCG
View slide
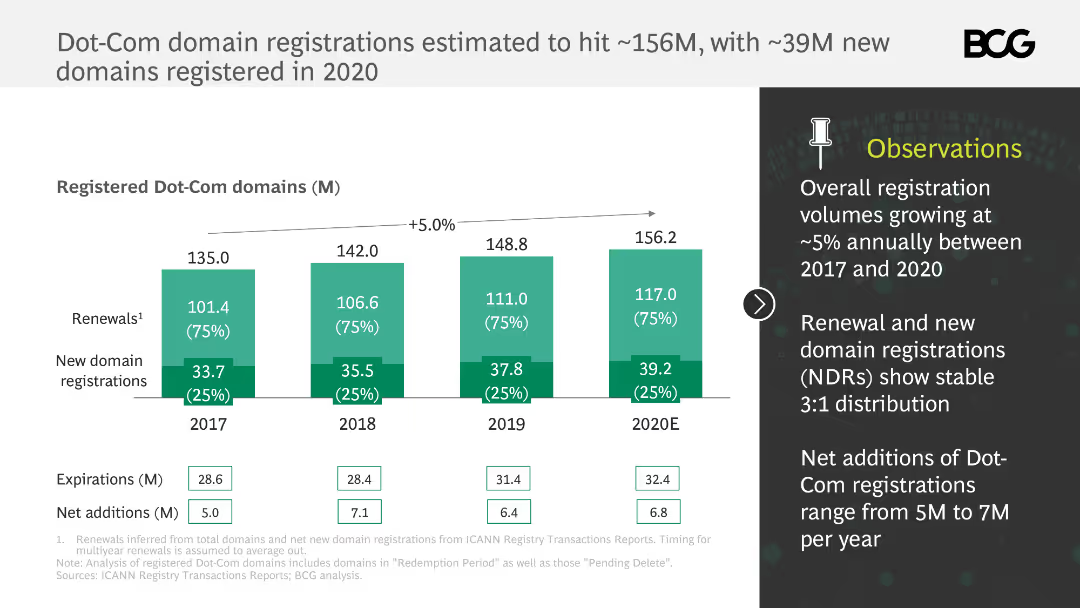
This slide features a column chart tracking the number of registered Dot-Com domains from 2017 to 2020. It uses a green color scheme and annotations to highlight key statistics, with a text box on the right summarizing observations.
Market Analysis and Trends
Telecommunications
The slide provides an overview of Dot-Com domain registrations, showing growth trends and new registrations. It highlights that renewals and new domain registrations maintain a stable 3:1 distribution, with annual net additions ranging from 5M to 7M.
Dot-Com domains, registrations, trends, growth, renewals
false
Market Analysis and Trends
Telecommunications telecommunications
Mixed Chart
BCG
View slide
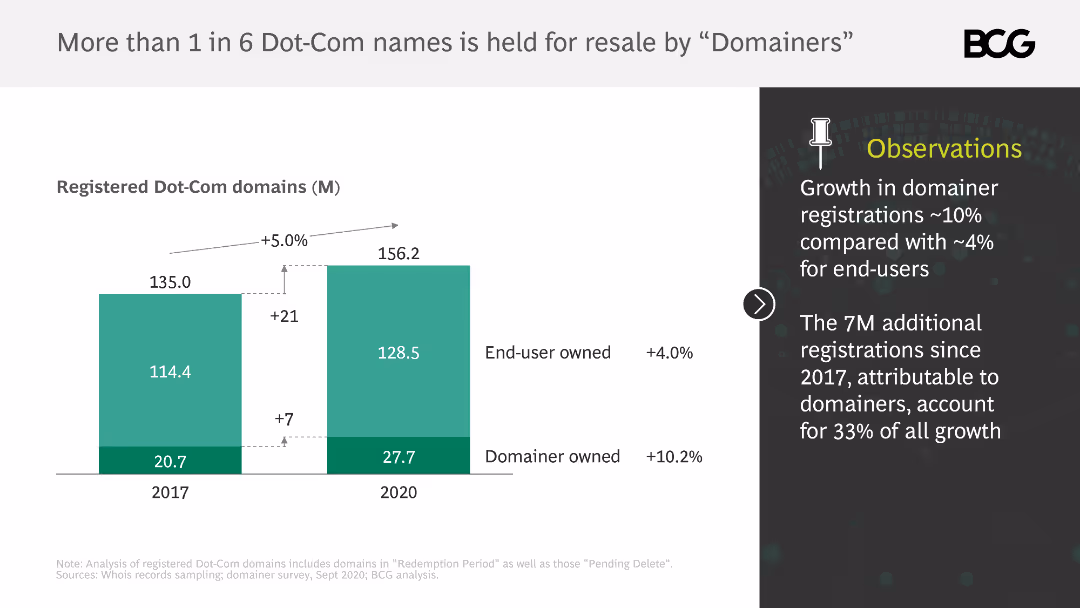
The slide includes a column chart showing the number of registered Dot-Com domains held by end-users and domainers from 2017 to 2020. Observations are listed on the right.
Market Analysis and Trends
Retail & E-commerce
It shows the growth in domainer registrations compared to end-user registrations and highlights the significant proportion of domains held for resale by domainers.
Dot-Com, domainers, resale, end-users, growth, registrations
false
Market Analysis and Trends
Retail & E-commerce retail-and-e-commerce
Mixed Chart
BCG
View slide
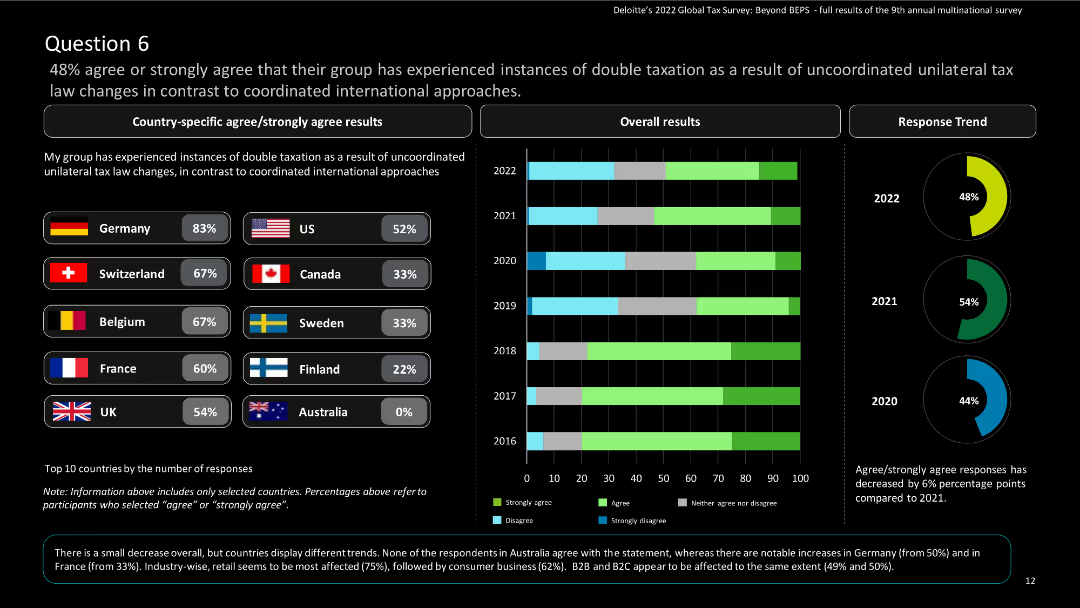
The slide features country-specific results and a column chart showing overall and response trend results over the years.
Regulatory and Compliance
Financial Services
The slide discusses instances of double taxation due to uncoordinated unilateral tax law changes.
Double taxation, tax law, uncoordinated, global tax, Deloitte, agree, strongly agree, survey, multinational
false
Regulatory and Compliance
Financial Services financial-services
Multiple Chart
Deloitte
View slide
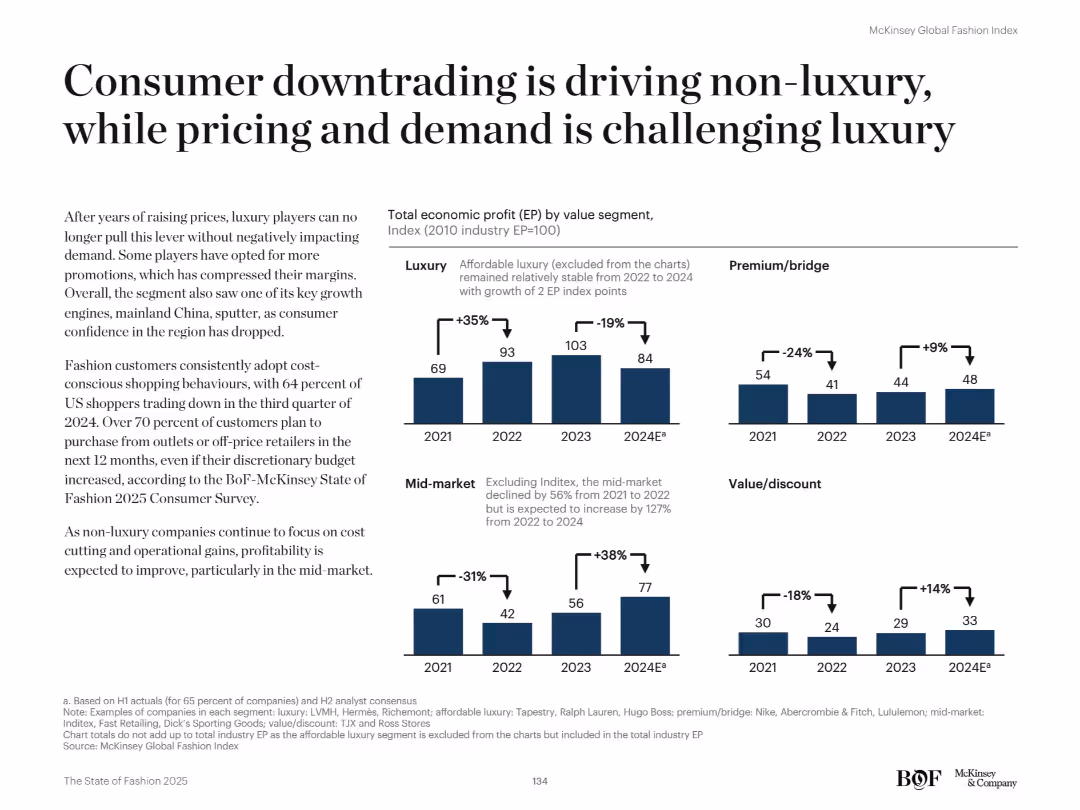
Bar charts on right compare EP by segment (Luxury, Premium, Mid-market, Value). Left-side narrative explains consumer behavior trends.
Customer and Market Segmentation
Retail & E-commerce
The slide explains how consumer downtrading is fueling growth in non-luxury segments, especially mid-market and value. Luxury struggles with demand and pricing. Shoppers are turning to outlets and off-price retailers.
Downtrading, value segment, pricing pressure, consumer behavior, EP segmentation, mid-market growth, luxury decline, affordability, retail demand
false
Customer and Market Segmentation
Retail & E-commerce retail-and-e-commerce
Mixed Chart
McKinsey
View slide
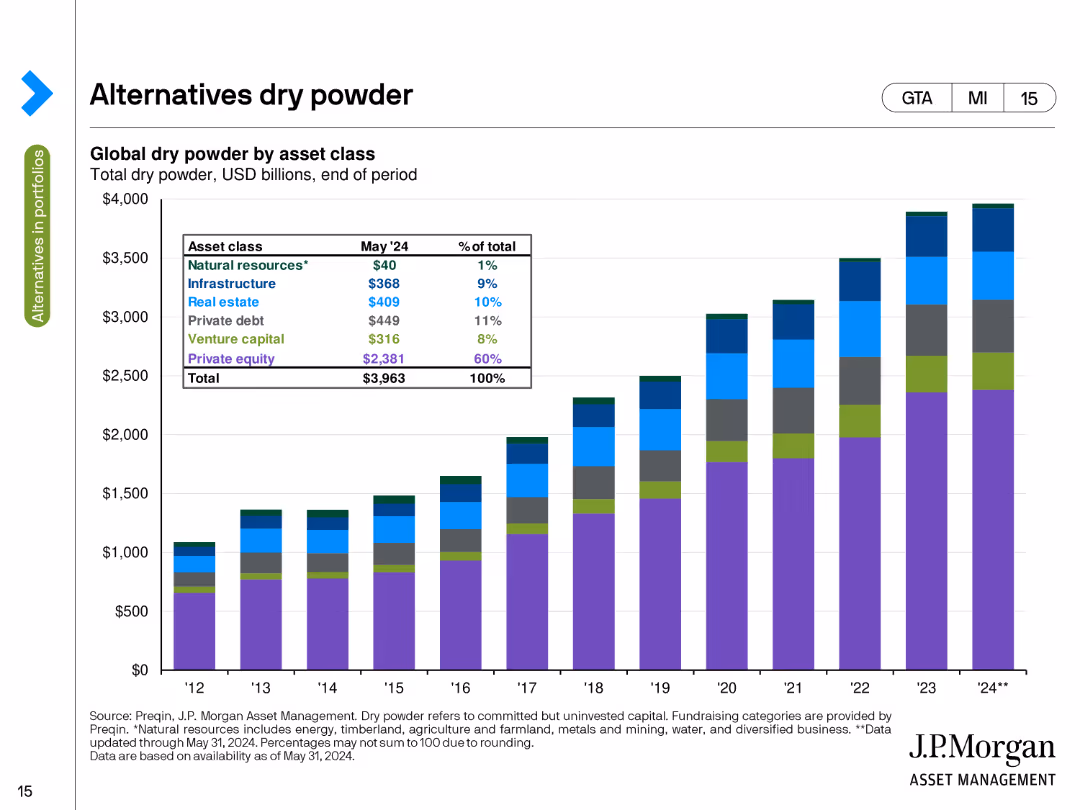
The slide presents a stacked column chart showing global dry powder by asset class in USD billions as of the end of May 2024. The chart uses different colors to depict natural resources, infrastructure, private equity, and other categories.
Investment Analysis
Financial Services
This slide details the amount of uninvested capital (dry powder) available in various asset classes, such as natural resources, infrastructure, and private equity, highlighting the total capital ready for deployment at the end of May 2024.
Dry Powder, Asset Classes, Uninvested Capital, USD Billions, Deployment
false
Investment Analysis
Financial Services financial-services
Single Chart
JP Morgan
View slide
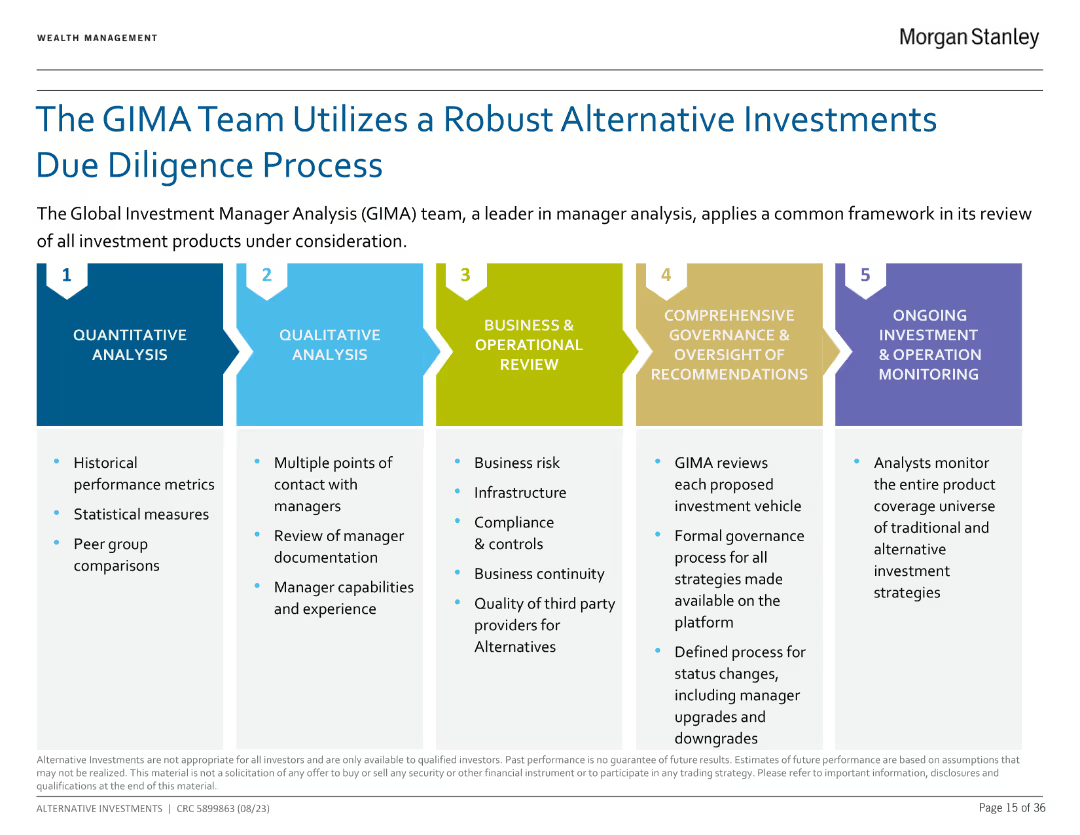
The slide lists five steps in the due diligence process using colored boxes with descriptions under each step, emphasizing the systematic approach.
Operational Efficiency
Financial Services
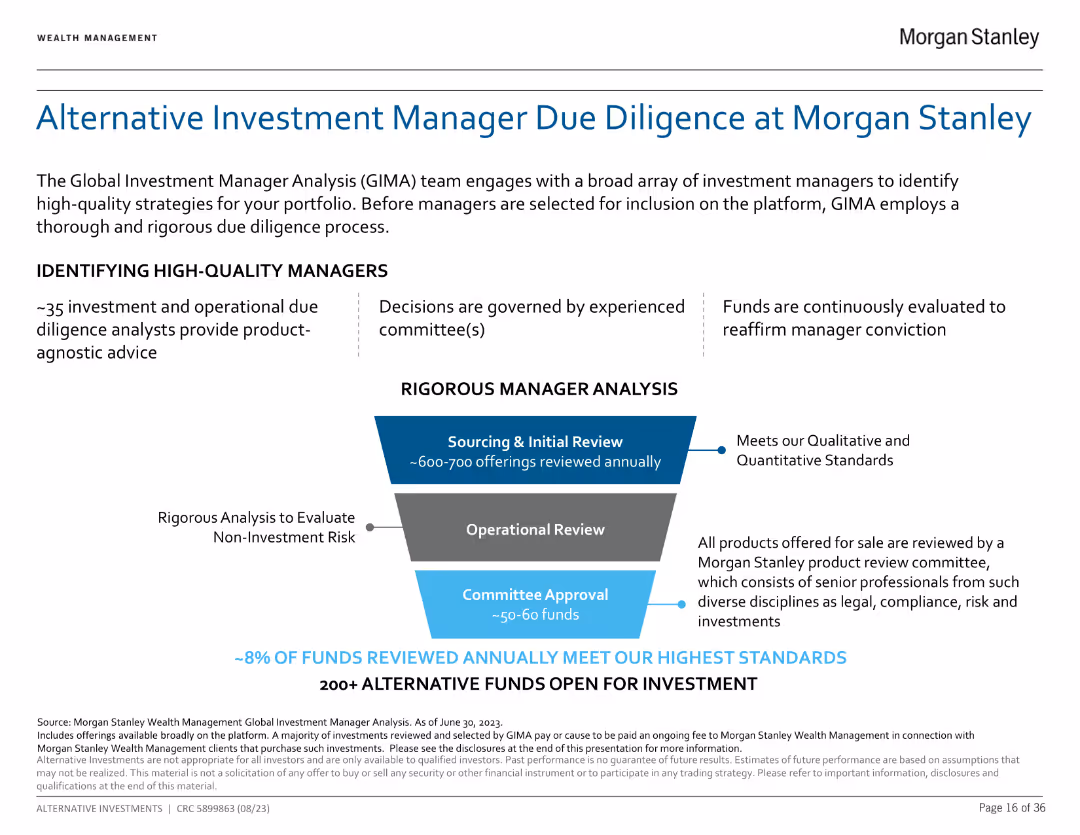
The slide outlines the five-step due diligence process used by the GIMA team: Quantitative Analysis, Qualitative Analysis, Business & Operational Review, Comprehensive Governance & Oversight, and Ongoing Investment Monitoring.
Due Diligence, GIMA, Process, Analysis, Governance
false
Operational Efficiency
Financial Services financial-services
Linear Flow
Morgan Stanley
View slide
The slide uses a flowchart to depict the due diligence process with descriptions for each step, illustrating a comprehensive review mechanism.
Risk Assessment and Management
Financial Services
The slide explains the rigorous due diligence process employed by Morgan Stanley to identify high-quality investment managers, involving sourcing, operational review, and committee approval.
Due Diligence, Morgan Stanley, Investment, Review, High-Quality
false
Risk Assessment and Management
Financial Services financial-services
Diagram
Morgan Stanley
View slide
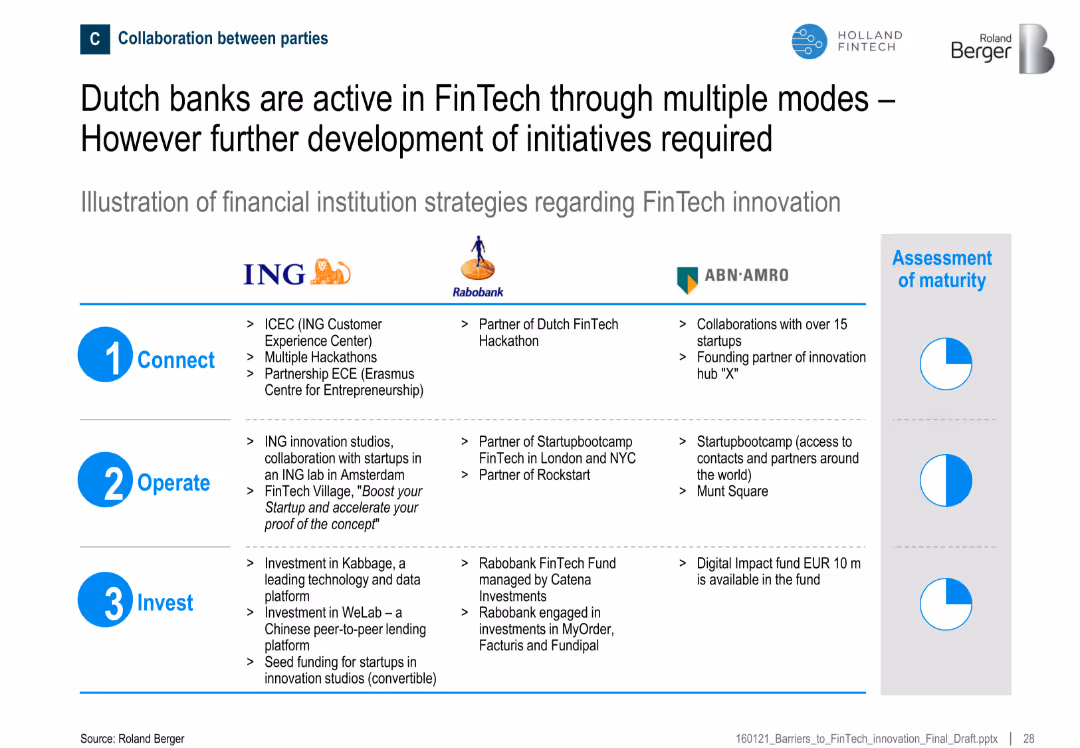
Tabular comparison of ING, Rabobank, and ABN-AMRO across Connect, Operate, and Invest categories; maturity indicators shown
Strategic Planning
Financial Services
Provides a comparative overview of Dutch banks’ FinTech engagement activities, highlighting varying levels of initiative maturity across connection, operation, and investment categories.
Dutch banks, FinTech, ING, Rabobank, ABN-AMRO, investment, innovation
false
Strategic Planning
Financial Services financial-services
Mixed Chart
Roland Berger
View slide
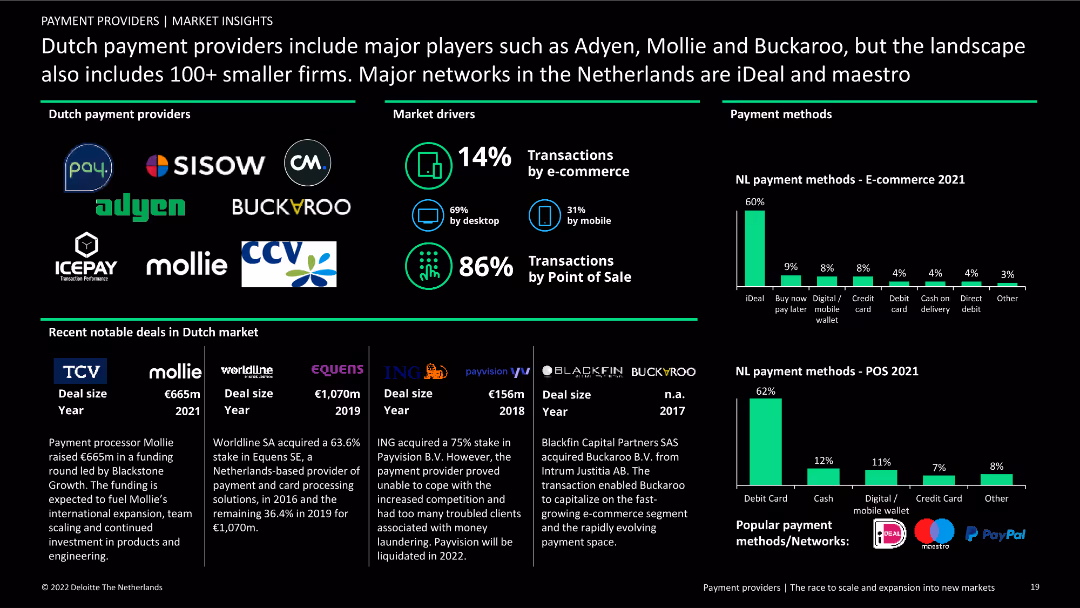
Contains logos of major Dutch payment providers, pie charts for payment methods, and text boxes with recent deals and market drivers.
Market Analysis and Trends
Financial Services
Analysis of the Dutch payments market, highlighting major players, market drivers, and recent notable deals. Includes payment method preferences for e-commerce and Point of Sale.
Dutch payment providers, Adyen, Mollie, Buckaroo, market drivers, notable deals, payment methods, financial services, market analysis, trends
false
Market Analysis and Trends
Financial Services financial-services
Multiple Chart
Deloitte
View slide
Contains timelines and icons depicting hydrogen electrolysis capacity targets, infrastructure roadmaps, and targeted end-use sectors in a segmented layout.
Strategic Planning
Energy & Utilities
Discusses the Netherlands' hydrogen strategy focusing on developing infrastructure and scaling hydrogen use in various sectors by 2050, with specific targets for electrolysis capacity and transport applications.
Dutch, Hydrogen, Strategy, Infrastructure, Targets
false
Strategic Planning
Energy & Utilities energy-and-utilities
Mixed Chart
McKinsey
View slide
A detailed slide with a column chart showing annual global entertainment and media revenue from 2016-2025, with a red line depicting year-on-year growth percentage.
Market Analysis and Trends
Media & Entertainment
This slide analyzes the decline in global entertainment and media revenue in 2020 due to pandemic impacts, with projections up to 2025.
E&M industry, revenue impact, pandemic, global trends, 2020, projections, annual growth
false
Market Analysis and Trends
Media & Entertainment media-and-entertainment
Single Chart
PwC/Strategy&
View slide
Slide presents a combined column and line chart with annual data from 2015 to 2024. Gray columns represent total global E&M revenue, with an overlaid line chart depicting annual growth rates in orange for negative values and green for positive values. Key years and percentage changes are highlighted, enhancing clarity.
Market Analysis and Trends
Media & Entertainment
This slide discusses the fluctuating trends in global entertainment and media (E&M) revenue, highlighting a significant decline in 2020 followed by a recovery phase. It is designed to analyze economic impacts on the industry, suitable for strategic planning in financial forecasting and market response strategies within the E&M sector.
E&M, revenue, growth, decline, forecast
false
Market Analysis and Trends
Media & Entertainment media-and-entertainment
Single Chart
PwC/Strategy&
View slide
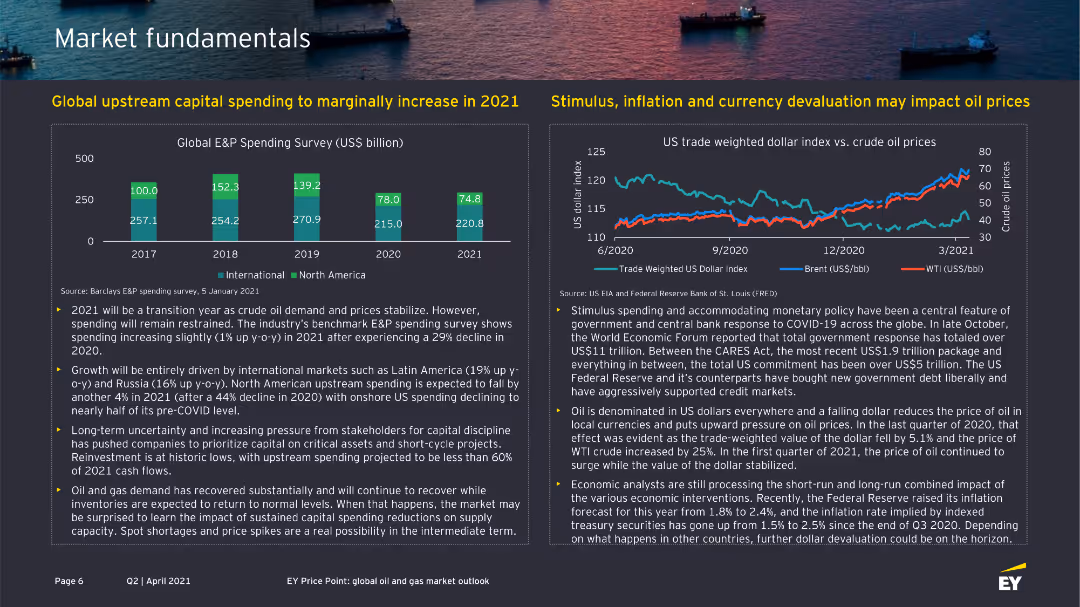
The slide features two column charts, one showing global E&P spending survey results and another line chart showing the US trade-weighted dollar index vs. crude oil prices.
Market Analysis and Trends
Energy & Utilities
It presents data on global upstream capital spending and the impact of economic factors like stimulus, inflation, and currency devaluation on oil prices.
E&P spending, capital, oil prices, trade-weighted dollar, inflation
false
Market Analysis and Trends
Energy & Utilities energy-and-utilities
Multiple Chart
EY
View slide
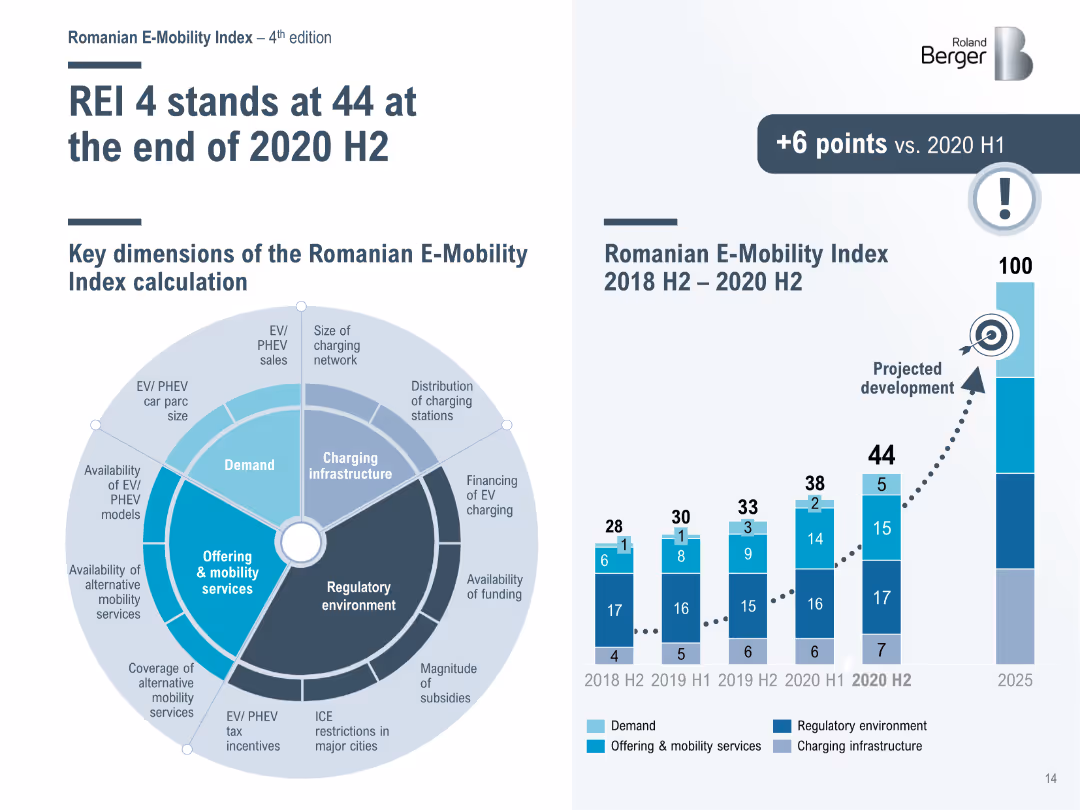
Bar chart and radar chart showing the Romanian E-Mobility Index (REI) and its key dimensions from 2018 H2 to 2020 H2, with a projection for future development.
Performance Metrics and KPIs
Transportation & Logistics
Analyzes the Romanian E-Mobility Index, detailing the progress and key dimensions of the index, including demand, infrastructure, and regulatory environment.
E-Mobility Index, Romania, performance, development
false
Performance Metrics and KPIs
Transportation & Logistics transportation-and-logistics
Mixed Chart
Roland Berger
View slide
Contains a large blue column chart for e-Commerce GMV growth and text boxes outlining key insights related to market dynamics.
Strategic Planning
Retail & E-commerce
Highlights the rapid growth of e-Commerce GMV and details the synergy with digital financial services and the informal e-commerce sector. The slide can serve to inform investment decisions and digital transformation strategies, particularly in fintech and retail sectors.
E-commerce, GMV, DFS, Growth
false
Strategic Planning
Retail & E-commerce retail-and-e-commerce
Mixed Chart
Bain
View slide
Features multiple blue column charts for e-commerce sector growth, with annotations for percentage changes.
Market Analysis and Trends
Retail & E-commerce
This slide analyzes sector-wise growth in e-commerce, with a focus on the significant role e-commerce plays as a growth driver in the economy. It discusses challenges in online travel, offering insights into current trends and future projections, useful for strategic planning in e-commerce and associated industries.
E-commerce, Growth, Sector, Challenge
false
Market Analysis and Trends
Retail & E-commerce retail-and-e-commerce
Multiple Chart
Bain
View slide
This slide features a column chart and a numeric list detailing the impact of logistics on e-commerce deals. The colors used differentiate the segments clearly, with annotations providing insights on investment trends.
Market Analysis and Trends
Transportation & Logistics
Analyzes how logistics investments have become a major driver in e-commerce deal values, with a notable surge in H1 2021. It also touches on the growing trend of non-marketplace investment opportunities within the e-commerce realm.
E-commerce, Logistics, Investment Trends, SEA
false
Market Analysis and Trends
Transportation & Logistics transportation-and-logistics
Mixed Chart
Bain
View slide
Two maps of Malaysia show the digital participation levels across regions in green shades for demand and blue shades for supply. There is no graph or chart, just color-coded regional data.
Competitive Landscape
Technology & Software
It contrasts digital e-commerce demand and supply in Malaysia, with Kuala Lumpur leading in participation. The slide could be used to identify market gaps and areas of potential growth, valuable for regional market analysis and strategic planning.
E-commerce, Malaysia, Digital Participation, Kuala Lumpur, Demand, Supply
false
Competitive Landscape
Technology & Software technology-and-software
Multiple Chart
Bain
View slide
This slide includes vertical column charts breaking down the online luxury goods market by region and category for 2019, with emphasis on growth rates and market influence.
Technology and Digital Transformation
Consumer Goods
Discusses the segmentation of the online luxury goods market in 2019, focusing on how digital transformation influences consumer behavior.
E-commerce, Market segmentation, Digital transformation
false
Technology and Digital Transformation
Consumer Goods consumer-goods
Mixed Chart
Bain
View slide
Composed of text sections and accompanying icons, outlining client needs, existing capabilities, and future investments.
Customer and Market Segmentation
Technology & Software
Showcases J.P.Morgan's comprehensive solutions for e-commerce, highlighting their unique position as an end-to-end service provider.
E-commerce, Payment Solutions, J.P.Morgan, Digital Banking, Merchant Experience
false
Customer and Market Segmentation
Technology & Software technology-and-software
Table
JP Morgan
View slide
Bar charts illustrate sectoral growth with a focus on e-commerce and travel, using clear visual distinction and annotations.
Market Analysis and Trends
Technology & Software
Evaluates the significant rise in Thailand's e-commerce, compensating for slower recovery in travel, with projections until 2025.
E-commerce, Thailand, Travel, Growth, Recovery, Projections, 2025, Sectors
false
Market Analysis and Trends
Technology & Software technology-and-software
Multiple Chart
Bain
View slide
Presents four column charts depicting GMV per sector in Singapore, including e-commerce, transport, travel, and media from 2015 to 2025, with a title and legends.
Market Analysis and Trends
Technology & Software
Evaluates sector-specific growths and declines within Singapore’s digital economy, highlighting challenges and opportunities, particularly useful for sector-specific strategy development.
E-commerce, Transport, Food, Travel, Media, Singapore
false
Market Analysis and Trends
Technology & Software technology-and-software
Multiple Chart
Bain
View slide
The slide is filled with stacked column charts comparing private funding values across sectors, with percentages illustrating the distribution of investments.
Competitive Landscape
Financial Services
Discussing the appeal of E-commerce for investments in H1 2022, it shows the sector outperforming others, indicating market trends and investor confidence.
E-commerce, investments, unicorn, market trends, investor confidence, sector comparison
false
Competitive Landscape
Financial Services financial-services
Single Chart
Bain
Previous
Loading...
Hold On!
We are searching in our database
If nothing, comes up, please try different filters!
Column Chart
Heatmap
Chevron
Org Chart
Infographic
Callouts
Timeline
List
Graphic
Picture
Process Flow
Diagram
Paragraph
Map
Table
Framework
Subtitle
Takeaway Box
Icon
Other Chart
Radar Chart
Waterfall Chart
Mekko Chart
Pie Chart
Scatter Plot
Line Chart
Bar chart
Bullet points
Create a FREE account to continue browsing
Receive Instant Access to 1,000+ slides from companies like McKinsey, Google, and Goldman Sachs
First Name
Last Name
Email
Password
I agree to all
Terms & Privacy Policy
Thank you! Your submission has been received!
Oops! Something went wrong while submitting the form.
Have an account?
Sign in
Upgrade to PRO to Save slides
Advanced Search and Filters
Access to 15,000+ slides
Access to Category Pages
Save/Bookmark Slides
PowerPoint Template Library
Pick a Plan
MONTHLY
$12/month
Billed every month, Cancel anytime.
YEARLY
$9/year
Billed $108 annually, Cancel anytime.
Checkout for $12/month
Checkout for $108/yr
Secured by Stripe | AES-256 bit encryption