My Account
My Slides
Search by Category
Templates
View All Templates
Download Template Slides
Leave Feedback
Login
Logout
Get Started
Browse all Slides
Browse all Slides
Create a FREE Account
Instant access to 1,000+ real slides from top companies like McKinsey, BCG, Goldman Sachs, Google and many more!
First Name
Last Name
Email
Password
I agree to all
Terms & Privacy Policy
Thank you! Your submission has been received!
Oops! Something went wrong while submitting the form.
Have an account?
Sign in
Spark Your Next Big Idea with New Presentation Templates
VIEW ALL Templates
Welcome,
Welcome
PRO
Show Featured Only
Checkbox 8
Companies
Mckinsey
Bain
BCG
EY
Deloitte
Accenture
PwC/Strategy&
JP Morgan
Goldman Sachs
Morgan Stanley
Citigroup
Deutsche Bank
Barclays
LEK
KPMG
Kearney
Oliver Wyman
Booz Allen Hamilton
Gartner
IPSOS
Nielsen
Slide type
Text Only
Linear Flow
Vertical Flow
Single Chart
Header Horizontal
Mixed Chart
Header Vertical
Pillar
Multiple Chart
Graphic
Agenda
Title
Table
Framework
Industry
Technology & Software
Artificial Intelligence
Financial Services
Retail & E-commerce
Consumer Goods
Industrial & Manufacturing
Transportation & Logistics
Telecommunications
Real Estate & Construction
Hospitality & Tourism
Professional Services
Education & Training
Media & Entertainment
Agriculture & Food Production
Healthcare & Pharmaceuticals
Environmental Services & Sustainability
Government & Public Sector
Use Case
Mergers and Acquisitions
Performance Metrics and KPIs
Client Case Studies
Competitive Landscape
Corporate Finance and Valuation
Product and Service Analysis
Customer and Market Segmentation
Organizational Structure and Change
Industry Overview
Regulatory and Compliance
Risk Assessment and Management
Investment Analysis
Organizational Structure and Change
Human Resources and Talent Management
Financial Performance
Market Analysis and Trends
Sales and Business Development
Human Resources and Talent Management
Clear all
Thank you! Your submission has been received!
Oops! Something went wrong while submitting the form.
Tag
View slide
Features a pie chart and bar graphs to showcase e-commerce penetration and growth in tier 2 and tier 3 cities from 2020 to 2025.
Market Analysis and Trends
Retail & E-commerce
Predicts e-commerce market size and penetration, key for businesses and investors to gauge future e-commerce trends and opportunities.
E-commerce, market growth, penetration, tier 2, tier 3, projections, market size, business strategy
false
Market Analysis and Trends
Retail & E-commerce retail-and-e-commerce
Mixed Chart
Kearney
View slide
A slide with bullet points and a circular graphic, discussing the impact of e-commerce on related sub-sectors.
Market Analysis and Trends
Retail & E-commerce
Evaluates e-commerce's influence on its sub-sectors, essential for strategic planning and understanding market dynamics.
E-commerce, market segmentation, sub-sectors, strategic planning, market dynamics, social commerce, B2B commerce, specialized commerce
false
Market Analysis and Trends
Retail & E-commerce retail-and-e-commerce
Header Horizontal
Kearney
View slide
The slide features a multi-faceted analysis with icons and bullet points, highlighting the impact of rural e-commerce strategies in China.
Market Analysis and Trends
Retail & E-commerce
Discussing the successful increase in rural e-commerce due to service centers and partnerships, this slide presents a case study on expanding digital comfort and online purchasing within rural communities in China.
E-commerce, rural strategy, China, digital adoption
false
Market Analysis and Trends
Retail & E-commerce retail-and-e-commerce
Header Vertical
BCG
View slide
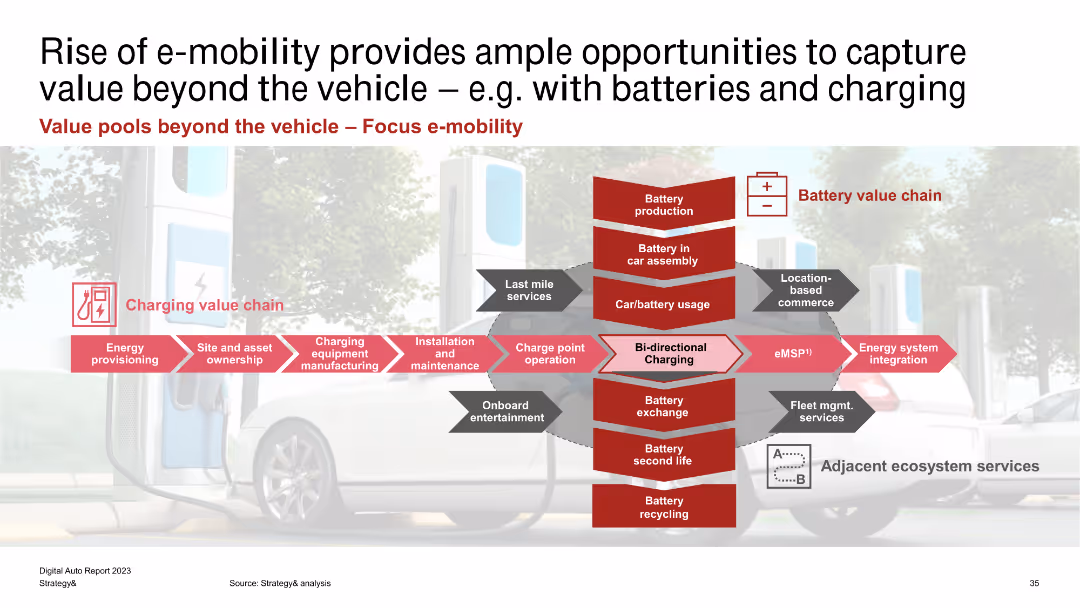
The slide features a complex diagram showing the charging value chain and battery value chain, with multiple red arrows and text boxes. The background image is of an electric car and charging station.
Market Analysis and Trends
Energy & Utilities
The slide illustrates the different value pools in the e-mobility ecosystem, focusing on the charging and battery value chains. It identifies various stages like energy provisioning, site ownership, and battery production as areas for potential value capture.
E-mobility, Charging, Battery, Value Chain, Energy Provisioning, Asset Ownership, Maintenance, Integration, Fleet Management
false
Market Analysis and Trends
Energy & Utilities energy-and-utilities
Linear Flow
PwC/Strategy&
View slide
Diagram centered layout showing a holistic approach to E-mobility ecosystem with sections colored in different shades of gray and red, enhancing visual segregation.
Strategic Planning
Transportation & Logistics
Describes factors influencing the development of the E-mobility ecosystem, including regulatory and financial aspects critical for sustained adoption of electric vehicles.
E-mobility, ecosystem, strategic planning, regulatory impact, financial factors, sustainable adoption
false
Strategic Planning
Transportation & Logistics transportation-and-logistics
Framework
PwC/Strategy&
View slide
Dark green background with white text, a column chart showing recycling percentages for various materials, including paper, glass, plastic, and electronic devices.
Regulatory and Compliance
Consumer Goods
The slide highlights the low recycling rates for e-waste compared to other materials, using survey data to emphasize the need for better recycling practices for electronics.
E-waste, recycling rates, materials, survey, sustainability
false
Regulatory and Compliance
Consumer Goods consumer-goods
Multiple Chart
Oliver Wyman
View slide
Features a bar chart analyzing the critical success factors for implementing End-to-End processes, such as role clarity and leadership alignment.
Operational Efficiency
Professional Services
Identifies key factors contributing to the successful implementation of End-to-End processes in GBS organizations.
E2E processes, GBS, success factors, leadership, operational efficiency
false
Operational Efficiency
Professional Services professional-services
Mixed Chart
Deloitte
View slide
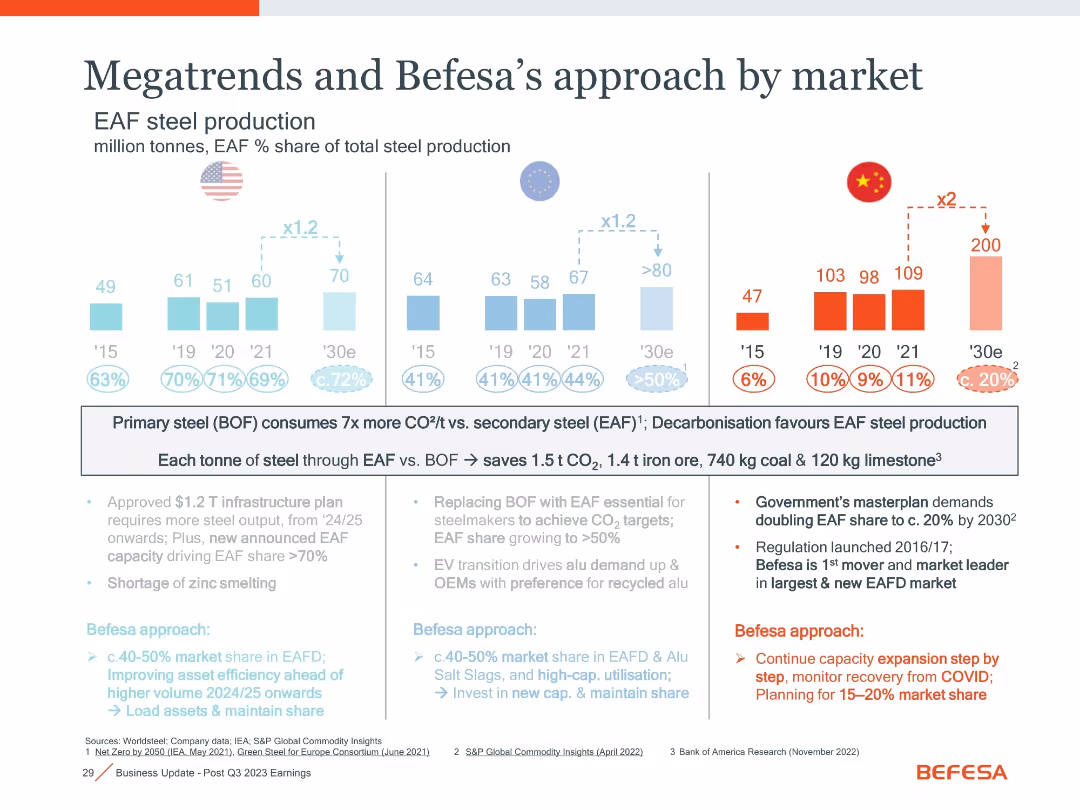
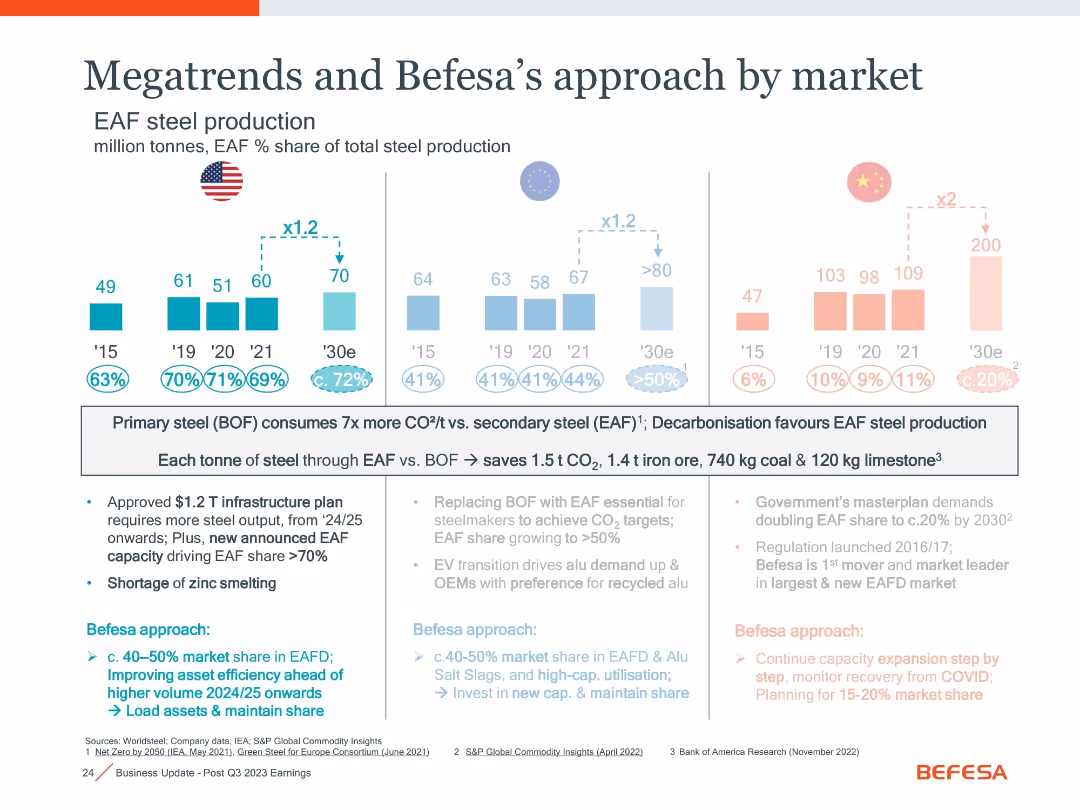
Split panel layout with three regional bar charts (US, EU, China) showing EAF steel production trends; includes annotations, icons, and text boxes explaining strategic implications
Strategic Planning
Industrial & Manufacturing
The slide compares EAF steel production trends across the US, EU, and China, emphasizing carbon savings from EAF over BOF. It outlines government policies and Befesa's market share strategies, highlighting environmental drivers and future expansion.
EAF, BOF, steel production, decarbonisation, market share, CO2 savings, infrastructure, zinc smelting, policy
false
Strategic Planning
Industrial & Manufacturing industrial-and-manufacturing
Mixed Chart
Goldman Sachs
View slide
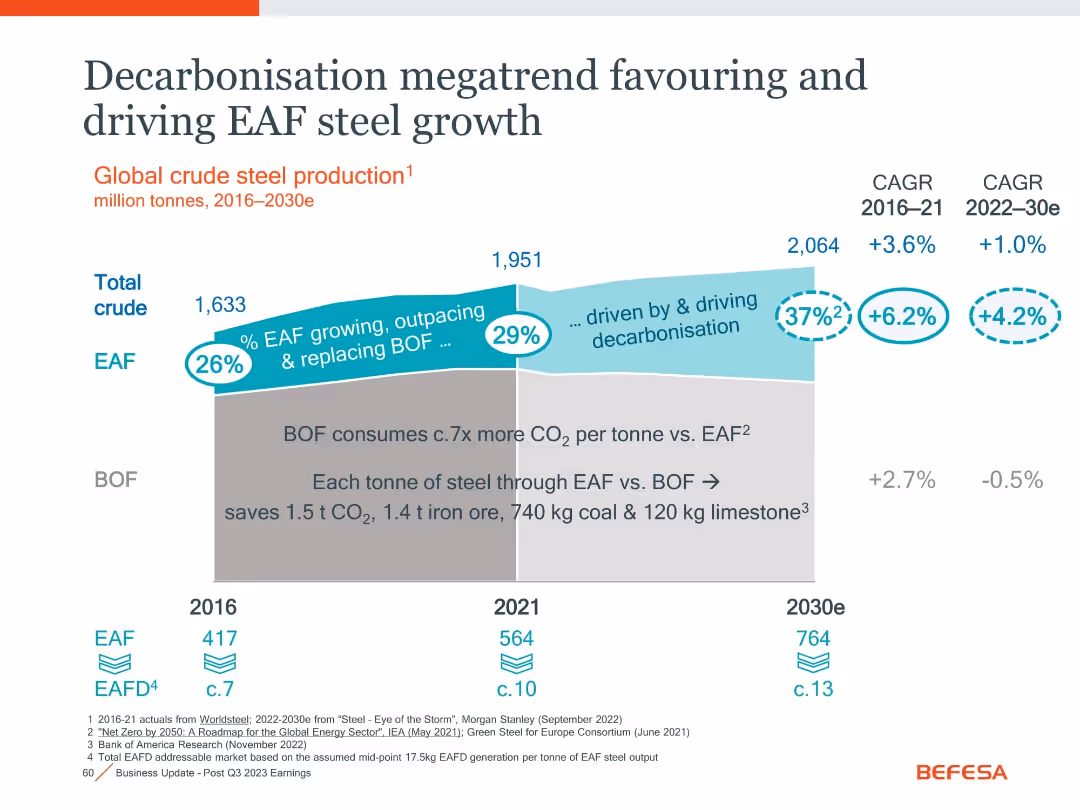
Stylized stacked area chart showing shift from BOF to EAF steel production, annotated with decarbonization benefits.
Market Analysis and Trends
Environmental Services & Sustainability
Projects global steel production shift from BOF to EAF through 2030, driven by sustainability. Emphasizes lower CO₂ output and energy/material savings per ton via EAF, predicting growth in EAF steel and associated market.
EAF, BOF, steel production, decarbonization, CO₂, market trend, CAGR
false
Market Analysis and Trends
Environmental Services & Sustainability environmental-services-and-sustainability
Single Chart
Goldman Sachs
View slide
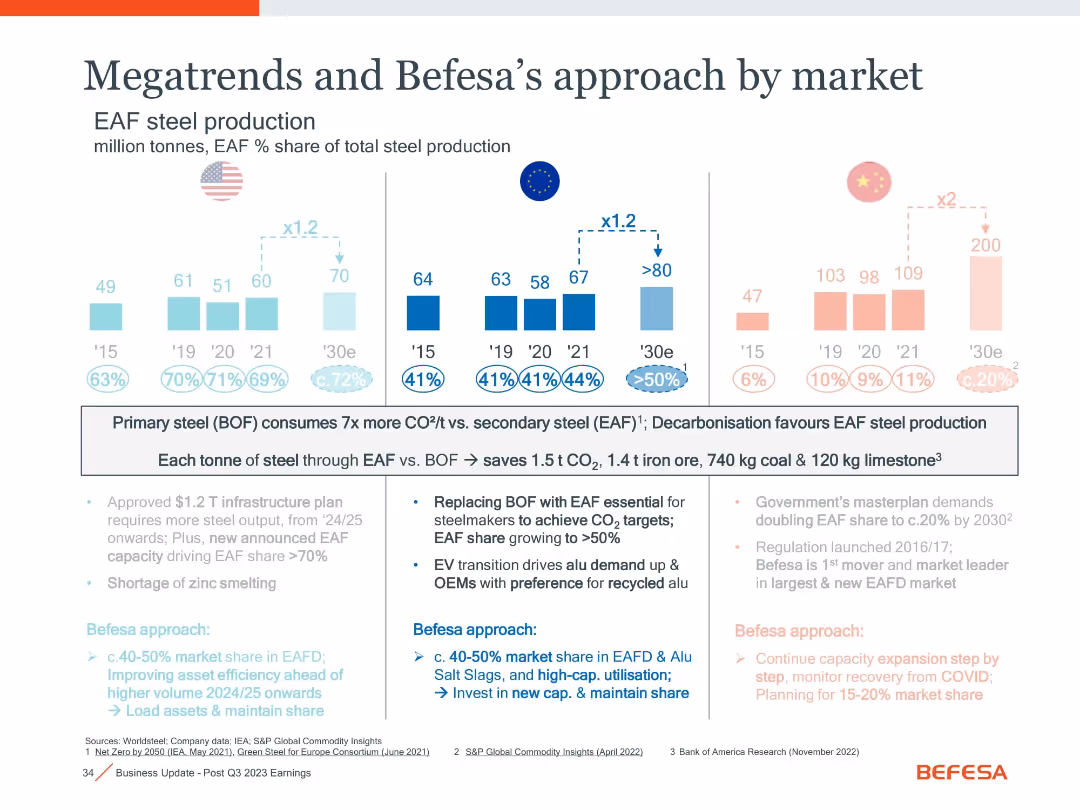
Bar graphs for steel production in US, EU, China with forecasts to 2030; text annotations explaining drivers and EAF % share.
Market Analysis and Trends
Industrial & Manufacturing
This slide visualizes projected EAF steel production increases across the US, EU, and China through 2030. It emphasizes decarbonization as a key driver and forecasts significant shifts in market share, especially in China.
EAF, decarbonization, steel production, market forecast, 2030, US, EU
false
Market Analysis and Trends
Industrial & Manufacturing industrial-and-manufacturing
Mixed Chart
Goldman Sachs
View slide
Three regional bar graphs with EAF production history and projections; detailed annotations of company strategy by region.
Market Analysis and Trends
Industrial & Manufacturing
The slide compares EAF steel production growth by region (US, EU, China) and links it to Befesa’s strategic approach. It highlights carbon savings and regional market share strategy, with a focus on decarbonization trends and recycling capacity.
EAF, regional strategy, CO2 savings, recycling, market share, decarbonization
false
Market Analysis and Trends
Industrial & Manufacturing industrial-and-manufacturing
Mixed Chart
Goldman Sachs
View slide
Duplicate of slide 18031 with same layout, bar charts, and content, showing EAF market evolution and regional strategies
Strategic Planning
Industrial & Manufacturing
Repeats slide 18031 content, summarizing EAF production trends in the US, EU, and China, with a focus on carbon reduction benefits and Befesa’s regional strategic responses to policy and demand shifts.
EAF, steel production, CO2 reduction, regional strategy, US, EU, China, decarbonisation, infrastructure
false
Strategic Planning
Industrial & Manufacturing industrial-and-manufacturing
Mixed Chart
Goldman Sachs
View slide
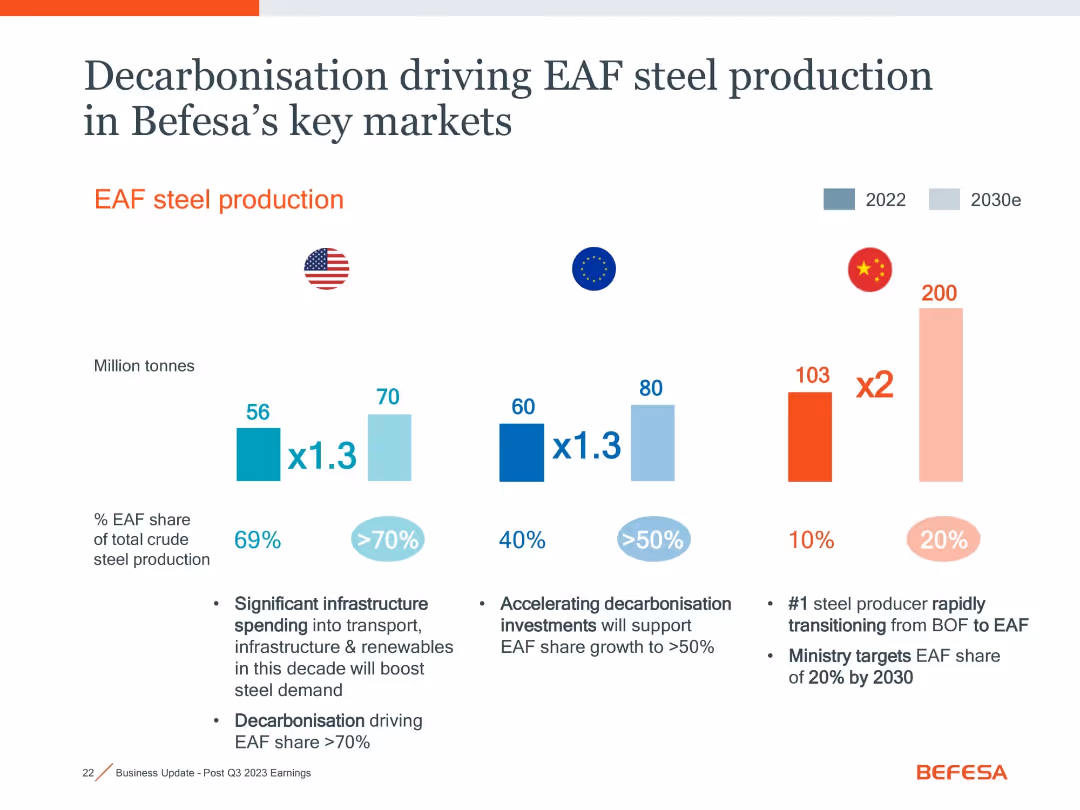
Bar chart comparing 2022 vs. 2030e EAF production in US, EU, China with textual insights below
Industry Overview
Industrial & Manufacturing
Projects significant growth in electric arc furnace (EAF) steel production in the US, EU, and China driven by decarbonization goals. China's EAF share expected to double by 2030.
EAF, steel production, decarbonisation, infrastructure, forecast
false
Industry Overview
Industrial & Manufacturing industrial-and-manufacturing
Mixed Chart
Goldman Sachs
View slide
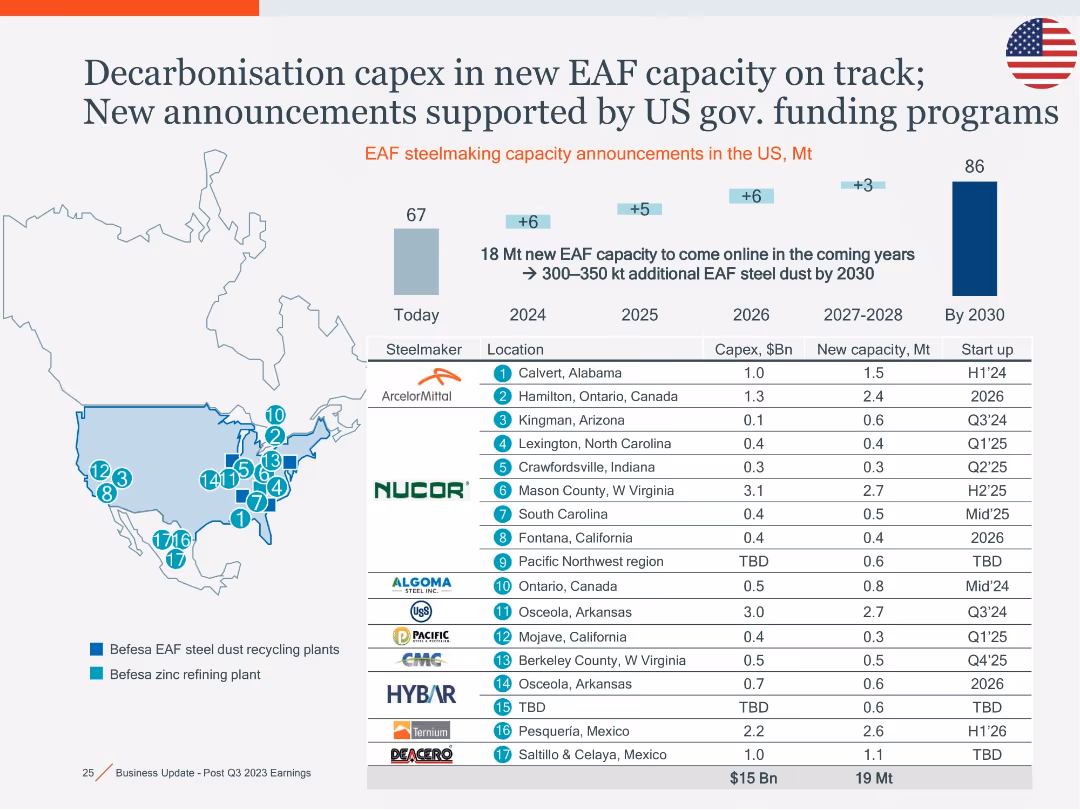
US map with locations, timeline bar graph, and steelmaker investment table with Capex and capacity data through 2030.
Investment Analysis
Industrial & Manufacturing
This slide maps and lists planned EAF steel capacity expansions in North America through 2030, highlighting investments by major steelmakers. It ties into Befesa’s positioning with their US plants and notes total Capex of $15B and 19 Mt of new capacity.
EAF, steelmakers, US map, capacity expansion, Capex, investment, 2030
false
Investment Analysis
Industrial & Manufacturing industrial-and-manufacturing
Mixed Chart
Goldman Sachs
View slide
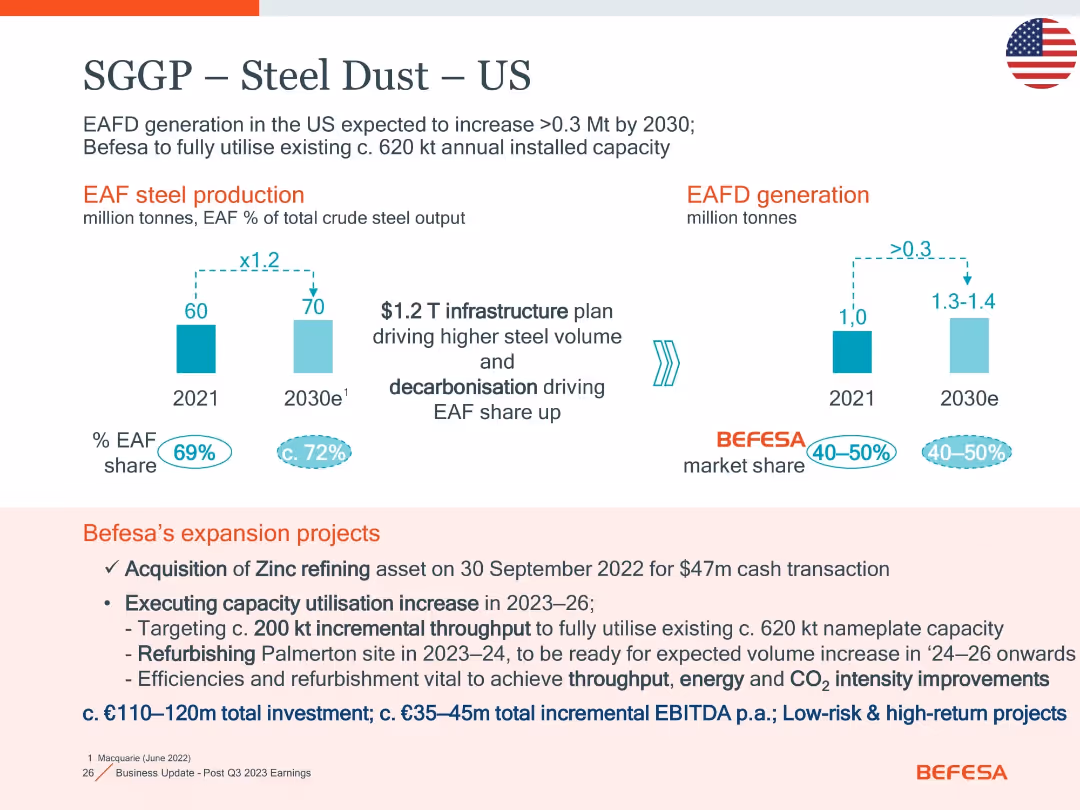
Two bar charts for EAF production and EAFD generation; bottom section lists Befesa’s US expansion actions and investment details.
Strategic Planning
Industrial & Manufacturing
Focuses on EAFD growth and market share in the US through 2030. It outlines Befesa’s strategic projects, including zinc refining and Palmerton refurbishment, with low-risk high-return investments (€110–120m) aimed at capacity and efficiency improvement.
EAFD, expansion, zinc refining, Palmerton, CO2, throughput, investment
false
Strategic Planning
Industrial & Manufacturing industrial-and-manufacturing
Mixed Chart
Goldman Sachs
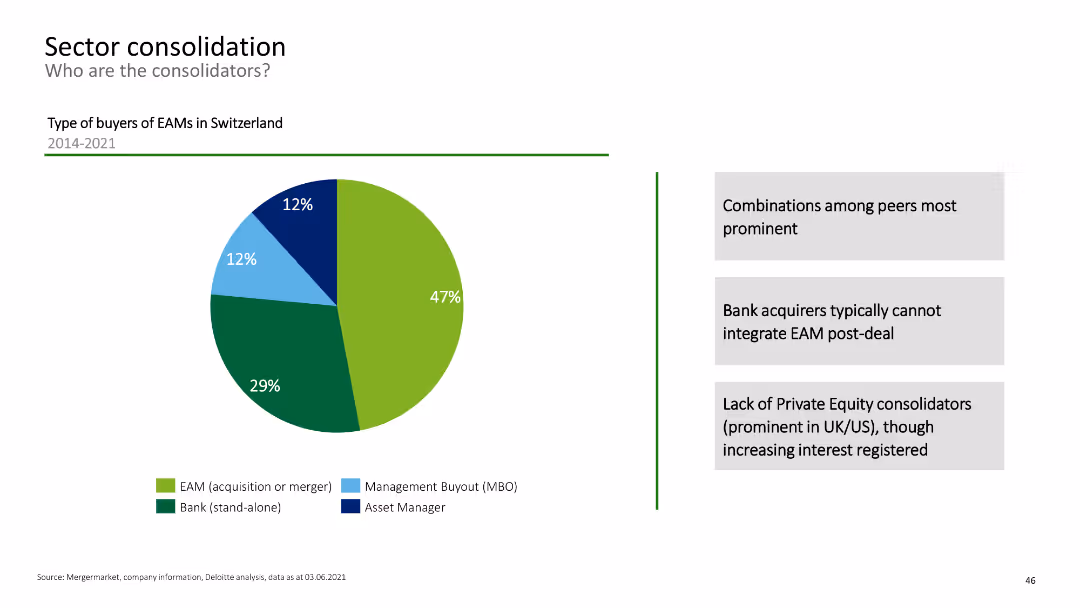
View slide
Pie chart showing the types of buyers of EAMs in Switzerland from 2014-2021.
Mergers and Acquisitions
Financial Services
The slide identifies the primary buyers in the EAM consolidation market, including banks, asset managers, and others.
EAM buyers, mergers, acquisitions, sector consolidation, financial analysis
false
Mergers and Acquisitions
Financial Services financial-services
Mixed Chart
Deloitte
View slide
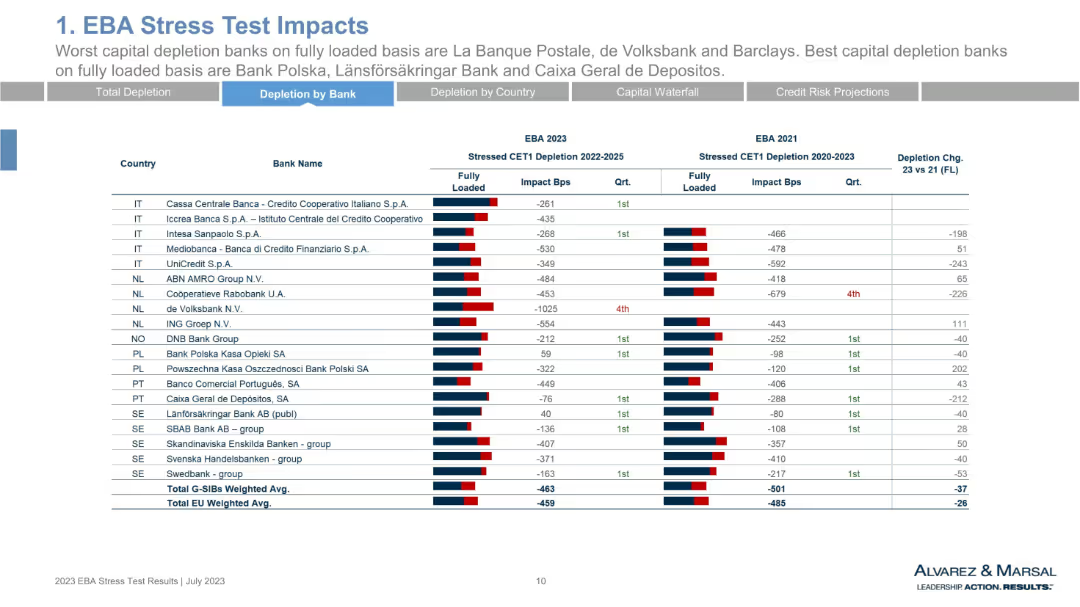
Final part of CET1 depletion data per bank. Bar chart format, consistent with previous slides. Also includes data on Nordic, Eastern, and Southern European banks.
Risk Assessment and Management
Financial Services
The table wraps up bank-level CET1 depletion analysis, highlighting best-performing institutions like Länsförsäkringar Bank and Caixa Geral. Compares 2023 to 2021 values and shows quadrant rankings. Reinforces disparities in stress resilience across EU banks.
EBA 2023, CET1 impact, stress comparison, Nordic banks, Eastern Europe, resilient banks
false
Risk Assessment and Management
Financial Services financial-services
Single Chart
Alvarez & Marsal
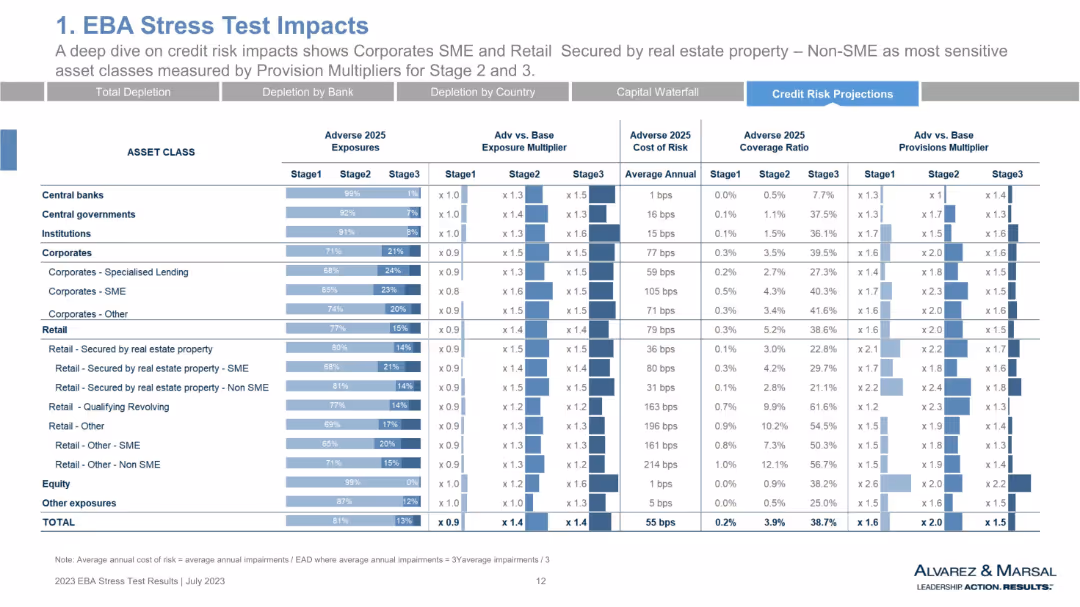
View slide
Data-dense table with horizontal bar visuals showing adverse 2025 exposures, multipliers, risk cost, and provision multipliers across asset classes. Uses shades of blue and structured rows/columns.
Risk Assessment and Management
Financial Services
This slide presents a detailed breakdown of EBA stress test impacts, highlighting corporate SME and retail assets secured by real estate as the most sensitive categories. It evaluates exposures and risk multipliers across stages and asset classes, emphasizing cost of risk and provision coverage. The structure supports a comparative view of risk metrics under adverse scenarios.
EBA stress test, credit risk, exposures, provision multipliers, cost of risk, corporates, SME, retail, asset class, financial stress
false
Risk Assessment and Management
Financial Services financial-services
Multiple Chart
Alvarez & Marsal
View slide
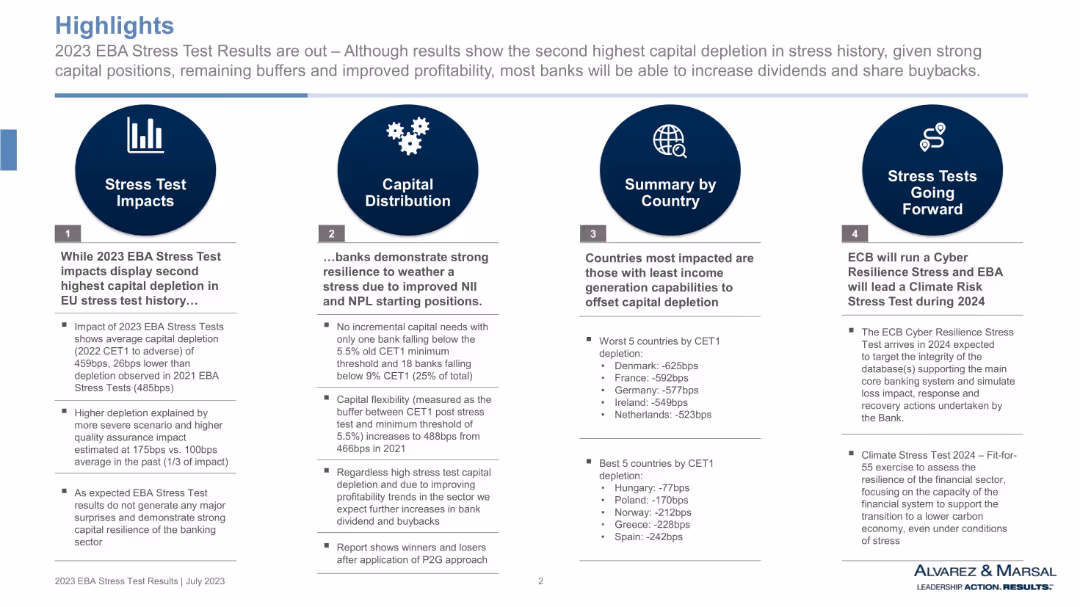
Four vertical columns with dark blue circular icons and titles. Bullet points in each section. White background with light blue headings. Visual separation between segments.
Risk Assessment and Management
Financial Services
This slide summarizes the key findings from the 2023 EBA stress test. It outlines capital depletion impacts, banks’ resilience, country-specific insights, and upcoming stress test initiatives like cyber and climate stress. Emphasis is placed on capital flexibility and potential for dividends and buybacks.
EBA, stress test, CET1, capital depletion, resilience, country impact, ECB, 2023 results
false
Risk Assessment and Management
Financial Services financial-services
Pillar
Alvarez & Marsal
View slide
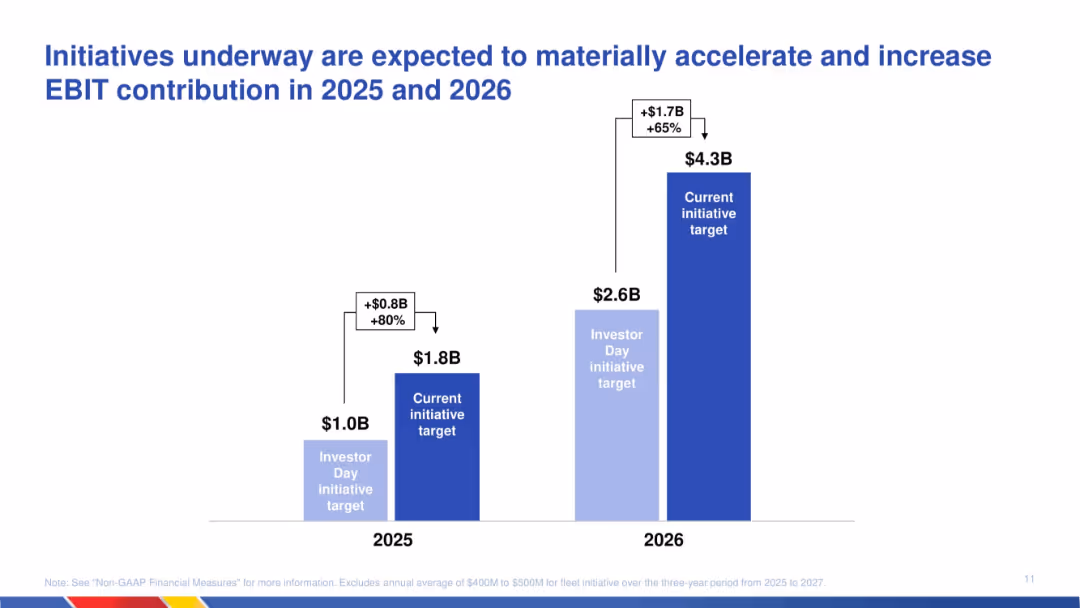
Column chart showing revised EBIT targets for 2025 and 2026; comparison of original and updated projections with labels for increase.
Strategic Planning
Transportation & Logistics
Communicates expected EBIT growth due to ongoing initiatives. The chart shows a material increase in EBIT targets for 2025 and 2026, emphasizing strategy execution effectiveness and operational uplift.
EBIT growth, initiatives, strategic plan, transportation, projections, acceleration, financial targets, operational improvement
false
Strategic Planning
Transportation & Logistics transportation-and-logistics
Single Chart
JP Morgan
View slide
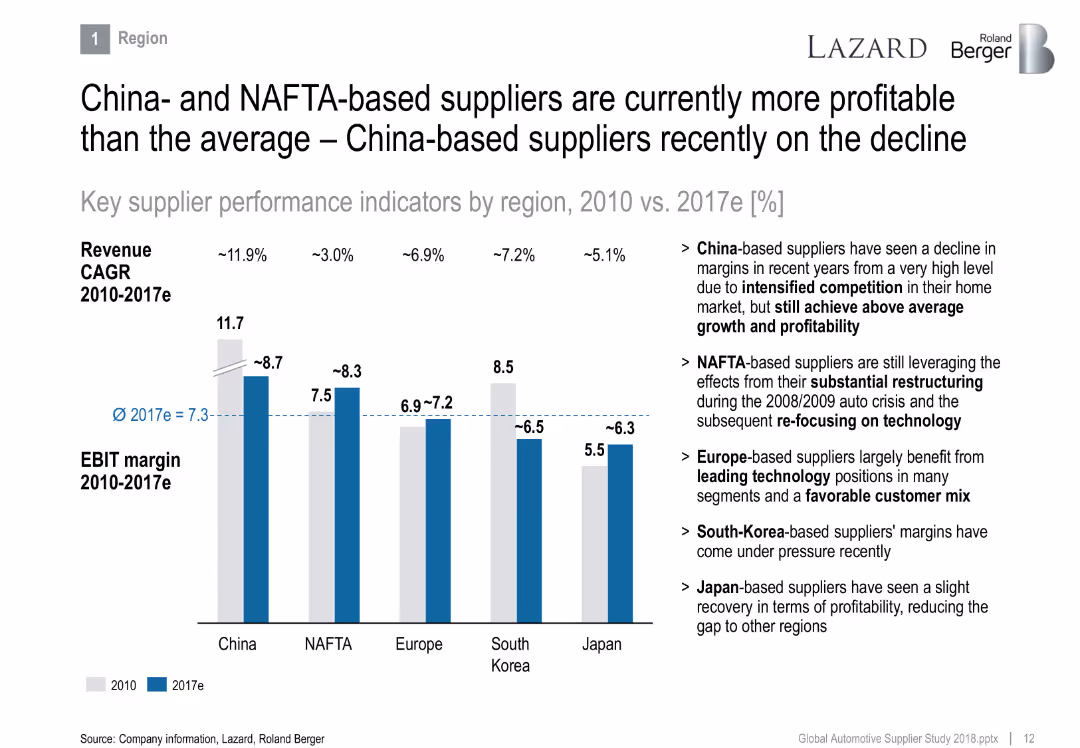
Bar chart comparing EBIT margins and revenue CAGR by region (China, NAFTA, Europe, South Korea, Japan), with explanatory text on the right.
Financial Performance
Industrial & Manufacturing
Compares supplier profitability across global regions from 2010 to 2017e. China and NAFTA regions show higher margins despite challenges, with commentary on competitive dynamics, restructuring effects, and customer mix advantages.
EBIT margin, suppliers, NAFTA, China, profitability, regions, restructuring, competition
false
Financial Performance
Industrial & Manufacturing industrial-and-manufacturing
Mixed Chart
Roland Berger
View slide
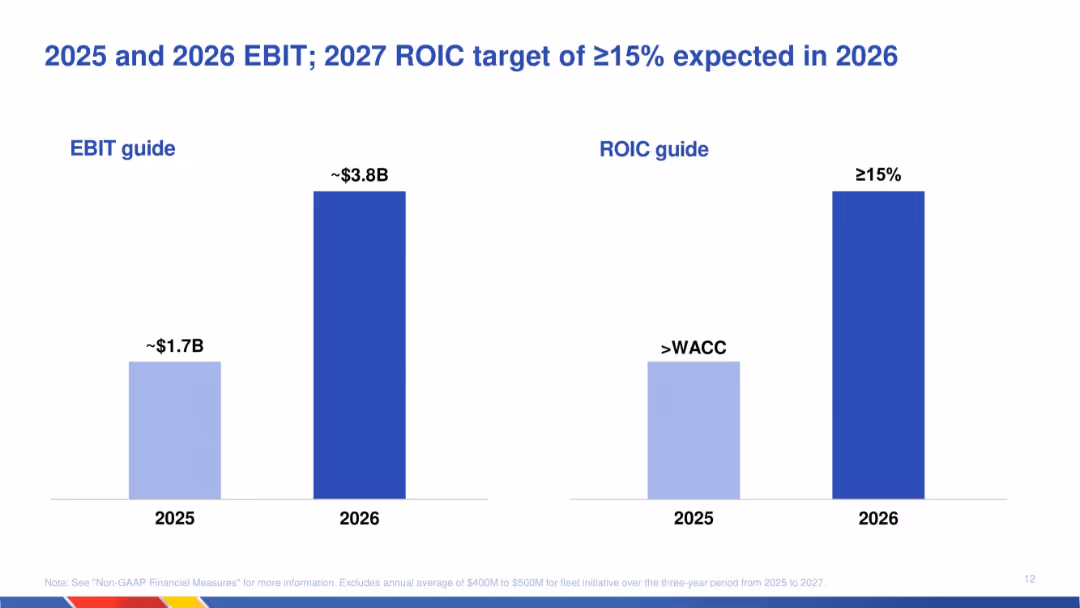
Side-by-side bar charts for EBIT and ROIC guidance across 2025 and 2026; simple format with emphasis on meeting and exceeding financial benchmarks.
Financial Performance
Transportation & Logistics
Provides financial projections indicating that EBIT is expected to more than double from 2025 to 2026, while the return on invested capital (ROIC) is projected to exceed 15% by 2026. Indicates confidence in strategic initiatives.
EBIT, ROIC, projections, financial targets, 2025, 2026, strategic outcomes, transportation, value creation
false
Financial Performance
Transportation & Logistics transportation-and-logistics
Single Chart
JP Morgan
View slide
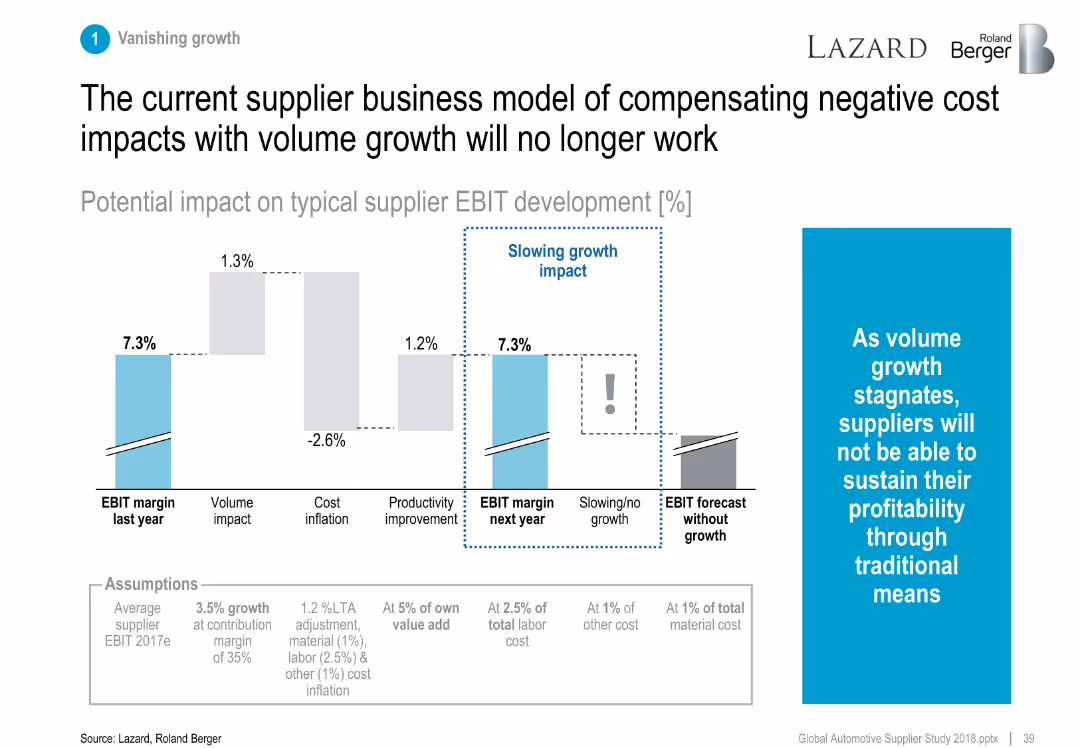
Bar chart showing EBIT impact breakdown from growth, cost, and productivity.
Financial Performance
Industrial & Manufacturing
Demonstrates that stagnating volume growth will challenge supplier profitability, making traditional margin offsets ineffective.
EBIT, cost inflation, productivity, volume growth, supplier margins
false
Financial Performance
Industrial & Manufacturing industrial-and-manufacturing
Mixed Chart
Roland Berger
View slide
This slide features multiple column charts and iconographic elements. The first chart shows the evolution of EBIT for the luxury goods market from 2019 to 2021F. Other areas detail spending directions per key cost bucket with icons representing different expenses such as marketing and digital.
Financial Performance
Consumer Goods
The slide analyzes the financial impact on the personal luxury goods market over three years, highlighting a significant drop in 2020 with partial recovery expected in 2021. It also provides strategic insights into cost management and investment focus areas like digital marketing and operational expenditures to mitigate financial impacts.
EBIT, luxury goods, financial impact, cost management, recovery
false
Financial Performance
Consumer Goods consumer-goods
Mixed Chart
Bain
View slide
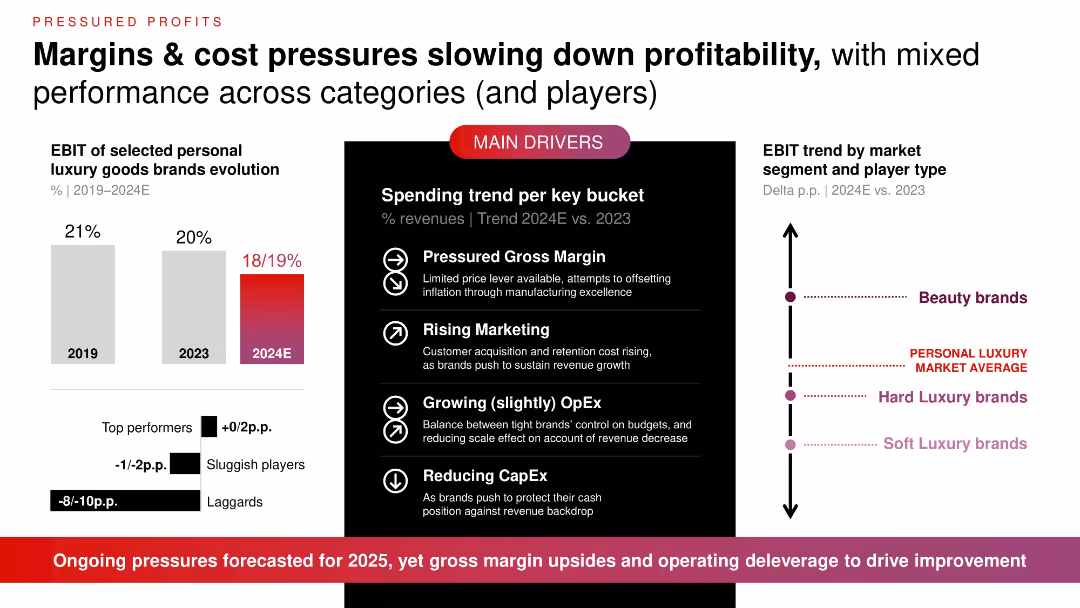
Three-panel slide with bar chart (left), drivers section (center), and vertical delta trend chart (right); red and black color themes dominate.
Financial Performance
Consumer Goods
Highlights declining EBIT in personal luxury goods (from 21% in 2019 to 18–19% in 2024E) due to pressured margins, marketing spend, rising OpEx, and reduced CapEx. Beauty brands are outperforming others. Points to expected continued pressure into 2025.
EBIT, luxury goods, profitability, gross margin, marketing, OpEx, CapEx, trends, forecast
false
Financial Performance
Consumer Goods consumer-goods
Multiple Chart
Bain
View slide
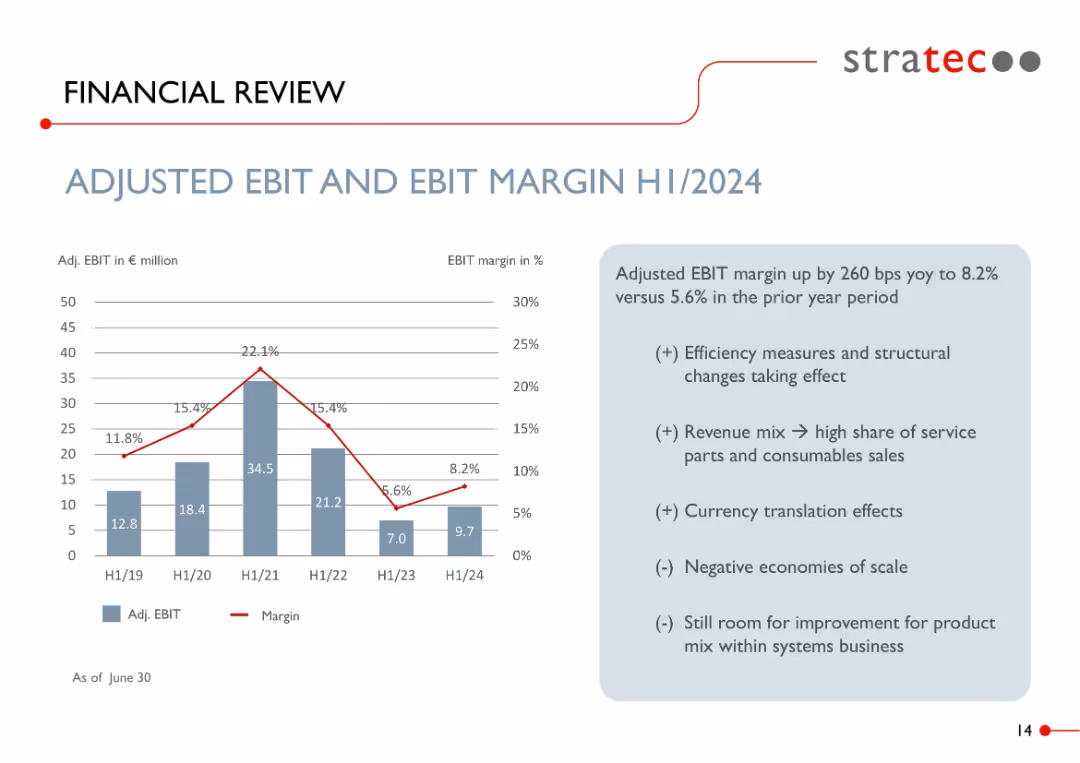
Dual-axis bar and line chart showing EBIT value and margin % from H1/19 to H1/24; commentary on the right side in a light blue box.
Financial Performance
Healthcare & Pharmaceuticals
Details the adjusted EBIT and margin trend over five years, with margin improving to 8.2% in H1/2024. Drivers include efficiency measures, revenue mix favoring consumables, and currency effects. Notes scale challenges and improvement potential in systems business.
EBIT, margin, financials, diagnostics, cost efficiency, revenue mix, STRATEC, service parts
false
Financial Performance
Healthcare & Pharmaceuticals healthcare-and-pharmaceuticals
Mixed Chart
Goldman Sachs
View slide
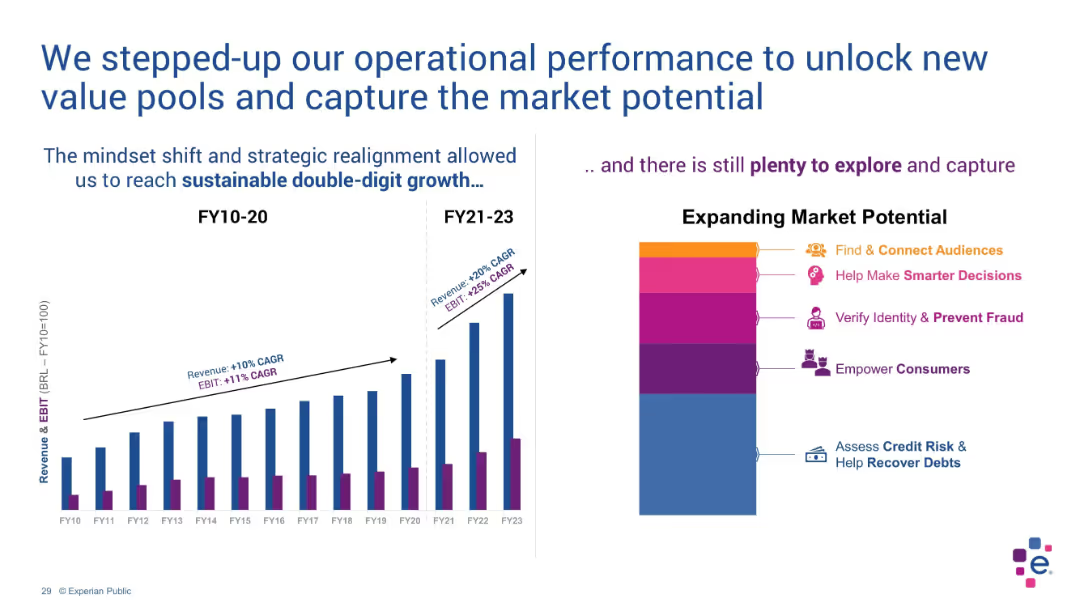
Dual-panel layout with bar chart on left and stylized stacked blocks on right
Operational Efficiency
Technology & Software
The slide illustrates growth acceleration in revenue and EBIT due to strategic shifts. The bar chart compares FY10–20 vs FY21–23 performance. A stylized chart shows market opportunities such as fraud prevention and consumer empowerment.
EBIT, revenue growth, strategy, double-digit, market potential, FY23
false
Operational Efficiency
Technology & Software technology-and-software
Multiple Chart
Barclays
View slide
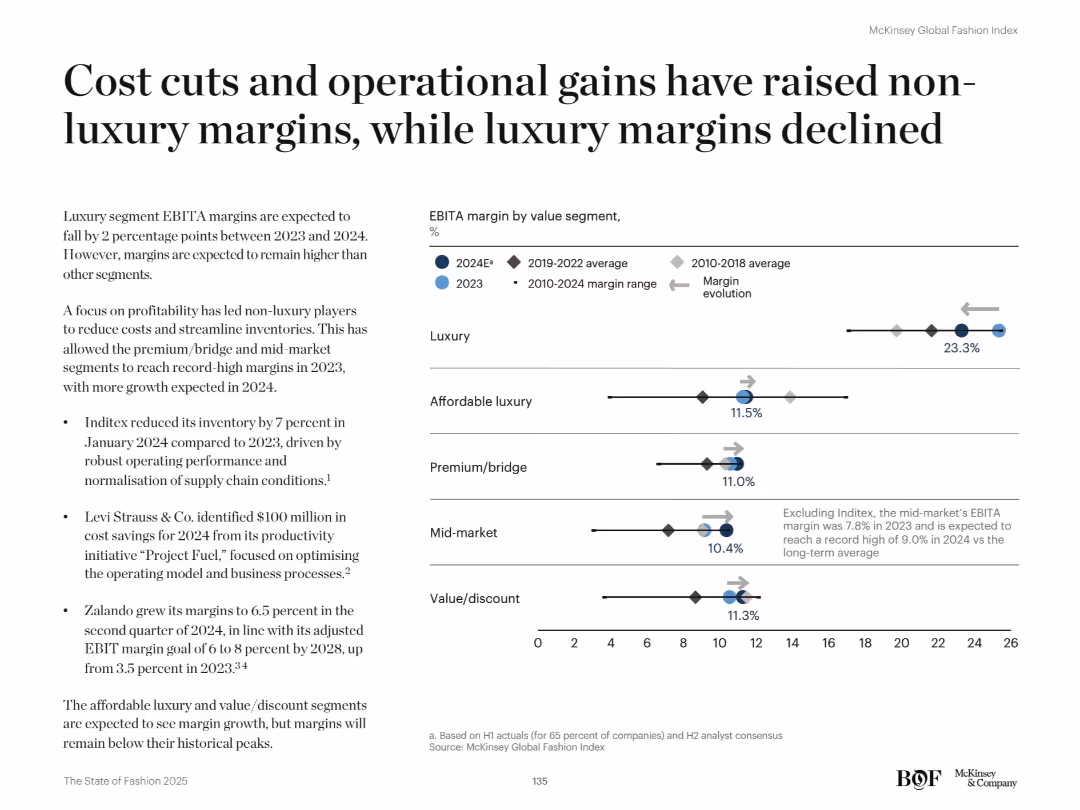
Right-side dot plot shows EBITA margins by segment. Left text details margin evolution and cost-saving efforts.
Performance Metrics and KPIs
Retail & E-commerce
The slide contrasts margin trends across fashion segments. Non-luxury EBITA margins rise due to cost-cutting and operational gains, while luxury margins decline despite remaining above average. Companies like Inditex and Levi's drive improvement.
EBITA, margins, cost savings, supply chain, segment analysis, operational gains, profitability, fashion strategy, luxury vs non-luxury
false
Performance Metrics and KPIs
Retail & E-commerce retail-and-e-commerce
Mixed Chart
McKinsey
View slide
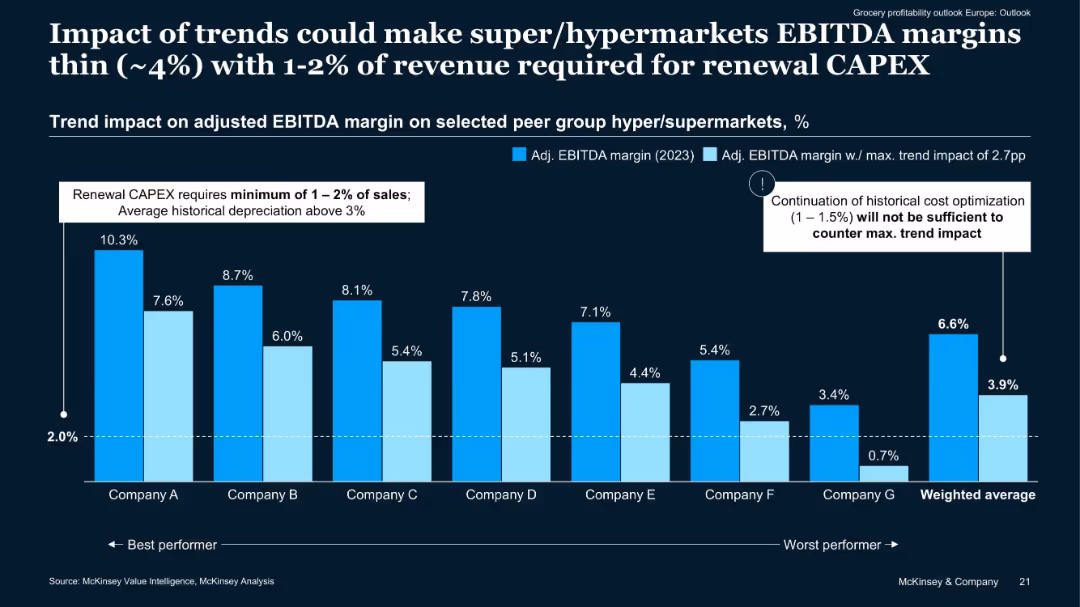
Clustered bar chart comparing 2023 adjusted EBITDA margins vs trend-adjusted margins across 7 companies.
Financial Performance
Retail & E-commerce
Demonstrates potential EBITDA margin erosion for hyper/supermarkets under current trends. Even high-performing companies could fall below sustainability thresholds unless new efficiencies are found. Renewal CAPEX adds further financial strain.
EBITDA margin, CAPEX, cost pressure, hypermarkets, financial outlook
false
Financial Performance
Retail & E-commerce retail-and-e-commerce
Single Chart
McKinsey
View slide
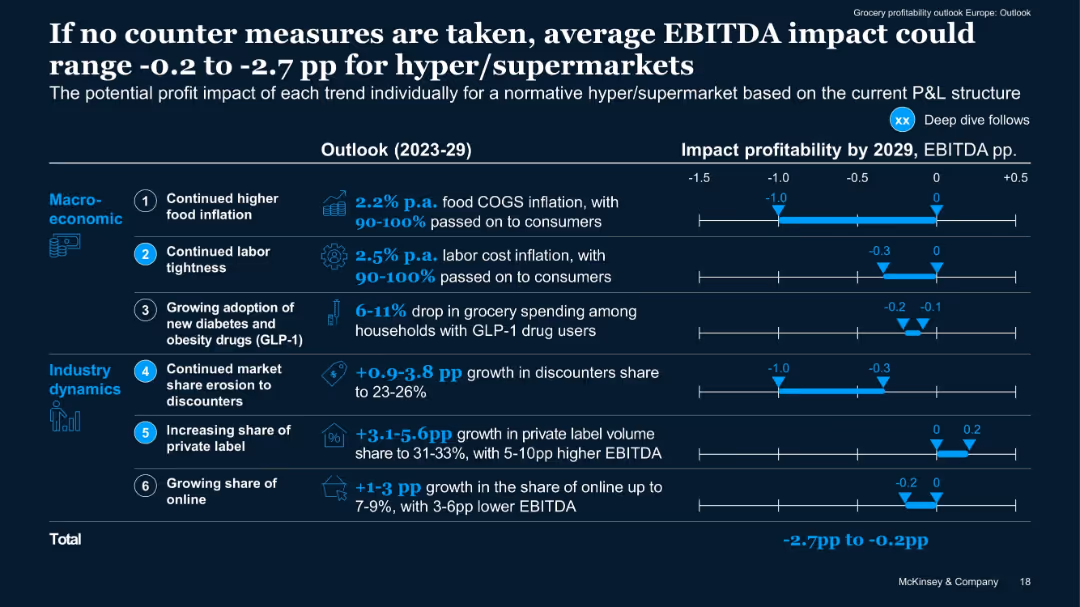
Horizontal bar impact chart quantifying EBITDA effect per trend from 2023–2029. Blue shaded bars show range.
Risk Assessment and Management
Retail & E-commerce
Quantifies potential downside to EBITDA if current trends continue without mitigation. Segments macroeconomic vs industry dynamics and provides projected ranges per trend. Total potential impact: -2.7pp to -0.2pp EBITDA.
EBITDA risk, impact forecast, industry dynamics, cost drivers, 2029
false
Risk Assessment and Management
Retail & E-commerce retail-and-e-commerce
Mixed Chart
McKinsey
Previous
Loading...
Hold On!
We are searching in our database
If nothing, comes up, please try different filters!
Column Chart
Heatmap
Chevron
Org Chart
Infographic
Callouts
Timeline
List
Graphic
Picture
Process Flow
Diagram
Paragraph
Map
Table
Framework
Subtitle
Takeaway Box
Icon
Other Chart
Radar Chart
Waterfall Chart
Mekko Chart
Pie Chart
Scatter Plot
Line Chart
Bar chart
Bullet points
Create a FREE account to continue browsing
Receive Instant Access to 1,000+ slides from companies like McKinsey, Google, and Goldman Sachs
First Name
Last Name
Email
Password
I agree to all
Terms & Privacy Policy
Thank you! Your submission has been received!
Oops! Something went wrong while submitting the form.
Have an account?
Sign in
Upgrade to PRO to Save slides
Advanced Search and Filters
Access to 15,000+ slides
Access to Category Pages
Save/Bookmark Slides
PowerPoint Template Library
Pick a Plan
MONTHLY
$12/month
Billed every month, Cancel anytime.
YEARLY
$9/year
Billed $108 annually, Cancel anytime.
Checkout for $12/month
Checkout for $108/yr
Secured by Stripe | AES-256 bit encryption