My Account
My Slides
Search by Category
Templates
View All Templates
Download Template Slides
Leave Feedback
Login
Logout
Get Started
Browse all Slides
Browse all Slides
Create a FREE Account
Instant access to 1,000+ real slides from top companies like McKinsey, BCG, Goldman Sachs, Google and many more!
First Name
Last Name
Email
Password
I agree to all
Terms & Privacy Policy
Thank you! Your submission has been received!
Oops! Something went wrong while submitting the form.
Have an account?
Sign in
Spark Your Next Big Idea with New Presentation Templates
VIEW ALL Templates
Welcome,
Welcome
PRO
Show Featured Only
Checkbox 8
Companies
Mckinsey
Bain
BCG
EY
Deloitte
Accenture
PwC/Strategy&
JP Morgan
Goldman Sachs
Morgan Stanley
Citigroup
Deutsche Bank
Barclays
LEK
KPMG
Kearney
Oliver Wyman
Booz Allen Hamilton
Gartner
IPSOS
Nielsen
Slide type
Text Only
Linear Flow
Vertical Flow
Single Chart
Header Horizontal
Mixed Chart
Header Vertical
Pillar
Multiple Chart
Graphic
Agenda
Title
Table
Framework
Industry
Technology & Software
Artificial Intelligence
Financial Services
Retail & E-commerce
Consumer Goods
Industrial & Manufacturing
Transportation & Logistics
Telecommunications
Real Estate & Construction
Hospitality & Tourism
Professional Services
Education & Training
Media & Entertainment
Agriculture & Food Production
Healthcare & Pharmaceuticals
Environmental Services & Sustainability
Government & Public Sector
Use Case
Mergers and Acquisitions
Performance Metrics and KPIs
Client Case Studies
Competitive Landscape
Corporate Finance and Valuation
Product and Service Analysis
Customer and Market Segmentation
Organizational Structure and Change
Industry Overview
Regulatory and Compliance
Risk Assessment and Management
Investment Analysis
Organizational Structure and Change
Human Resources and Talent Management
Financial Performance
Market Analysis and Trends
Sales and Business Development
Human Resources and Talent Management
Clear all
Thank you! Your submission has been received!
Oops! Something went wrong while submitting the form.
Tag
View slide
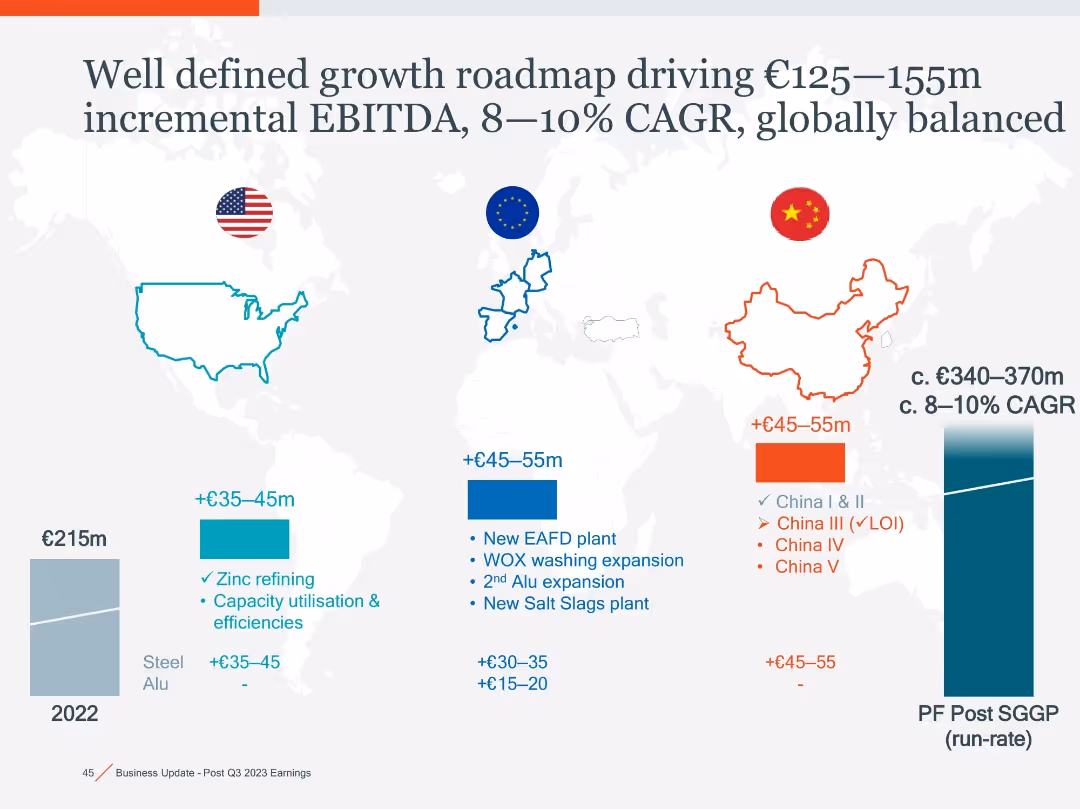
World map with regional callouts (US, EU, China) in color-coded boxes, bar charts showing EBITDA growth, CAGR curve at right side.
Strategic Planning
Industrial & Manufacturing
Outlines expected EBITDA growth across US, EU, and China from zinc refining, EAFD plants, and expansion projects, projecting €125–155m in incremental EBITDA and 8–10% CAGR globally.
EBITDA, CAGR, expansion, zinc refining, EAFD, global growth, EU, China, US
false
Strategic Planning
Industrial & Manufacturing industrial-and-manufacturing
Mixed Chart
Goldman Sachs
View slide
The slide contains a complex column and line chart, with the bars in multiple shades of blue representing EBITDA versus cash generated, and a line representing the percentage. There are also explanatory notes below the chart and a text block to the right detailing the conversion of EBITDA to cash flow.
Financial Performance
Financial Services
It offers an in-depth analysis of EBITDA relative to cash flow, including historical data and conversion rates, suitable for financial experts or stakeholders analyzing the company's financial efficiency and performance over time.
EBITDA, Cash Flow, Conversion, Financial Analysis, Historical Data, Operational Activities
false
Financial Performance
Financial Services financial-services
Single Chart
Goldman Sachs
View slide
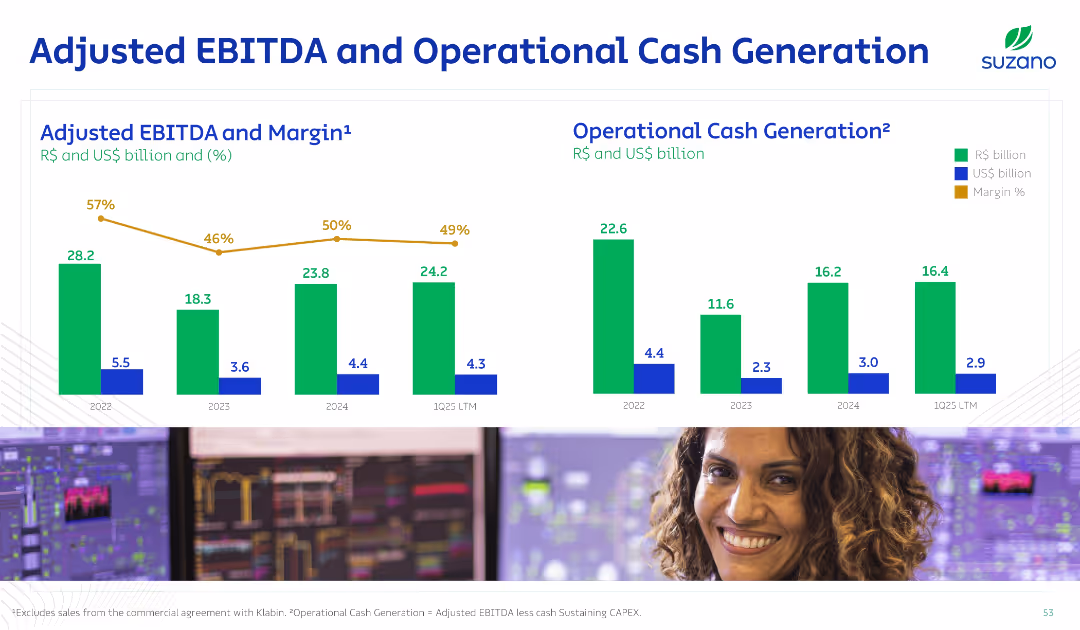
Two side-by-side bar charts for EBITDA and cash generation, with trend lines for margin %, using green for R$ and blue for US$; employee image at bottom.
Financial Performance
Consumer Goods
The slide presents Suzano's adjusted EBITDA and operational cash generation over four time periods, showing trends in profitability and operational efficiency. Margin percentages are highlighted, indicating financial resilience.
EBITDA, Cash Flow, Margin, Financials, Operations
false
Financial Performance
Consumer Goods consumer-goods
Single Chart
Goldman Sachs
View slide
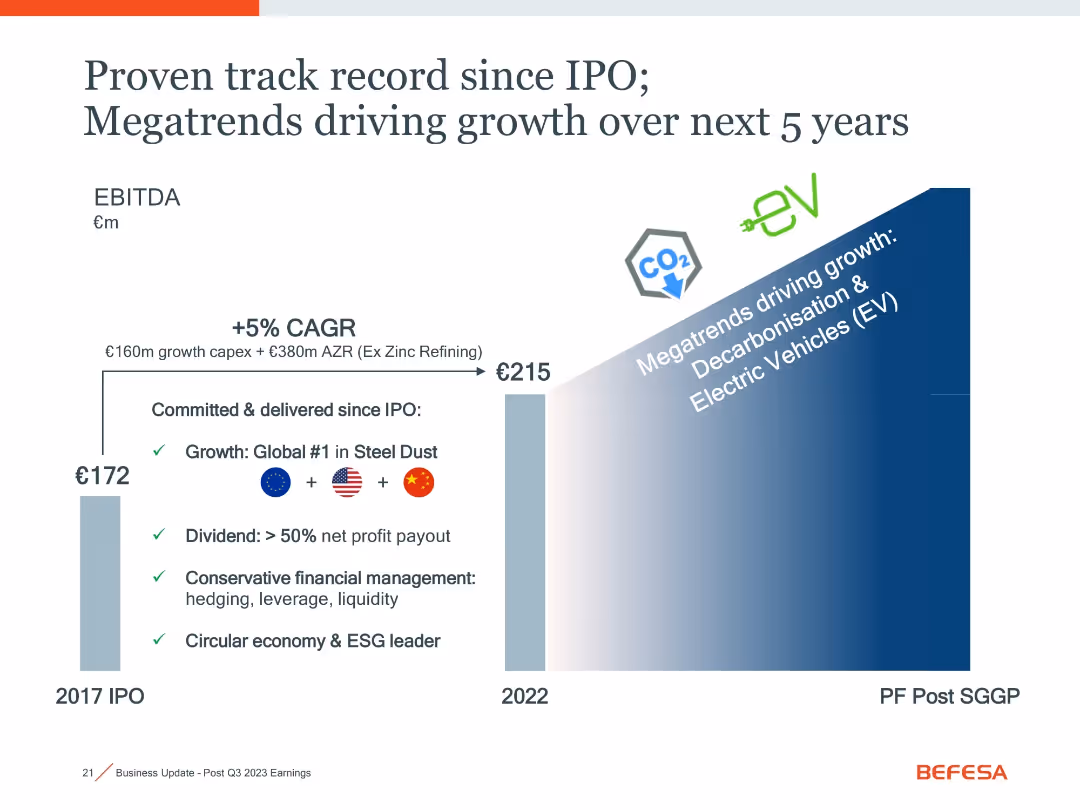
Bar chart showing EBITDA growth from 2017 to 2022 and future outlook, annotated with strategic highlights and trend icons (EV, CO2).
Financial Performance
Industrial & Manufacturing
This slide presents EBITDA growth since the company’s IPO, citing +5% CAGR and major strategic drivers like decarbonization and EV growth. It includes key financial management practices and market leadership in steel dust recycling.
EBITDA, IPO, CAGR, decarbonisation, EV, financial growth, steel dust
false
Financial Performance
Industrial & Manufacturing industrial-and-manufacturing
Single Chart
Goldman Sachs
View slide
The slide features a complex line chart tracking the EBITDA multiples over time for different industry sectors. There are four lines representing the medians for Food & Beverage, Industrials, Utilities, and Diversified sectors. Tables with key statistics are positioned at the top right.
Market Analysis and Trends
Technology & Software
This slide presents market performance data for process automation companies, indicating trading ranges of EBITDA multiples and comparing sectors. Useful for financial and market trend analysis.
EBITDA, Market Performance, Process Automation, Financial Analysis, Industry Comparison, Trading Ranges, Sector Median, Utilities, Industrials
false
Market Analysis and Trends
Technology & Software technology-and-software
Single Chart
LEK
View slide
A flow chart showing the relationship between product complexity and EBITDA margin across different industries.
Product and Service Analysis
Financial Services
Compares EBITDA margins for less complex and more complex products, highlighting the impact of technical support.
EBITDA, Product Complexity, Technical Support, Margins, Distribution
false
Product and Service Analysis
Financial Services financial-services
Linear Flow
EY
View slide
A column chart compares the EBITDA multiple of global education companies in 2013. A dashed line represents the typical valuation size of standalone education assets.
Financial Performance
Education & Training
The slide is used to compare the EBITDA multiples of various education companies, showcasing the superior returns offered by education platforms compared to the typical valuation of standalone assets. It's useful for demonstrating the financial advantages of investing in the education sector.
EBITDA, Returns, Investors, Education, Valuation, Companies, Comparison
false
Financial Performance
Education & Training education-and-training
Single Chart
EY
View slide
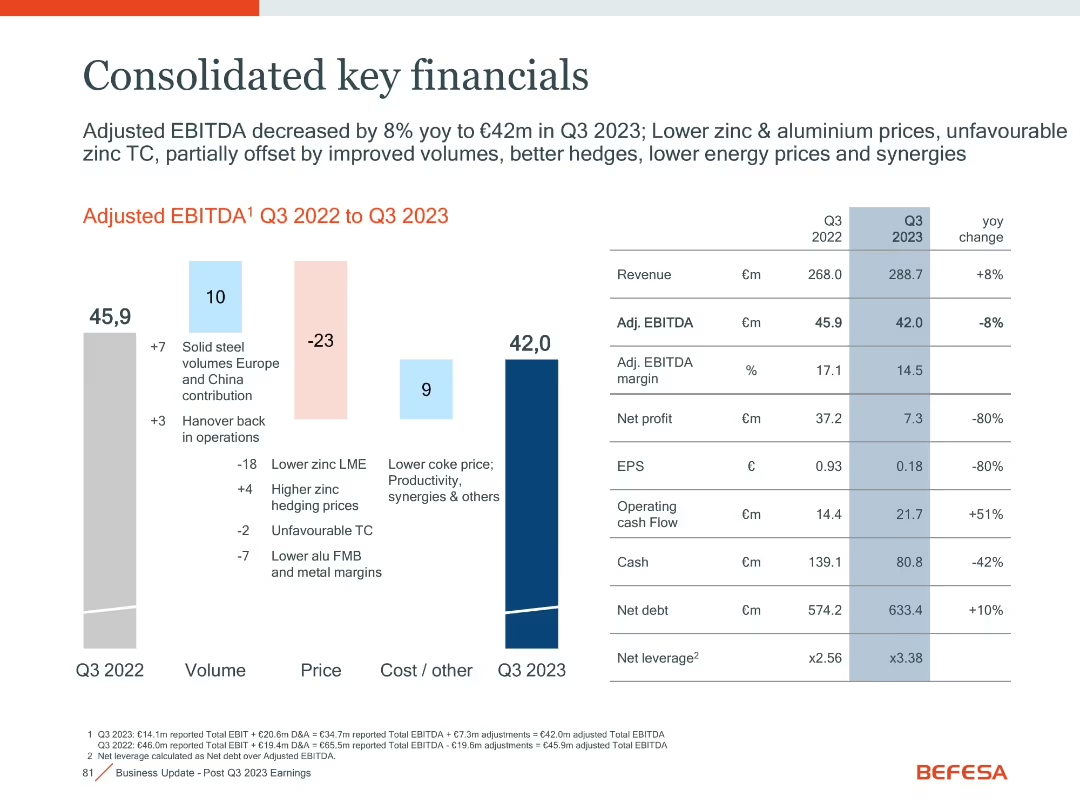
Waterfall chart on left; financial table on right
Financial Performance
Financial Services
This slide summarizes Befesa’s Q3 2023 financial performance, including revenue, EBITDA, cash flow, and profit metrics, with year-over-year comparisons.
EBITDA, Revenue, Cash Flow, Financials, Profit, Q3 2023
false
Financial Performance
Financial Services financial-services
Mixed Chart
Goldman Sachs
View slide
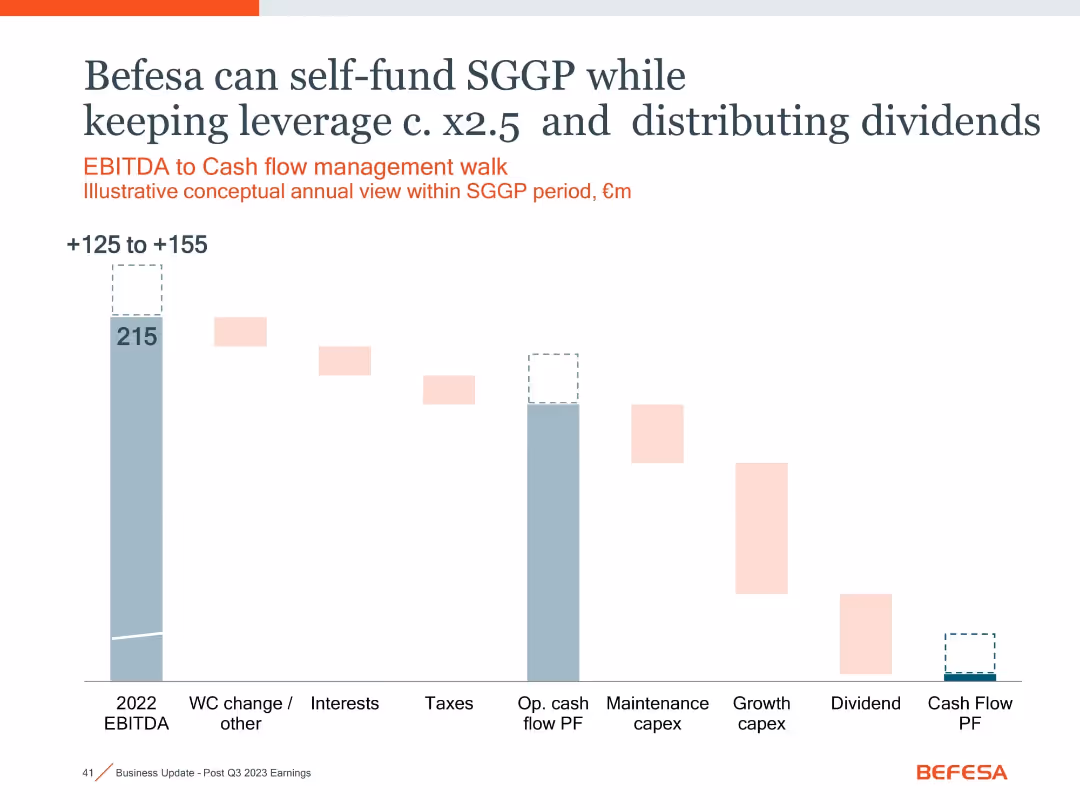
Waterfall chart showing EBITDA to cash flow use; pastel and gray blocks illustrate spending allocation
Financial Performance
Financial Services
Demonstrates Befesa's ability to self-fund SGGP investments with ~€125–155m from EBITDA while maintaining leverage and paying dividends. Covers operational and growth capex plus dividend flow.
EBITDA, cash flow, SGGP, dividends, leverage, capex, financial planning
false
Financial Performance
Financial Services financial-services
Single Chart
Goldman Sachs
View slide
Line graph showing the impact on EBITDA over time, comparing high performing transformations to median results.
Financial Performance
Financial Services
Evaluates the financial impact of high performing transformations on EBITDA over time.
EBITDA, financial, transformation, impact, performance
false
Financial Performance
Financial Services financial-services
Single Chart
McKinsey
View slide
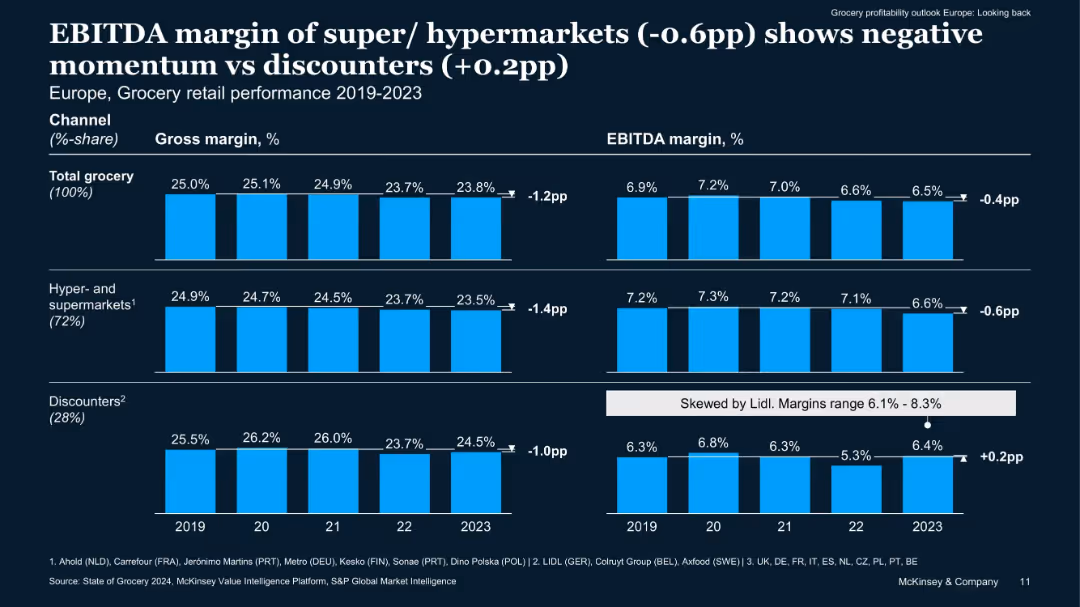
Dual-panel bar chart showing gross and EBITDA margins from 2019 to 2023 for total grocery, hyper/supermarkets, and discounters. Clean dark background with blue bars.
Financial Performance
Retail & E-commerce
The slide presents trends in gross and EBITDA margins for European grocery retail from 2019–2023, showing discounters improving margins while hypermarkets declined. The shift indicates a competitive advantage for discounters amid inflationary pressures.
EBITDA, gross margin, discounters, hypermarkets, trends, retail, Europe
false
Financial Performance
Retail & E-commerce retail-and-e-commerce
Multiple Chart
McKinsey
View slide
The slide displays a column chart depicting semi-annual EBITDA over multiple years. It includes a large blue circle highlighting a recent increase, with a clear and simple layout focusing on financial performance.
Financial Performance
Financial Services
This slide presents the EBITDA growth over the years, highlighting strong earnings growth, particularly in the most recent period. It's designed to communicate financial health and performance trends to stakeholders.
EBITDA, growth, financial performance, mining, earnings, profitability
false
Financial Performance
Financial Services financial-services
Single Chart
Morgan Stanley
View slide
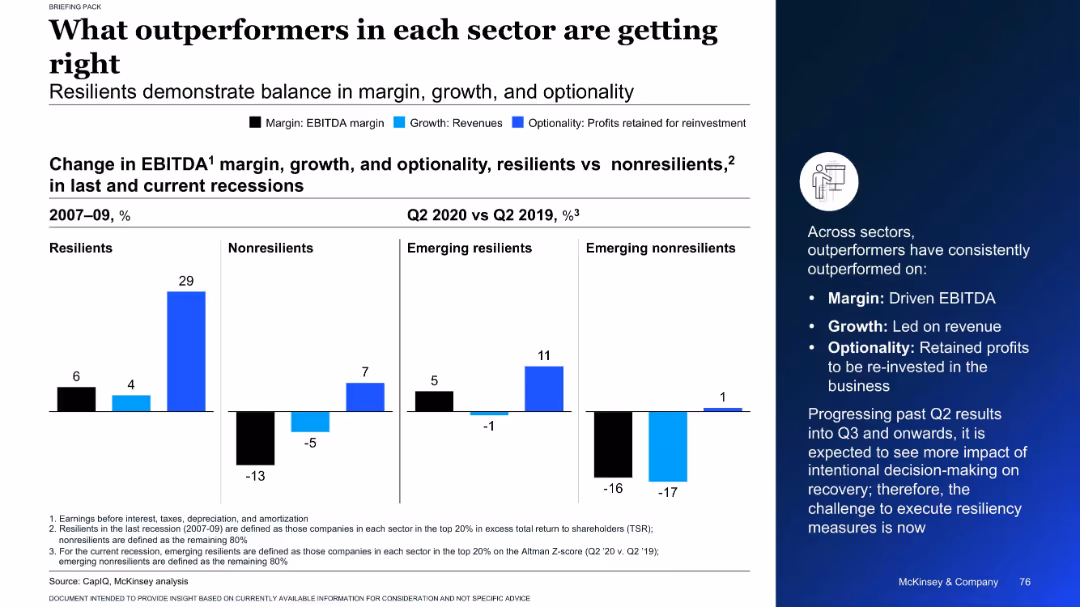
Split chart showing EBITDA, revenue, and reinvestment changes for resilient and non-resilient firms across recessions
Performance Metrics and KPIs
Professional Services
This slide highlights the traits of outperforming companies in past and current recessions. It compares resilient and non-resilient firms on margin, growth, and optionality, showing that resilient companies consistently excel in all three metrics.
EBITDA, growth, resilience, recession, company performance
false
Performance Metrics and KPIs
Professional Services professional-services
Mixed Chart
McKinsey
View slide
Bar graphs and case studies showcasing the EBITDA of market leaders in distribution, emphasizing the importance of relative market share (RMS).
Market Analysis and Trends
Financial Services
The slide demonstrates the correlation between high relative market shares and better performance in distribution businesses, using vehicle parts and safety equipment case studies.
EBITDA, market leaders, distribution, relative market share, RMS, vehicle parts, safety equipment
false
Market Analysis and Trends
Financial Services financial-services
Single Chart
EY
View slide
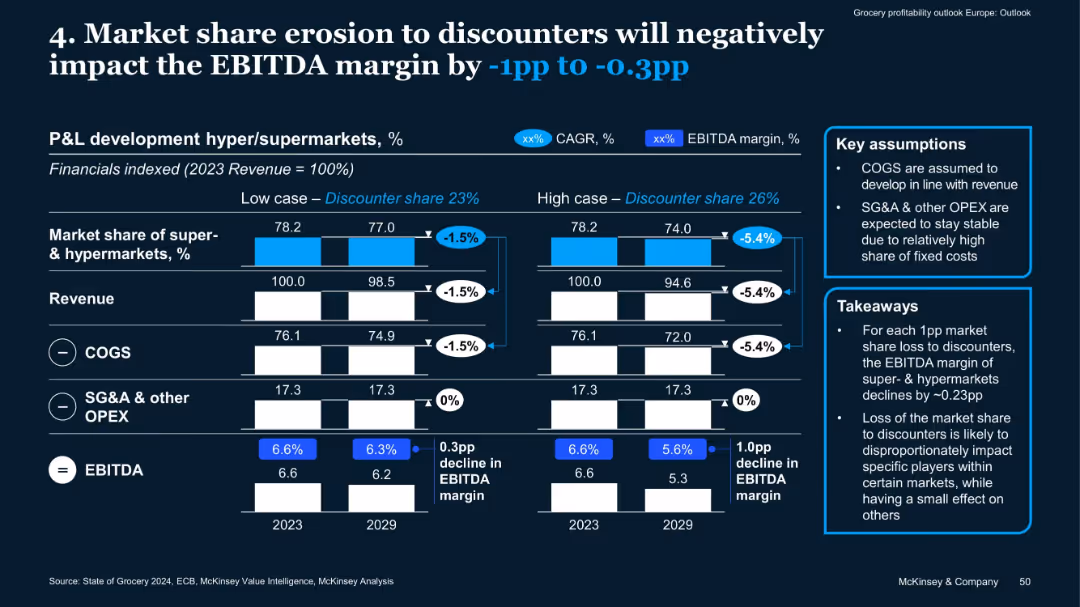
Dual scenario bar charts, revenue/COGS/SG&A breakdowns, key assumptions and takeaways in side boxes
Financial Performance
Retail & E-commerce
This slide analyzes how market share loss to discounters affects EBITDA margin of supermarkets/hypermarkets. In high and low scenarios, a 1–5.4% drop in revenue translates to 0.3–1.0pp EBITDA margin decline, driven mainly by lost volume.
EBITDA, market share, discounters, COGS, OPEX, revenue impact, margin
false
Financial Performance
Retail & E-commerce retail-and-e-commerce
Mixed Chart
McKinsey
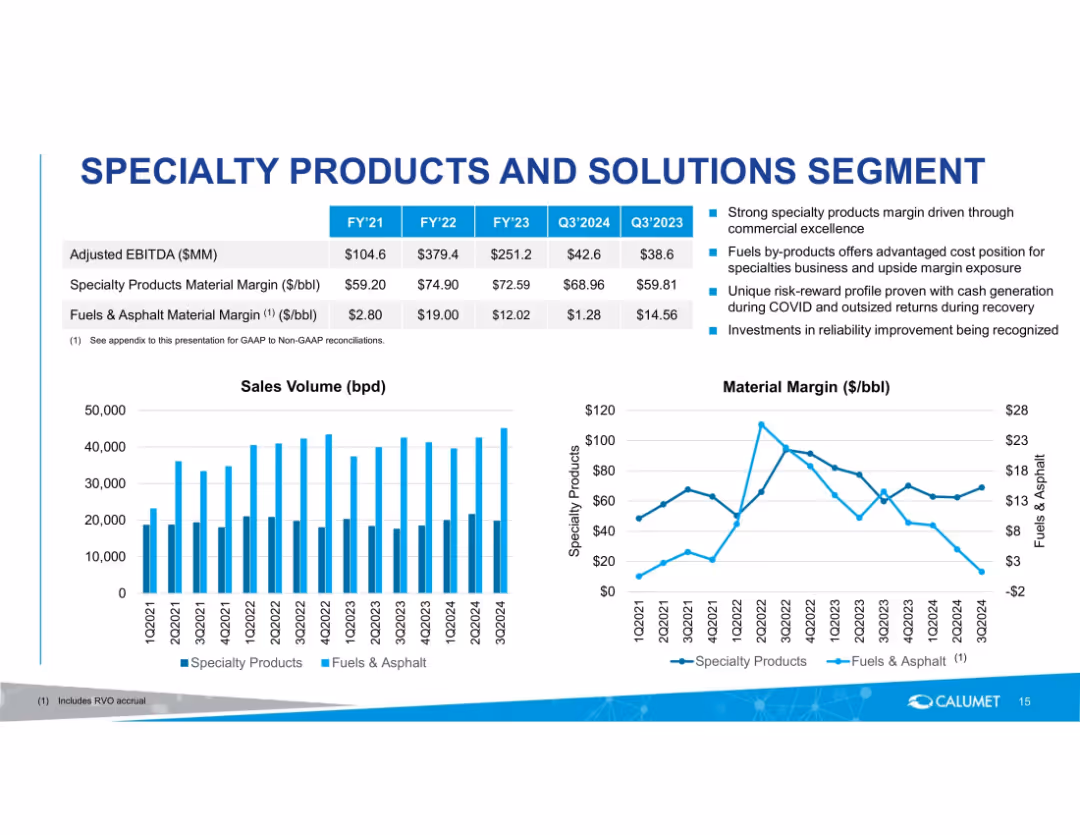
View slide
Two-panel slide with data tables, bullet points, and dual graphs (bar and line chart) on white background with blue accents.
Financial Performance
Energy & Utilities
Compares specialty and fuels & asphalt material margins across fiscal years and quarters. Highlights key performance drivers like commercial excellence, risk profiles, and investment impacts, with supporting sales and margin data.
EBITDA, material margin, sales volume, specialty products, fuels, asphalt, quarterly data, margin comparison, performance drivers
false
Financial Performance
Energy & Utilities energy-and-utilities
Multiple Chart
Goldman Sachs
View slide
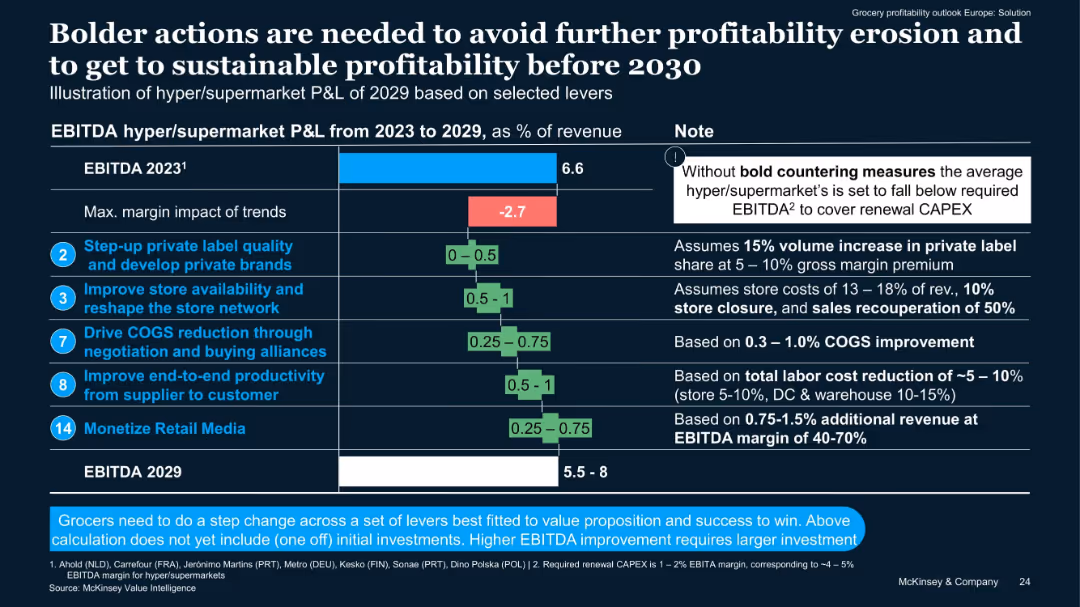
Horizontal bar chart with margin impacts, accompanied by numeric and note columns. Blue, green, and red color-coded bars.
Financial Performance
Retail & E-commerce
Shows projected EBITDA changes for hyper/supermarkets from 2023 to 2029 based on five key levers. Highlights a -2.7% margin trend risk without bold action, and outlines the potential upside of selected strategic initiatives.
EBITDA, private label, store network, COGS, productivity, retail media
false
Financial Performance
Retail & E-commerce retail-and-e-commerce
Mixed Chart
McKinsey
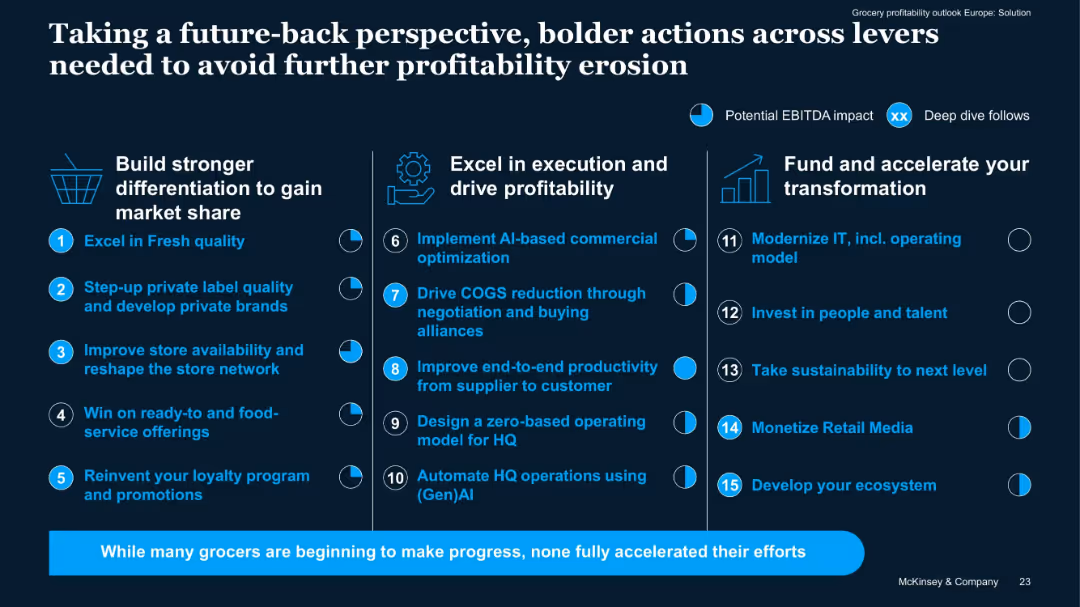
View slide
Three-column layout with icons and numbered action items. Blue and white on dark background. Circles highlight EBITDA impact and deep dives.
Strategic Planning
Retail & E-commerce
Outlines 15 action levers across three areas—differentiation, profitability, and transformation—to avoid profit erosion and drive future growth. Highlights areas with potential EBITDA impact and deep dives.
EBITDA, profitability, transformation, grocery, strategy, levers, AI, automation, IT, loyalty
false
Strategic Planning
Retail & E-commerce retail-and-e-commerce
Single Chart
McKinsey
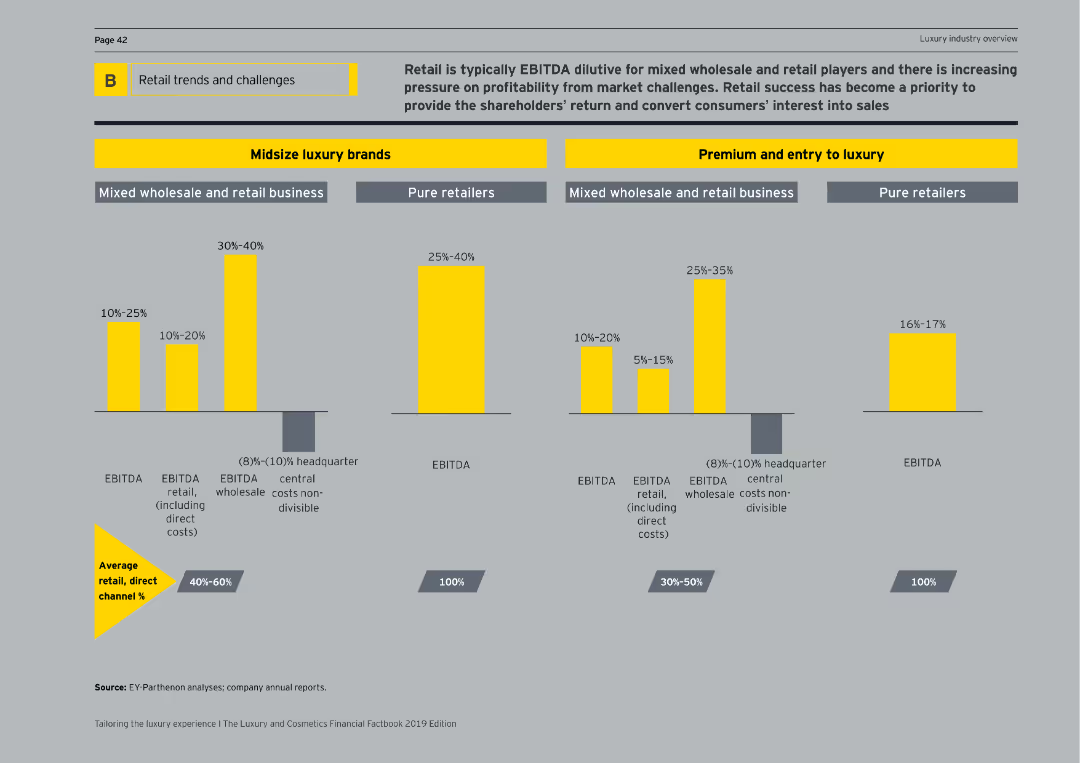
View slide
Displays various bar charts comparing EBITDA percentages for midsize luxury brands and premium/entry-to-luxury segments across different business models.
Market Analysis and Trends
Retail & E-commerce
Discusses the EBITDA impact on retail business models within midsize luxury brands and premium/entry-to-luxury segments, highlighting profitability.
EBITDA, retail business, luxury brands, premium, entry-to-luxury, profitability, business models, bar charts, market analysis
false
Market Analysis and Trends
Retail & E-commerce retail-and-e-commerce
Multiple Chart
EY
View slide
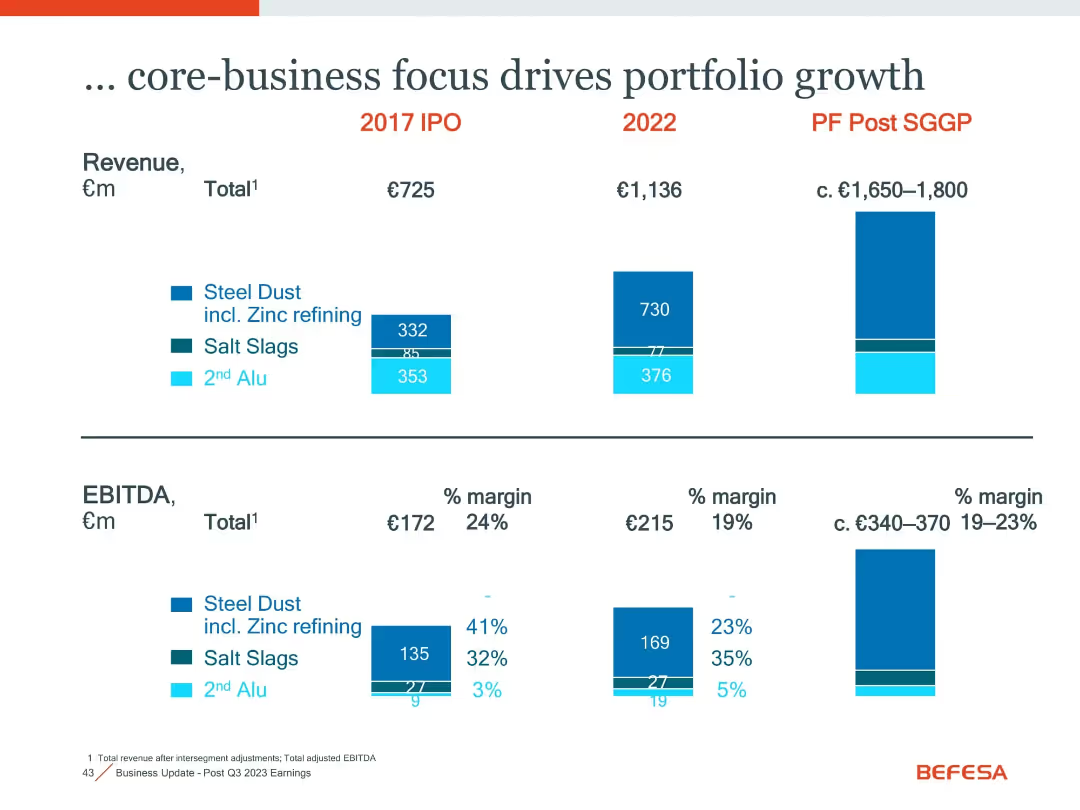
Bar charts showing revenue and EBITDA across 2017, 2022, and post-SGGP; includes % margins and segment splits
Strategic Planning
Financial Services
Highlights revenue and EBITDA growth by business segment over time. Shows strengthened steel dust focus and margin trends while maintaining balanced growth across salt slags and secondary aluminium.
EBITDA, revenue, core business, steel dust, salt slags, portfolio growth, SGGP
false
Strategic Planning
Financial Services financial-services
Multiple Chart
Goldman Sachs
View slide
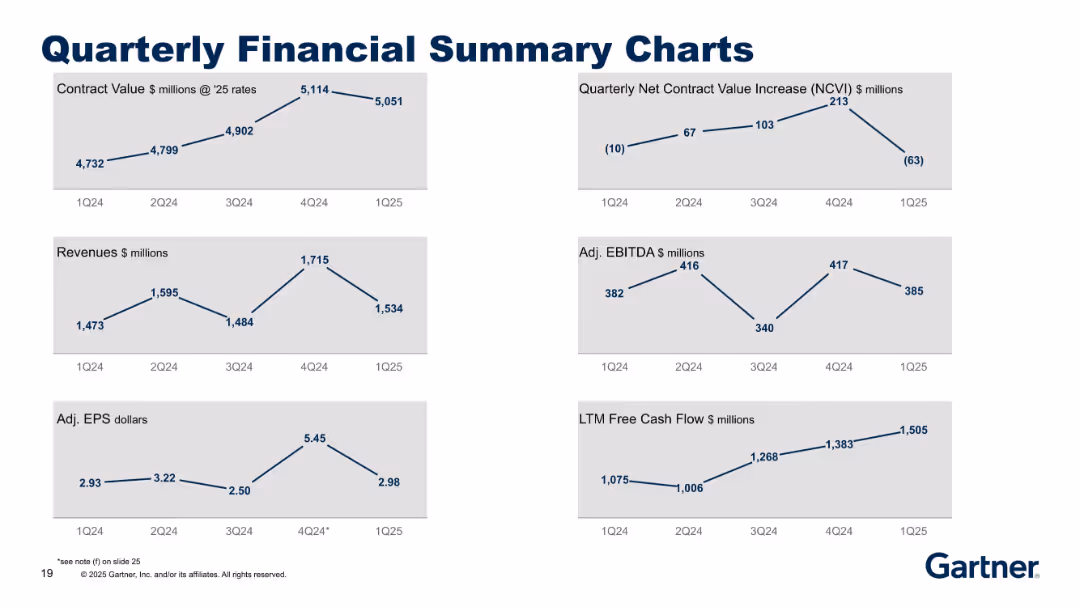
Grid of six line charts with a clean, minimalist design on a grey background, each showing quarterly data trends (1Q24–1Q25). Title is bold and centered at the top.
Financial Performance
Technology & Software
Presents Gartner's financial performance across six metrics: Contract Value, NCVI, Revenues, Adjusted EBITDA, Adjusted EPS, and LTM Free Cash Flow. Displays quarter-over-quarter trends to highlight financial health and changes in momentum.
EBITDA, revenue, earnings, contract value, cash flow, financial trends
false
Financial Performance
Technology & Software technology-and-software
Multiple Chart
Gartner
View slide
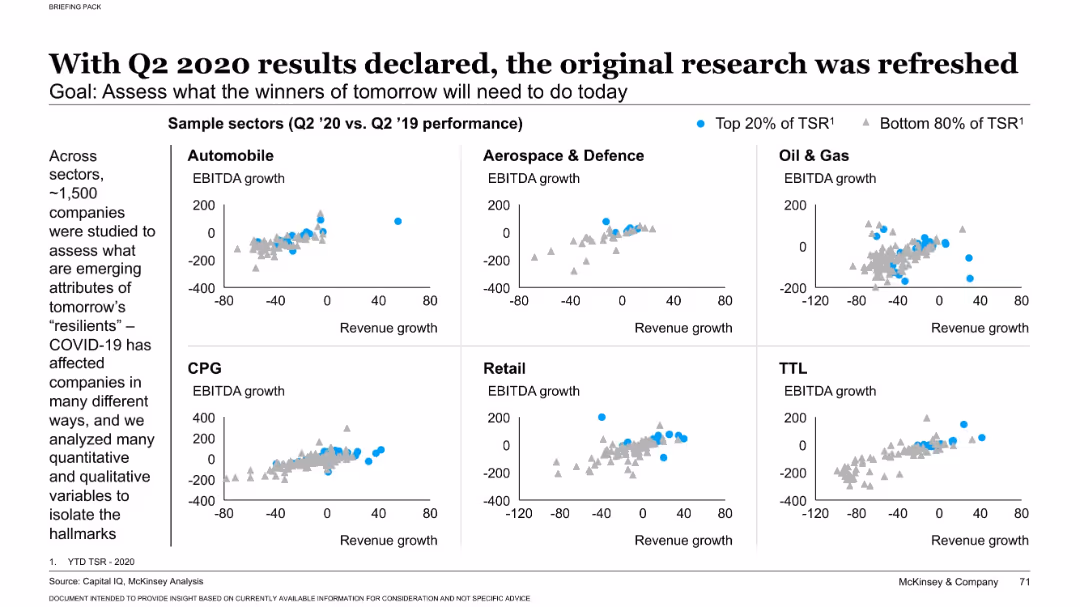
Left-aligned narrative; right grid of scatter plots by industry sectors showing EBITDA vs revenue growth
Performance Metrics and KPIs
Professional Services
This slide analyzes how companies across six sectors performed during COVID-19 by plotting revenue vs. EBITDA growth. Companies in the top 20% of Total Shareholder Return (TSR) are highlighted, showing emerging patterns among resilient firms post-pandemic.
EBITDA, revenue, sector performance, COVID-19 impact, TSR
false
Performance Metrics and KPIs
Professional Services professional-services
Multiple Chart
McKinsey
View slide
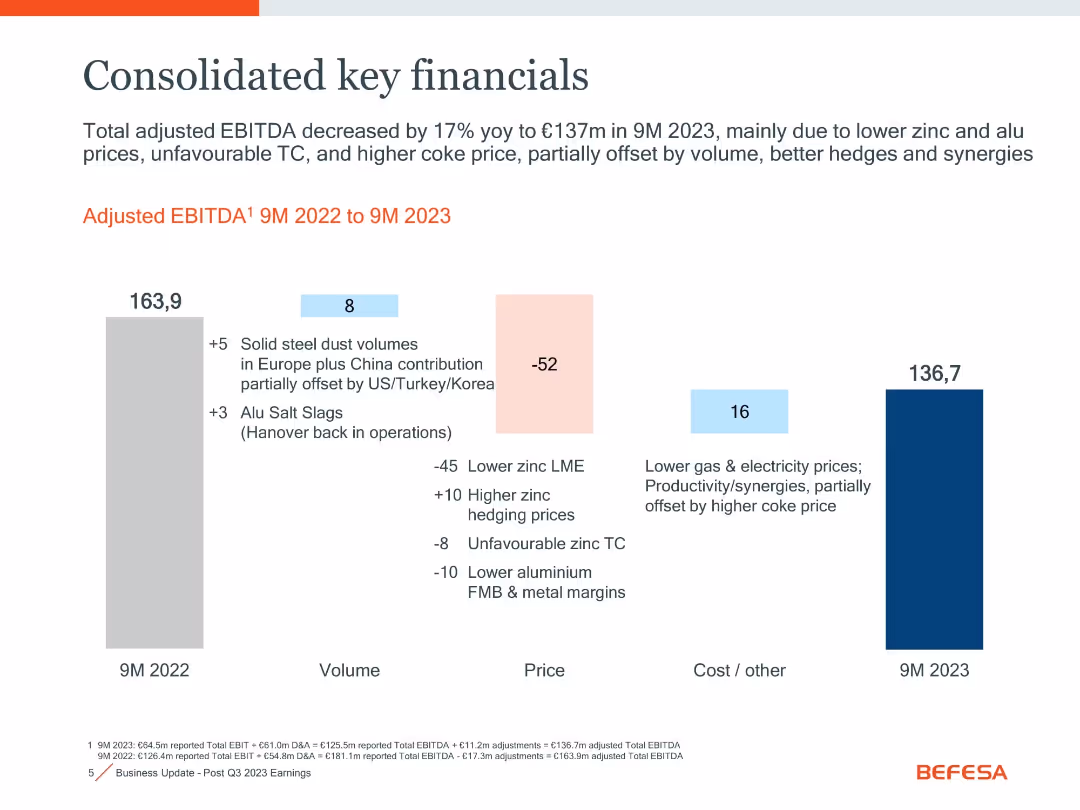
Bar chart with annotated vertical bars comparing 9M 2022 to 9M 2023 EBITDA, color-coded by volume, price, and cost/other factors
Financial Performance
Industrial & Manufacturing
The slide illustrates a 17% YoY decrease in adjusted EBITDA from €163.9m to €136.7m for 9M 2023. The drop is attributed to lower zinc/aluminium prices and unfavorable treatment charges, partially offset by volume and synergies.
EBITDA, zinc prices, aluminium, cost reduction, volume, hedging, synergy
false
Financial Performance
Industrial & Manufacturing industrial-and-manufacturing
Single Chart
Goldman Sachs
View slide
Bar chart waterfall showing EBITDA change from 9M 2022 to 9M 2023 with explanatory annotations, titled headers and summary at top.
Financial Performance
Industrial & Manufacturing
Shows 17% YoY decline in adjusted EBITDA to €137m in 9M 2023, attributed to lower zinc/aluminum prices and higher costs, partially offset by improved volumes, hedges, and synergies.
EBITDA, zinc prices, aluminum margins, hedging, synergies, YoY comparison
false
Financial Performance
Industrial & Manufacturing industrial-and-manufacturing
Single Chart
Goldman Sachs
View slide
This slide uses a combination of column charts and bar graphs to depict the relationships between investments, expenses, and earnings before tax (EBT) from 2017 through 2020. It utilizes a blue color scheme and includes concise textual explanations, making complex financial data more accessible.
Financial Performance
Financial Services
Analyzes the projected growth in earnings before tax (EBT) driven by a disciplined investment and expense strategy at Citigroup. It breaks down the factors contributing to EBT growth, such as revenue increases, expense management, and credit cost improvements, providing a clear visual guide to financial planning and expected outcomes.
EBT growth, financial planning, investment strategy, expense management, credit costs
false
Financial Performance
Financial Services financial-services
Single Chart
Citigroup
View slide
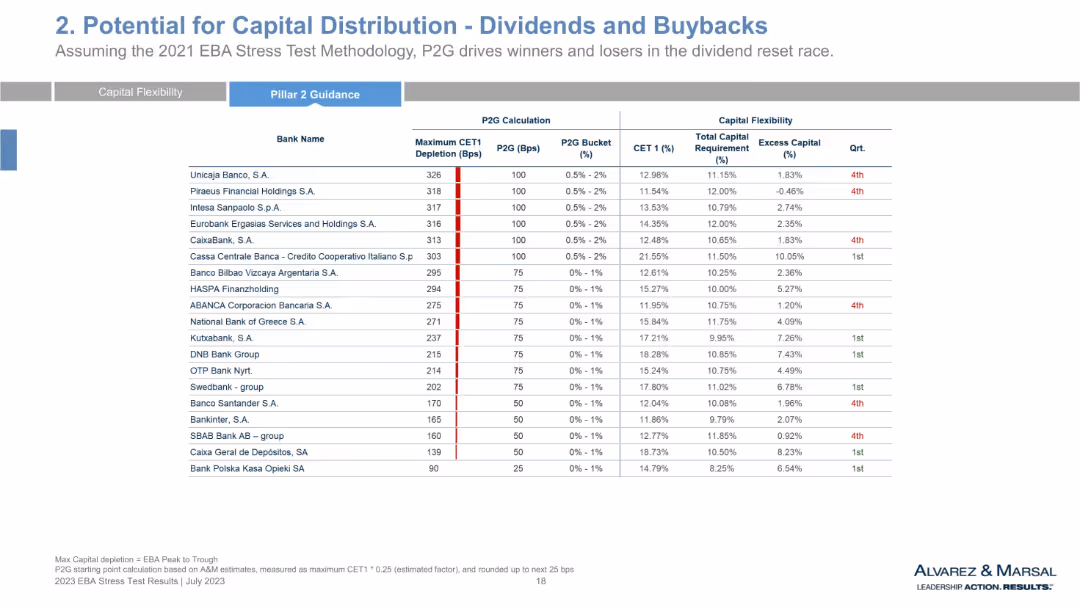
Final set of banks in same tabular format, concluding comparative data series across banks’ CET1 ratios, P2G, and capital flexibility.
Regulatory and Compliance
Financial Services
This slide wraps up the full list of banks assessed for potential capital distributions post-EBA stress test. It reinforces the framework from earlier slides, evaluating regulatory expectations against actual capital positions. The slide also reflects on the implications of P2G for dividends and buffer requirements.
ECB guidance, stress scenario, capital planning, CET1 levels, excess capital, resilience analysis, risk buffer
false
Regulatory and Compliance
Financial Services financial-services
Single Chart
Alvarez & Marsal
View slide
This slide includes a line chart illustrating ECB forecasts for core inflation versus actual outturns. The red line represents the forecast, while the multi-colored bars indicate different years' actual outturns. The slide includes a textual source reference.
Market Analysis and Trends
Financial Services
This slide shows the European Central Bank's core inflation forecasts in comparison to the actual figures, emphasizing the difference between projected and real outcomes. It is suitable for discussions on economic forecasting accuracy, policy decision-making, and the challenges of predicting inflation trends.
ECB, Inflation Forecasts, Economic Predictions, Core Inflation, EU, Bar Chart, Forecast Accuracy
false
Market Analysis and Trends
Financial Services financial-services
Single Chart
JP Morgan
View slide
Two line charts: left showing European Central Bank policy rate expectations and right showing European 10-year government bond spreads over Germany for countries like Italy, Spain, and France.
Regulatory and Compliance
Financial Services
The slide highlights European Central Bank policy rate expectations and government bond spreads, indicating monetary policy impacts and financial stability across different European countries.
ECB, policy rates, government bonds, Eurozone, financial stability
false
Regulatory and Compliance
Financial Services financial-services
Multiple Chart
JP Morgan
View slide
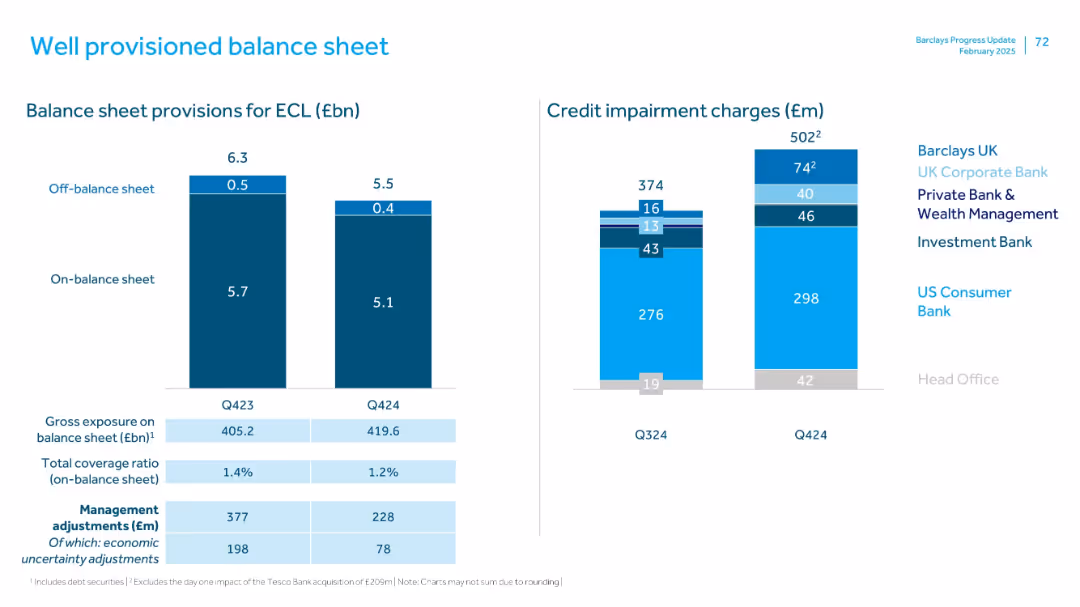
Dual charts: bar chart of ECL provisions and credit impairment charges; light blue/white color scheme, legends by division
Risk Assessment and Management
Financial Services
This slide outlines Barclays’ expected credit loss (ECL) provisions, segmented into on- and off-balance sheet amounts. It includes gross exposure, coverage ratios, and economic uncertainty adjustments. Credit impairment charges are broken down by division in stacked format.
ECL, balance sheet, credit impairment, provision, gross exposure, economic risk
false
Risk Assessment and Management
Financial Services financial-services
Multiple Chart
Barclays
View slide
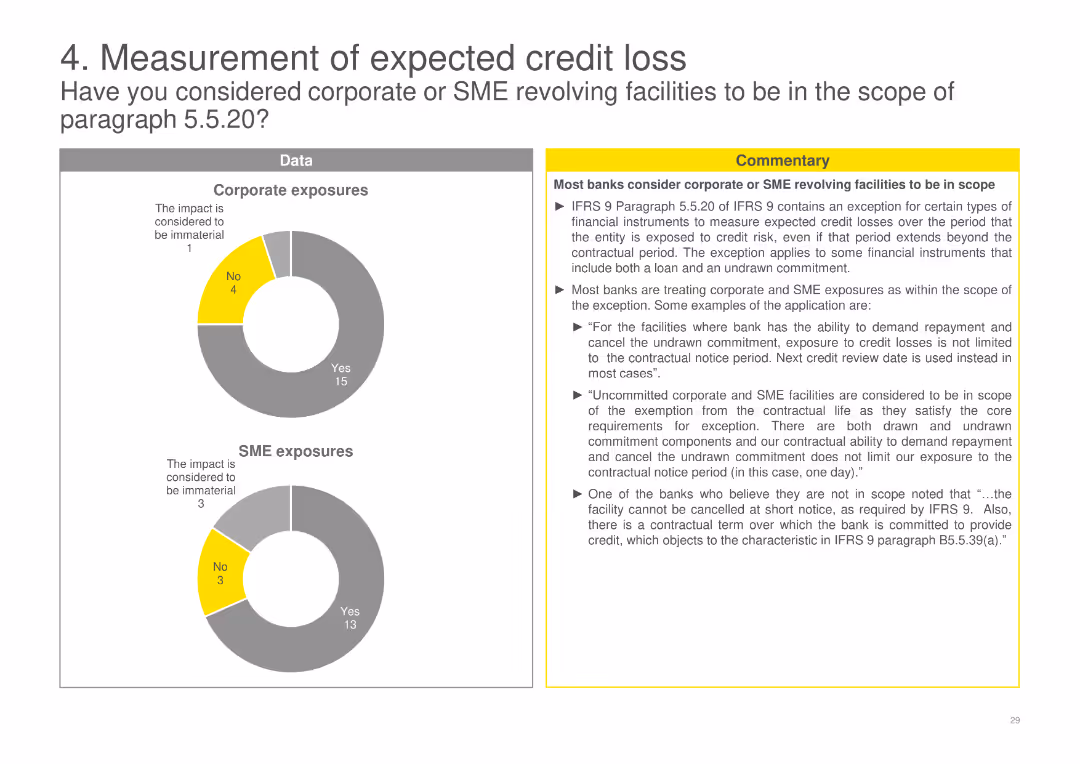
Pie charts depicting the consideration of corporate and SME revolving facilities within the scope of certain regulatory paragraphs, accompanied by detailed commentary.
Financial Performance
Financial Services
Discusses how banks consider corporate and SME revolving facilities within the scope of regulatory requirements, including specific examples and exceptions.
ECL, corporate, SME, revolving, facilities, scope, regulatory, banks, requirements, exceptions
false
Financial Performance
Financial Services financial-services
Multiple Chart
EY
Previous
Loading...
Hold On!
We are searching in our database
If nothing, comes up, please try different filters!
Column Chart
Heatmap
Chevron
Org Chart
Infographic
Callouts
Timeline
List
Graphic
Picture
Process Flow
Diagram
Paragraph
Map
Table
Framework
Subtitle
Takeaway Box
Icon
Other Chart
Radar Chart
Waterfall Chart
Mekko Chart
Pie Chart
Scatter Plot
Line Chart
Bar chart
Bullet points
Create a FREE account to continue browsing
Receive Instant Access to 1,000+ slides from companies like McKinsey, Google, and Goldman Sachs
First Name
Last Name
Email
Password
I agree to all
Terms & Privacy Policy
Thank you! Your submission has been received!
Oops! Something went wrong while submitting the form.
Have an account?
Sign in
Upgrade to PRO to Save slides
Advanced Search and Filters
Access to 15,000+ slides
Access to Category Pages
Save/Bookmark Slides
PowerPoint Template Library
Pick a Plan
MONTHLY
$12/month
Billed every month, Cancel anytime.
YEARLY
$9/year
Billed $108 annually, Cancel anytime.
Checkout for $12/month
Checkout for $108/yr
Secured by Stripe | AES-256 bit encryption