My Account
My Slides
Search by Category
Templates
View All Templates
Download Template Slides
Leave Feedback
Login
Logout
Get Started
Browse all Slides
Browse all Slides
Create a FREE Account
Instant access to 1,000+ real slides from top companies like McKinsey, BCG, Goldman Sachs, Google and many more!
First Name
Last Name
Email
Password
I agree to all
Terms & Privacy Policy
Thank you! Your submission has been received!
Oops! Something went wrong while submitting the form.
Have an account?
Sign in
Spark Your Next Big Idea with New Presentation Templates
VIEW ALL Templates
Welcome,
Welcome
PRO
Show Featured Only
Checkbox 8
Companies
Mckinsey
Bain
BCG
EY
Deloitte
Accenture
PwC/Strategy&
JP Morgan
Goldman Sachs
Morgan Stanley
Citigroup
Deutsche Bank
Barclays
LEK
KPMG
Kearney
Oliver Wyman
Booz Allen Hamilton
Gartner
IPSOS
Nielsen
Slide type
Text Only
Linear Flow
Vertical Flow
Single Chart
Header Horizontal
Mixed Chart
Header Vertical
Pillar
Multiple Chart
Graphic
Agenda
Title
Table
Framework
Industry
Technology & Software
Artificial Intelligence
Financial Services
Retail & E-commerce
Consumer Goods
Industrial & Manufacturing
Transportation & Logistics
Telecommunications
Real Estate & Construction
Hospitality & Tourism
Professional Services
Education & Training
Media & Entertainment
Agriculture & Food Production
Healthcare & Pharmaceuticals
Environmental Services & Sustainability
Government & Public Sector
Use Case
Mergers and Acquisitions
Performance Metrics and KPIs
Client Case Studies
Competitive Landscape
Corporate Finance and Valuation
Product and Service Analysis
Customer and Market Segmentation
Organizational Structure and Change
Industry Overview
Regulatory and Compliance
Risk Assessment and Management
Investment Analysis
Organizational Structure and Change
Human Resources and Talent Management
Financial Performance
Market Analysis and Trends
Sales and Business Development
Human Resources and Talent Management
Clear all
Thank you! Your submission has been received!
Oops! Something went wrong while submitting the form.
Tag
View slide
A graphical timeline illustrating significant ESG milestones from pre-2020 to 2024, marked with icons and brief descriptions of each achievement.
Strategic Planning
Financial Services
Outlines Barclays' progression in ESG initiatives over several years, demonstrating commitments like joining the Paris Pledge and setting new financing restrictions.
ESG, sustainability, strategic milestones, climate action, corporate responsibility, green financing
false
Strategic Planning
Financial Services financial-services
Linear Flow
Barclays
View slide
The slide includes a bar chart showing various actions organizations are taking to drive ESG transformation, such as adopting alternative energy sources and deploying advanced technologies. The bars are horizontal, indicating the percentage of respondents engaging in each action.
Operational Efficiency
Environmental Services & Sustainability
Explores the different initiatives companies are undertaking to enhance their sustainability practices. It reflects a comprehensive approach to ESG transformation encompassing energy use, supply chain reconfiguration, and staff upskilling, highlighting the multi-faceted nature of sustainable business practices.
ESG, sustainability, transformation, actions, 2023
false
Operational Efficiency
Environmental Services & Sustainability environmental-services-and-sustainability
Single Chart
PwC/Strategy&
View slide
This slide has a central Goldman Sachs logo with surrounding text describing different roles such as "Investor," "Business," "Operator," "Issuer," and "Employer." The layout is organized with clear, readable segments.
Strategic Planning
Government & Public Sector
It explains the role of Goldman Sachs' Sustainable Finance Group in mobilizing expertise to address clients' ESG needs. The slide is pertinent for discussing strategic planning and commercial opportunities within sustainable finance, detailing how the firm engages with various stakeholders.
ESG, sustainable finance, Goldman Sachs, strategic planning, expertise
false
Strategic Planning
Government & Public Sector government-and-public-sector
Framework
Goldman Sachs
View slide
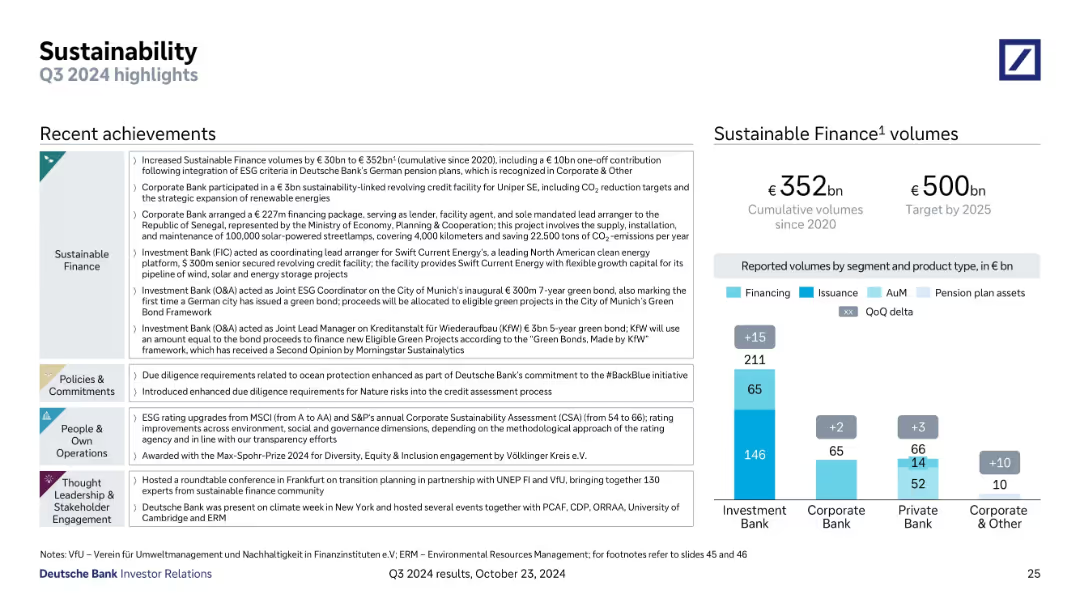
Two-part layout with bullet points of recent ESG achievements on the left and a bar chart on the right showing Sustainable Finance volumes by bank segment and type.
Regulatory and Compliance
Financial Services
Deutsche Bank reports sustainable finance progress, with €352bn cumulative volumes and a €500bn target by 2025. The slide showcases major deals, green bond arrangements, ESG ratings, and thought leadership activities. Volumes are segmented by bank division and asset type.
ESG, sustainable finance, green bond, volumes, CSR, climate, ESG ratings
false
Regulatory and Compliance
Financial Services financial-services
Mixed Chart
Deutsche Bank
View slide
A content slide featuring text on the left with two column charts on the right. The columns compare various ESG growth opportunities and tracking methods.
Risk Assessment and Management
Financial Services
The slide discusses banks' progress in sustainable finance and ESG, highlighting opportunities in ESG products and banks' early stages in tracking environment-related products.
ESG, sustainable finance, opportunities, risks, tracking
false
Risk Assessment and Management
Financial Services financial-services
Multiple Chart
EY
View slide
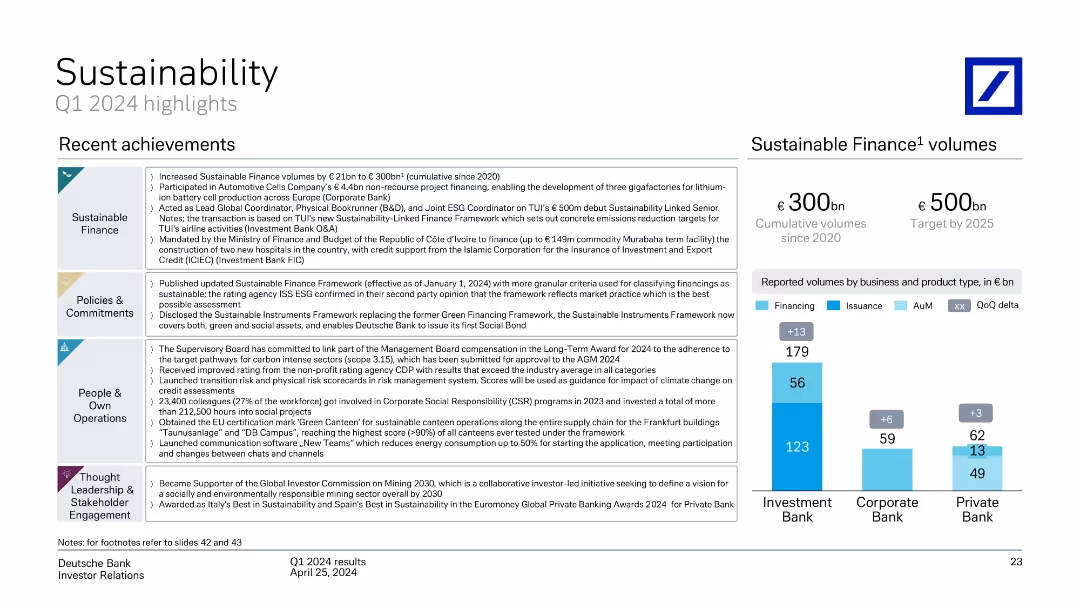
Multi-section slide: achievements grouped under themes; bar chart of sustainable finance volumes
Regulatory and Compliance
Financial Services
Provides highlights of Deutsche Bank’s Q1 2024 sustainability progress, including updated frameworks, ESG commitments, and €300bn in cumulative sustainable finance volumes. Initiatives span finance, governance, and social responsibility.
ESG, sustainable finance, policies, green loans, AuM, CDP, ISS ESG
false
Regulatory and Compliance
Financial Services financial-services
Mixed Chart
Deutsche Bank
View slide
The slide is divided into three columns comparing benefits of ESG in various categories, levels of ESG integration, and why companies are in the ESG game. It uses bar charts and percentages to compare different categories and their benefits.
Market Analysis and Trends
Environmental Services & Sustainability
The slide discusses the long-term value created by ESG initiatives, highlighting benefits like increased revenue, cost savings, and brand credibility. It also examines the integration levels of ESG in companies and the reasons behind their ESG initiatives.
ESG, value, benefits, integration, credibility
false
Market Analysis and Trends
Environmental Services & Sustainability environmental-services-and-sustainability
Multiple Chart
Kearney
View slide
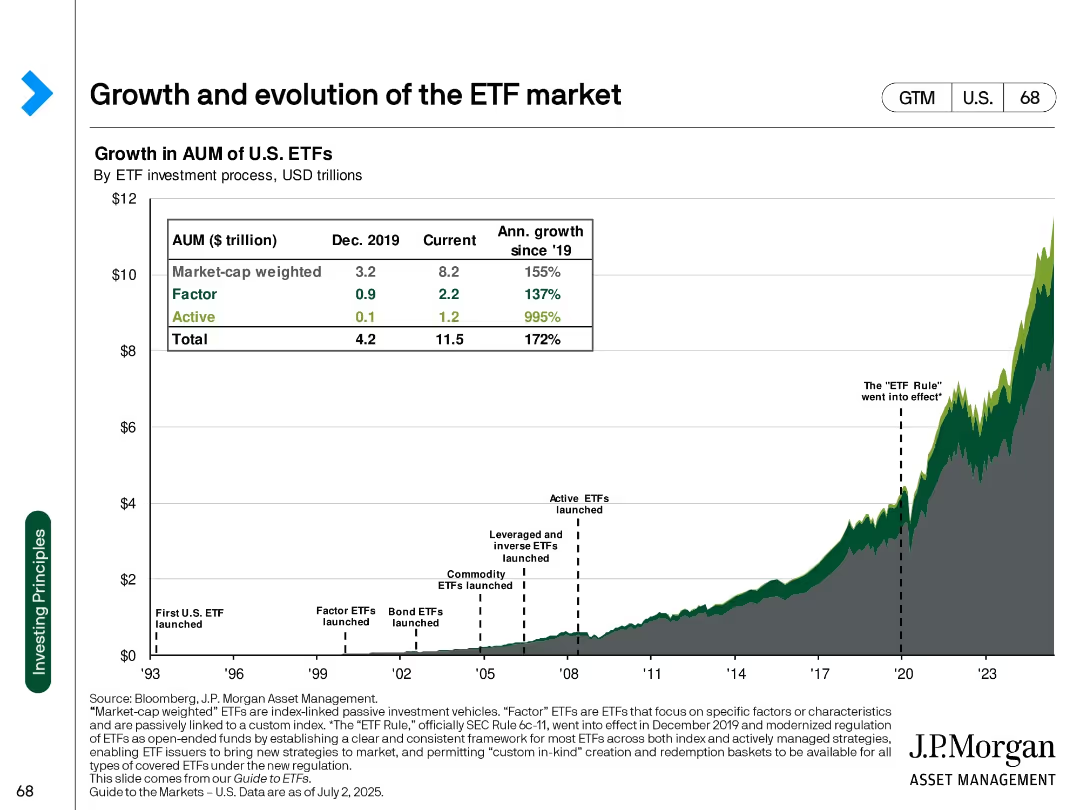
Line and area chart with annotation markers, table overlay showing AUM growth across ETF types
Market Analysis and Trends
Financial Services
Illustrates the historical growth of U.S. ETFs by investment strategy (market-cap weighted, factor, active) with notable regulatory milestones and growth metrics.
ETF, AUM, passive investment, market-cap, growth, regulation, active ETFs, factor, J.P. Morgan, U.S. market
false
Market Analysis and Trends
Financial Services financial-services
Single Chart
JP Morgan
View slide
The slide is divided into two sections, one for Canadian provinces and another for US states, each with a table listing ETS policies. The left section has a map with marked regions, and the tables include multiple columns with data.
Regulatory and Compliance
Government & Public Sector
This slide presents the status of Emission Trading System (ETS) policies in various Canadian provinces and US states, including the year of implementation, price per ton of CO2, and the status of the policy (operational, scheduled, or suspended).
ETS, Canada, US, state-level, policies, regulations
false
Regulatory and Compliance
Government & Public Sector government-and-public-sector
Table
Kearney
View slide
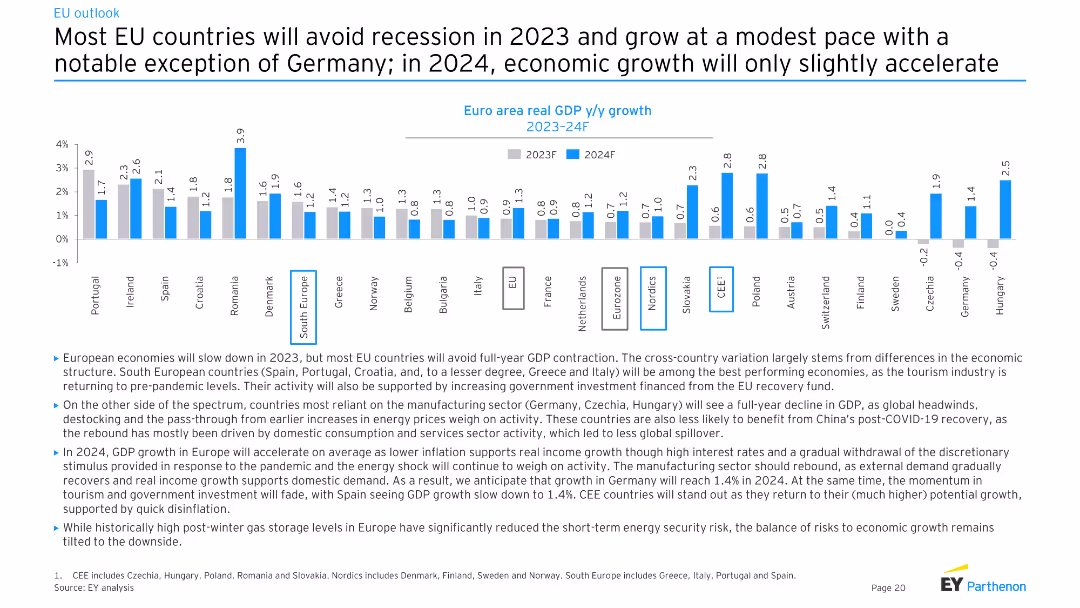
The slide features a column chart showing euro area real GDP y/y growth for 2023F and 2024F across various EU countries.
Market Analysis and Trends
Financial Services
This slide discusses the economic outlook for the EU, predicting most countries will avoid recession in 2023 and experience modest growth in 2024, with variations across different countries.
EU economy, GDP growth, recession, 2023, 2024
false
Market Analysis and Trends
Financial Services financial-services
Mixed Chart
EY
View slide
The slide features two line charts: one for European gas reserves from 2019 to 2023, and another for EU gas prices from Jan 2019 to Jan 2023.
Market Analysis and Trends
Energy & Utilities
The slide analyzes the levels of EU gas reserves and the trends in gas prices, focusing on supply pressures and rebuilding challenges.
EU gas, reserves, prices, energy, natural gas, market trends
false
Market Analysis and Trends
Energy & Utilities energy-and-utilities
Multiple Chart
Accenture
View slide
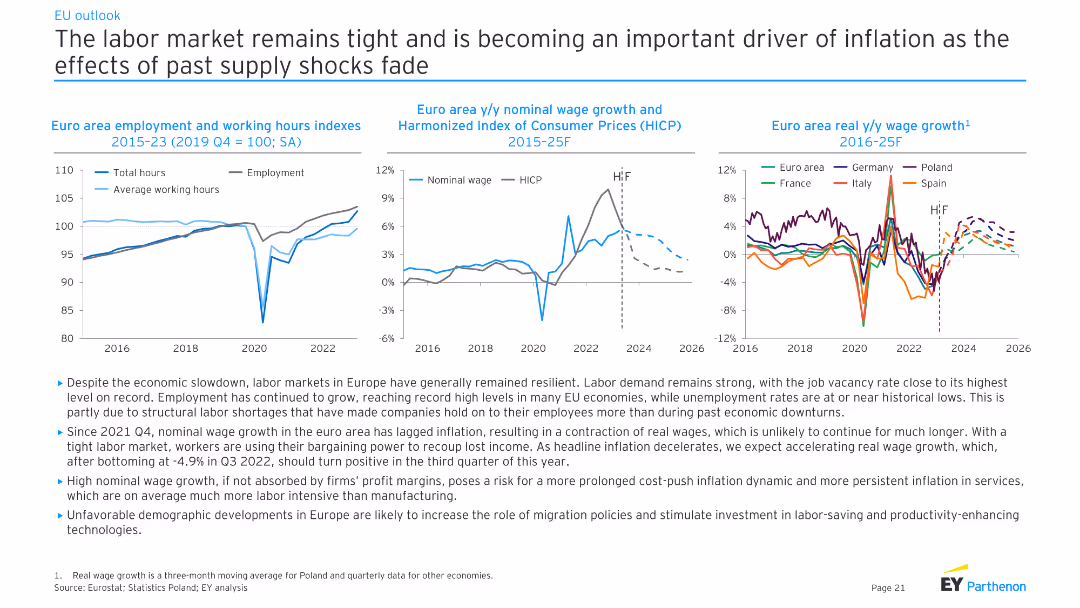
This slide contains three line charts showing employment and working hours indexes, nominal wage growth vs. HICP, and real wage growth across EU countries from 2015 to 2025. The text discusses the tight labor market and wage trends.
Market Analysis and Trends
Financial Services
The slide analyzes the tight labor market in the EU, highlighting employment growth, wage trends, and structural labor shortages. It discusses the implications of these trends for inflation and economic stability in the region.
EU labor market, wage growth, employment trends, inflation impact, structural shortages, economic stability, financial analysis, EY analysis
false
Market Analysis and Trends
Financial Services financial-services
Multiple Chart
EY
View slide
Column chart showing negative to positive impacts of EU politics on US investments in France, accompanied by authoritative quotes.
Strategic Planning
Government & Public Sector
Discusses the investment climate in France influenced by European political uncertainties and the strategies suggested by experts.
EU politics, US investments, France, political uncertainties, Merkel, Italian budget
false
Strategic Planning
Government & Public Sector government-and-public-sector
Mixed Chart
Bain
View slide
This slide combines bullet points and icons to highlight agricultural priorities and new EU strategies. The layout is straightforward, using icons and brief descriptions to clearly communicate key strategies.
Strategic Planning
Agriculture & Food Production
Focuses on strategic changes in agriculture for sustainability, including the Biodiversity Strategy and the Farm to Fork Strategy under the European Green Deal, aiming for a sustainable competitive food system.
EU strategies, agriculture, biodiversity, sustainability, food system
false
Strategic Planning
Agriculture & Food Production agriculture-and-food-production
Header Vertical
Deloitte
View slide
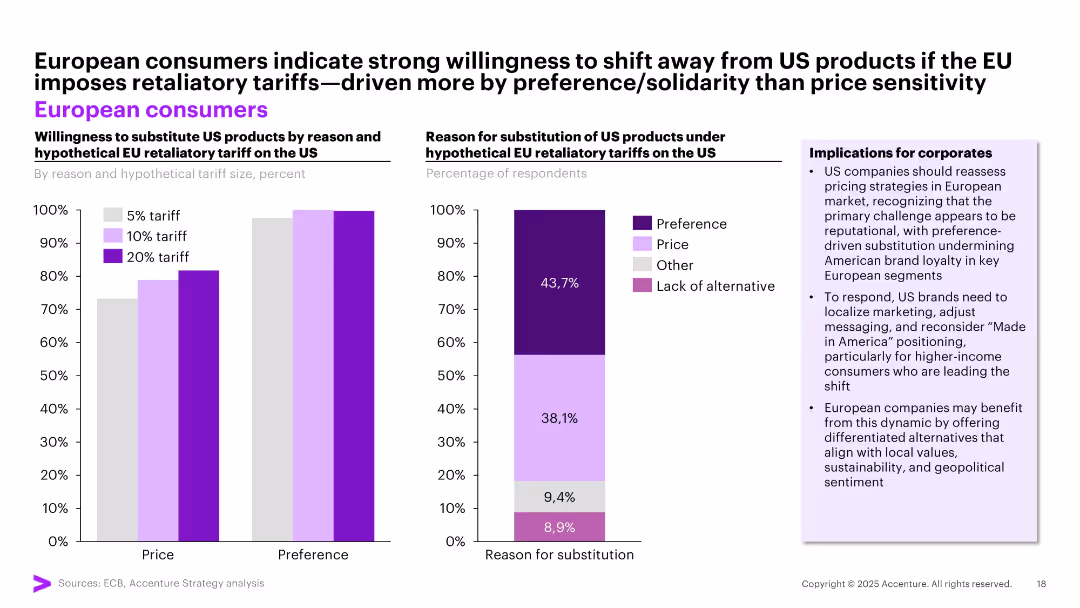
Dual chart layout showing willingness to substitute US products under tariff scenarios (left) and reasons for substitution (right); bar and stacked bar visuals; implications in side panel.
Strategic Planning
Retail & E-commerce
The slide shows that European consumers are highly likely to substitute US products if tariffs are imposed, mainly due to brand preference rather than price. This trend signals reputational risk for US brands and opportunity for localized EU branding.
EU tariffs, substitution, brand preference, pricing, reputation risk, US products
false
Strategic Planning
Retail & E-commerce retail-and-e-commerce
Multiple Chart
Accenture
View slide
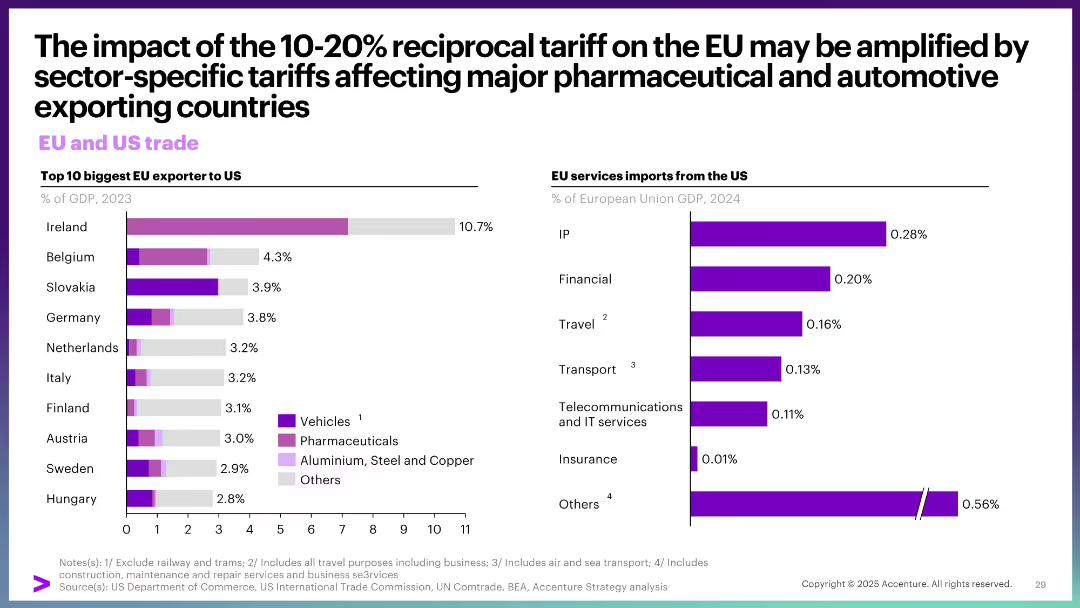
Left: bar chart of top EU exporters to US (% of GDP). Right: bar chart on EU services imports from US. Simple layout, dual visual focus.
Market Analysis and Trends
Government & Public Sector
This slide explores trade dependencies between the EU and US. It highlights the EU countries most exposed to the US through exports and the sectors affected by tariffs, notably pharmaceuticals and autos. It also details the composition of EU imports of US services.
EU trade, US tariffs, exports, pharmaceuticals, vehicles, GDP share, services
false
Market Analysis and Trends
Government & Public Sector government-and-public-sector
Multiple Chart
Accenture
View slide
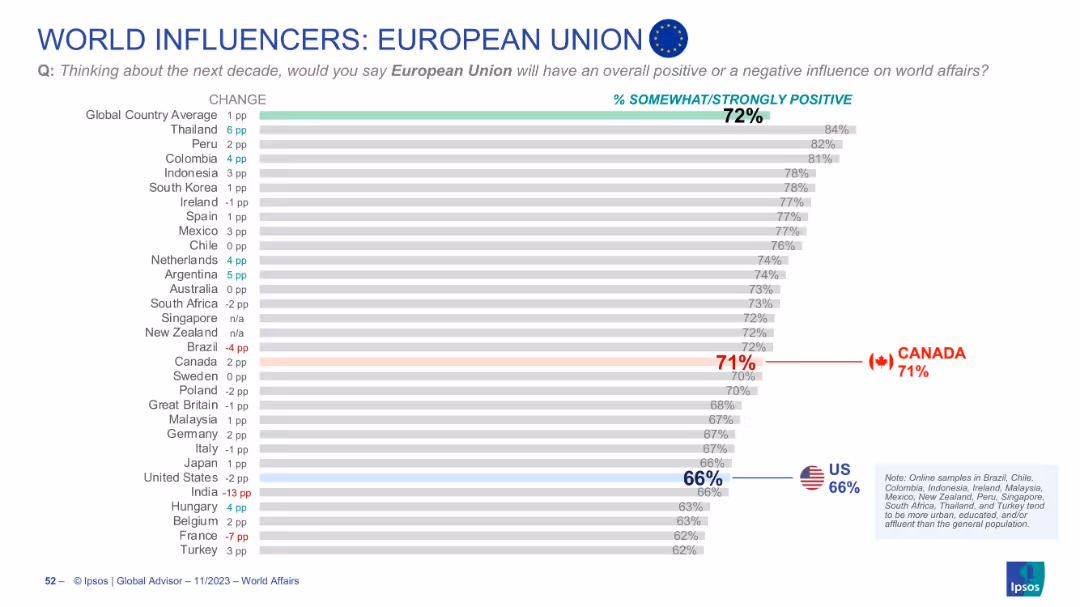
Horizontal bar chart showing perceptions of the EU; Canada and U.S. positions are highlighted
Market Analysis and Trends
Government & Public Sector
Shows international perceptions of the EU’s influence in the next decade. The global average is 72%. Canada scores it at 71% and the U.S. at 66%. Trends and change vs prior year are also depicted.
EU, European Union, world influence, Canada view, US view, Ipsos, international opinion, bar chart, perception, global affairs
false
Market Analysis and Trends
Government & Public Sector government-and-public-sector
Single Chart
IPSOS
View slide
Slide with a process timeline and funding source breakdown, including bar and line graphics to represent stages from pre-commercial development to market roll-out.
Market Analysis and Trends
Energy & Utilities
Discusses the EU’s support mechanisms for hydrogen technology through various funding stages, from proof of concept to market readiness, highlighting different EU funding sources.
EU, Funding, Hydrogen, Innovation, Scale-up
false
Market Analysis and Trends
Energy & Utilities energy-and-utilities
Linear Flow
McKinsey
View slide
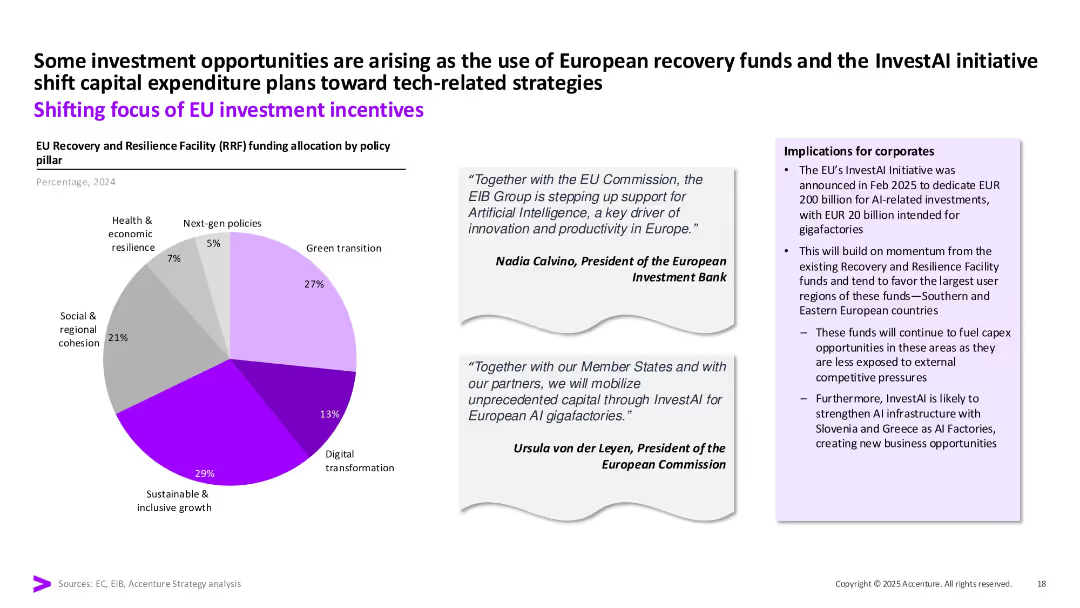
Pie chart displaying 2024 RRF fund allocation. Quotes from EU leaders and a box listing implications for corporates. Soft color palette with purple highlights.
Strategic Planning
Government & Public Sector
This slide details the EU’s policy-driven capex focus via Recovery and Resilience Facility funding. It emphasizes digital transformation and AI initiatives like InvestAI, which mobilizes EUR 200B for gigafactories, particularly in Southern and Eastern Europe.
EU, RRF, InvestAI, digital transformation, green transition, funding
false
Strategic Planning
Government & Public Sector government-and-public-sector
Mixed Chart
Accenture
View slide
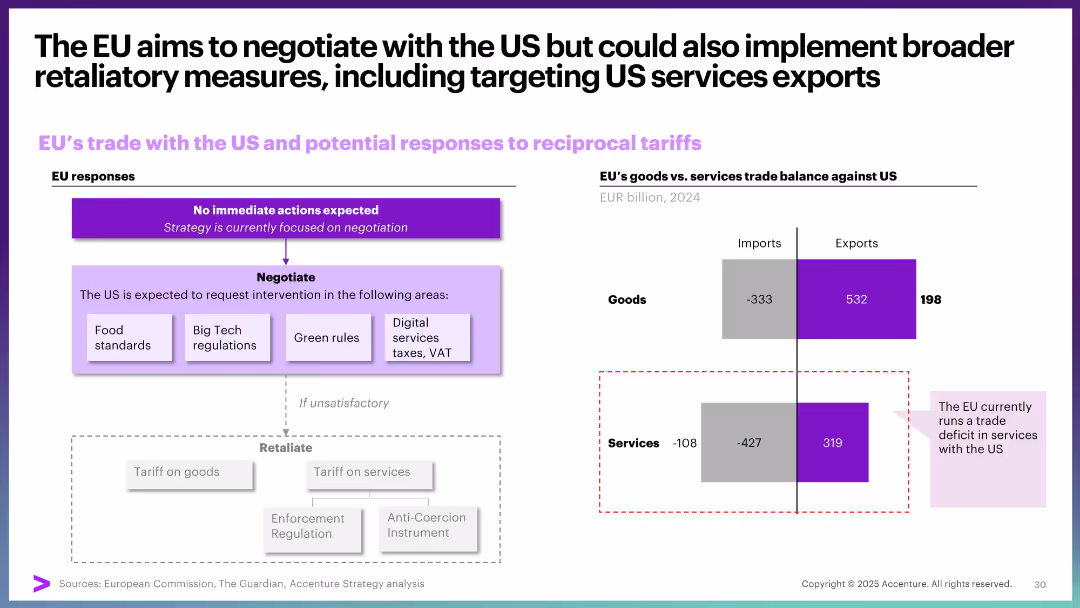
Flowchart on EU response strategies and bar chart on trade balance by goods and services. Structured for comparison.
Regulatory and Compliance
Government & Public Sector
The slide outlines EU’s strategic options in response to US tariffs. It includes negotiation paths and potential retaliation mechanisms, with a focus on the trade imbalance—goods surplus vs. services deficit.
EU, US tariffs, trade balance, negotiation, services deficit, retaliation strategy
false
Regulatory and Compliance
Government & Public Sector government-and-public-sector
Mixed Chart
Accenture
View slide
The slide presents a three-phase roadmap for the EU's hydrogen strategy up to 2050, using a horizontal timeline format with three distinct columns for each phase. The slide includes icons, a bullet list for each phase's details, and phase headers.
Strategic Planning
Energy & Utilities
This slide outlines the European Union's hydrogen strategy, focusing on the development of a renewable hydrogen mass market through three phases: initial market launch, scaling up, and mass market deployment.
EU, hydrogen, strategy, renewable, market, phases, 2020-2050, roadmap, decarbonize, infrastructure
false
Strategic Planning
Energy & Utilities energy-and-utilities
Mixed Chart
McKinsey
View slide
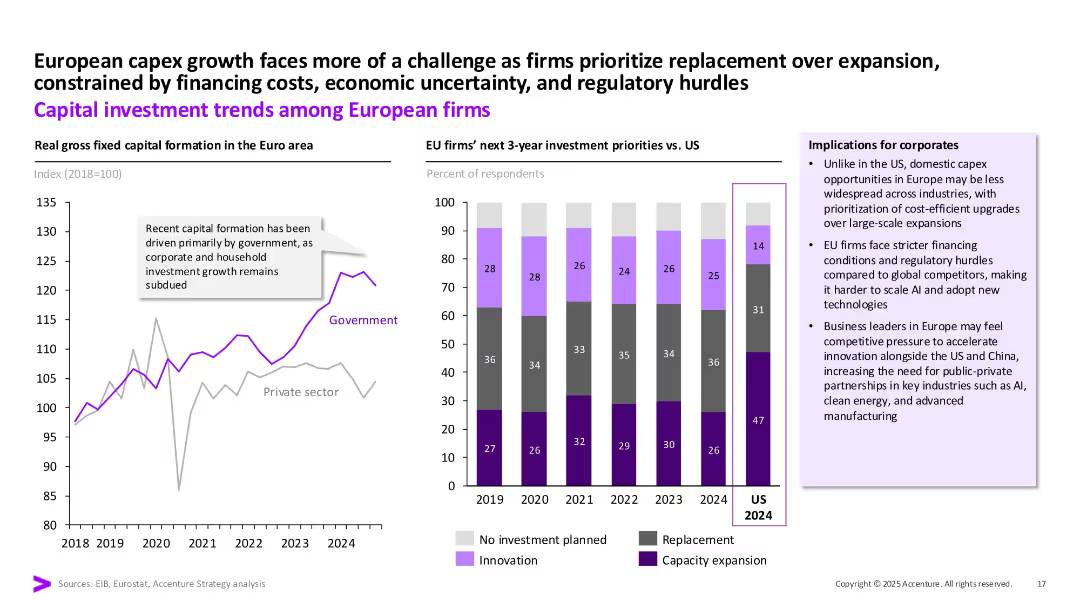
Left: Line graph showing EU capital formation by government/private. Right: Stacked bar chart of EU vs US investment priorities. Text boxes and implication callouts.
Market Analysis and Trends
Financial Services
The slide contrasts public vs private sector investment in the EU, noting government-led growth. It also compares EU and US investment priorities for 2024, highlighting EU’s focus on replacement and innovation under tighter regulatory and financing constraints.
EU, investment, capex, government, private sector, replacement, priorities
false
Market Analysis and Trends
Financial Services financial-services
Multiple Chart
Accenture
View slide
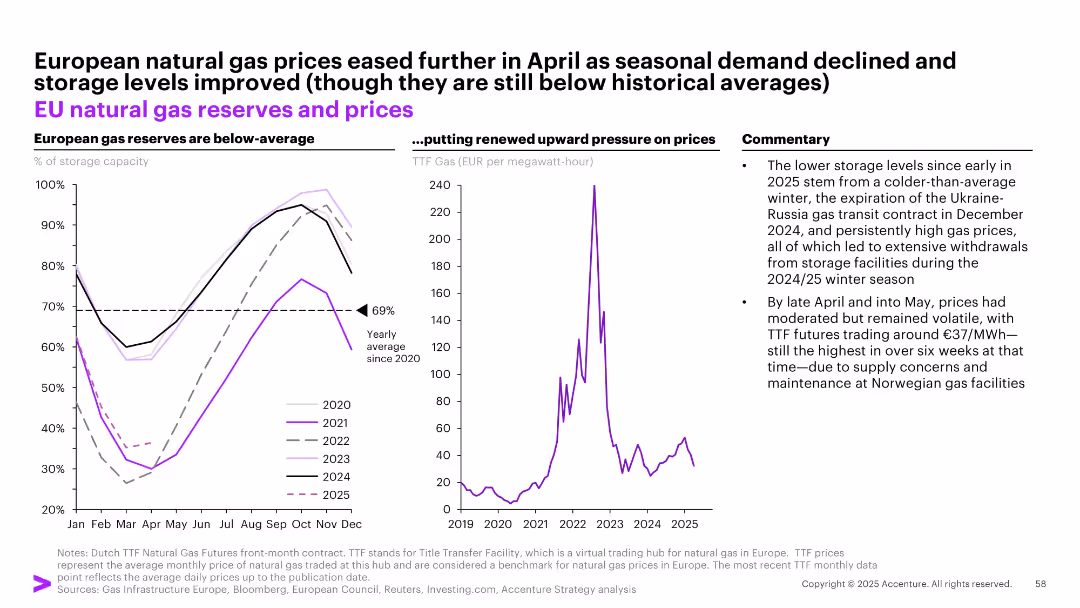
Split into three sections: left panel shows EU gas storage levels, middle panel shows gas prices (TTF), right panel has commentary.
Market Analysis and Trends
Energy & Utilities
Analyzes low EU gas reserves and price movements from 2020–2025. Points to cold winters, transit contract expirations, and storage withdrawals as key contributors. Despite easing in May, prices remain volatile due to supply concerns.
EU, natural gas, reserves, energy, TTF, storage, Ukraine-Russia, volatility, price pressure, winter
false
Market Analysis and Trends
Energy & Utilities energy-and-utilities
Multiple Chart
Accenture
View slide
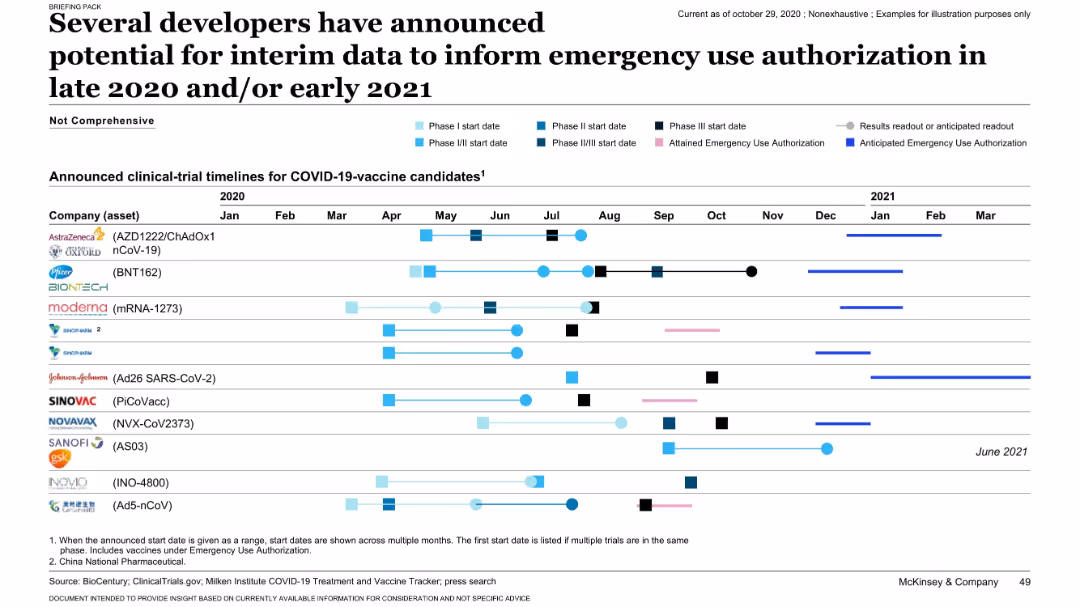
Timeline chart tracking vaccine candidates’ clinical trial phases, anticipated results, and EUA status. Very detailed and horizontally structured.
Regulatory and Compliance
Healthcare & Pharmaceuticals
This slide presents clinical development timelines for key COVID-19 vaccine candidates from companies like Pfizer, Moderna, and AstraZeneca. It shows when Phase I-III trials began and when emergency use authorizations (EUAs) were or are expected. The chart helps visualize the race to release vaccines and timelines for decisions.
EUA, vaccine trials, timelines, COVID-19, authorization, clinical phases
false
Regulatory and Compliance
Healthcare & Pharmaceuticals healthcare-and-pharmaceuticals
Single Chart
McKinsey
View slide
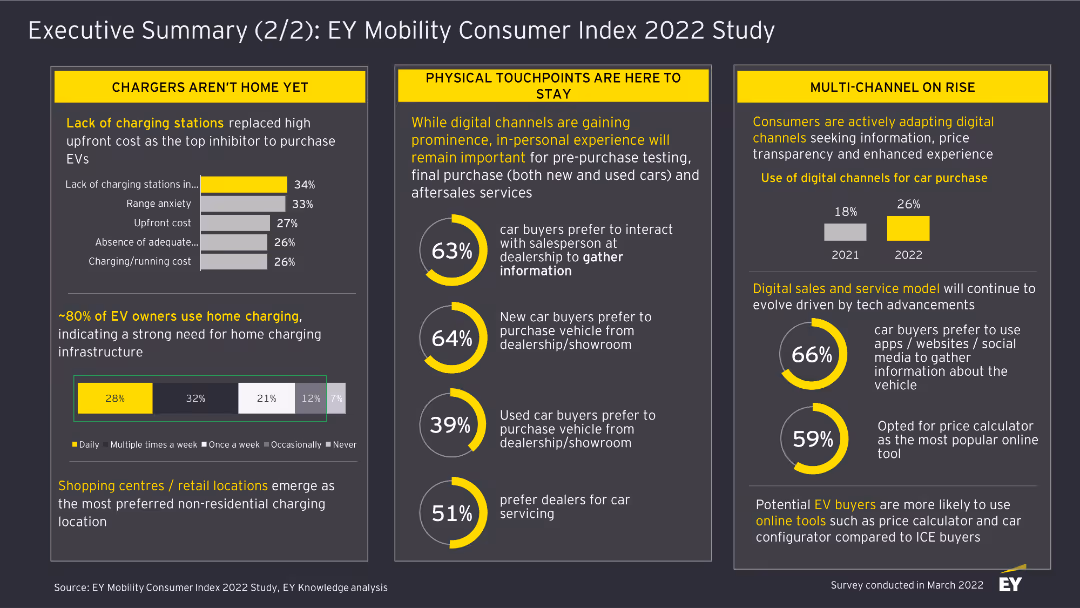
This slide includes column charts and textual highlights. It discusses the challenges in EV adoption, the importance of physical touchpoints, and the rise of digital channels for car purchases.
Market Analysis and Trends
Transportation & Logistics
The slide summarizes findings from the EY Mobility Consumer Index 2022 Study, focusing on barriers to EV adoption, the role of physical touchpoints, and the increasing use of digital channels in car buying.
EV Adoption, Physical Touchpoints, Digital Channels, Car Buying, Transportation, Market Analysis, 2022, Survey, Consumer Trends
false
Market Analysis and Trends
Transportation & Logistics transportation-and-logistics
Multiple Chart
EY
View slide
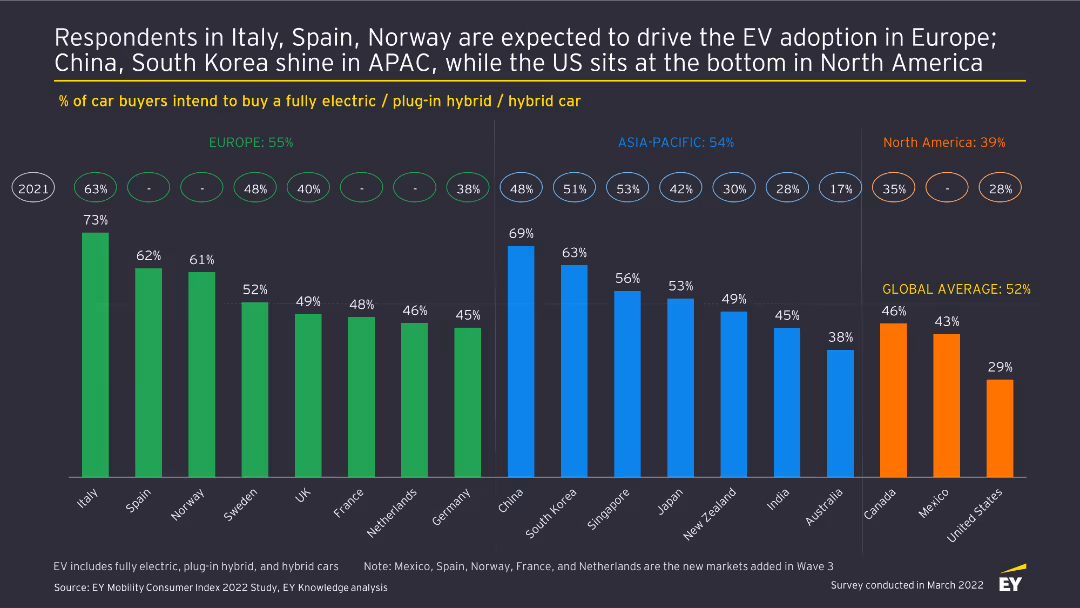
This slide features a column chart comparing the percentage of car buyers intending to buy an EV across different regions, highlighting Europe, APAC, and North America.
Market Analysis and Trends
Transportation & Logistics
The slide analyzes regional differences in EV adoption intentions based on the EY Mobility Consumer Index 2022 Study, comparing the percentage of car buyers planning to purchase an electric vehicle in Europe, APAC, and North America.
EV Adoption, Regional Comparison, Transportation, Market Analysis, 2022, Consumer Trends, Survey, Electric Vehicles, Car Buyers
false
Market Analysis and Trends
Transportation & Logistics transportation-and-logistics
Multiple Chart
EY
View slide
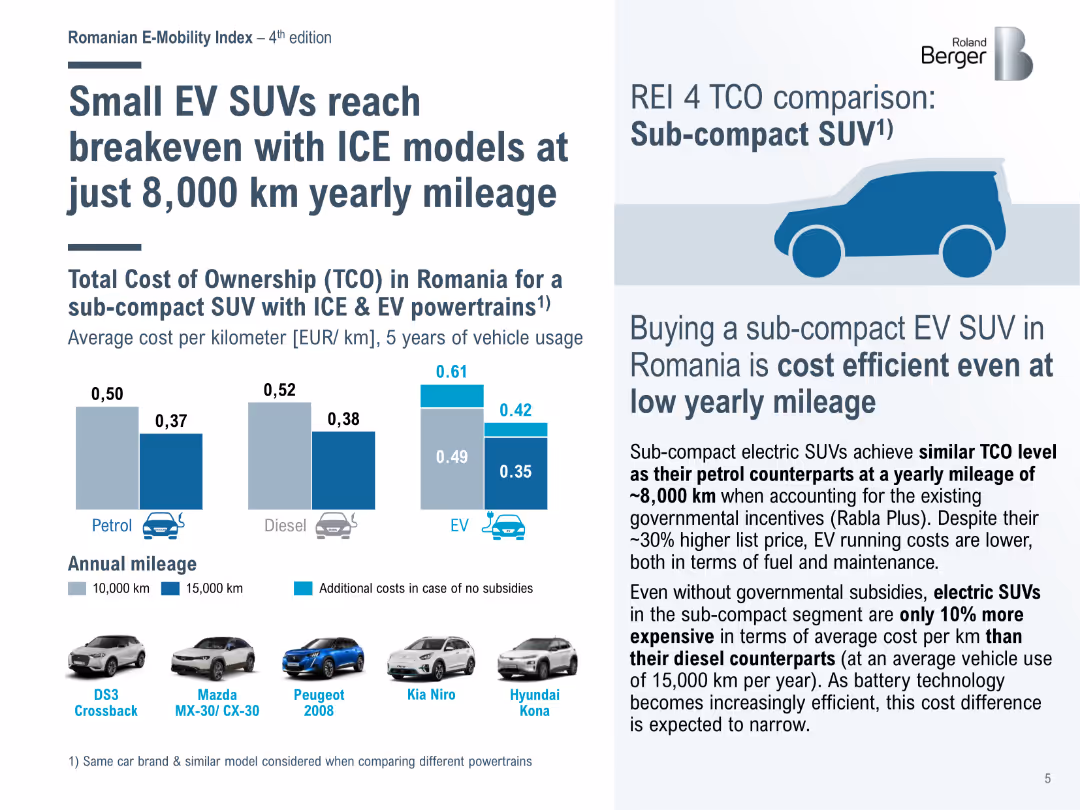
Bar chart comparing the total cost of ownership (TCO) for sub-compact SUVs with ICE and EV powertrains in Romania, showing cost efficiency at low yearly mileage.
Market Analysis and Trends
Transportation & Logistics
Highlights the cost efficiency of sub-compact EV SUVs in Romania, achieving breakeven with internal combustion engine (ICE) models at lower annual mileage due to incentives.
EV SUVs, ICE models, cost efficiency, TCO, Romania
false
Market Analysis and Trends
Transportation & Logistics transportation-and-logistics
Mixed Chart
Roland Berger
View slide
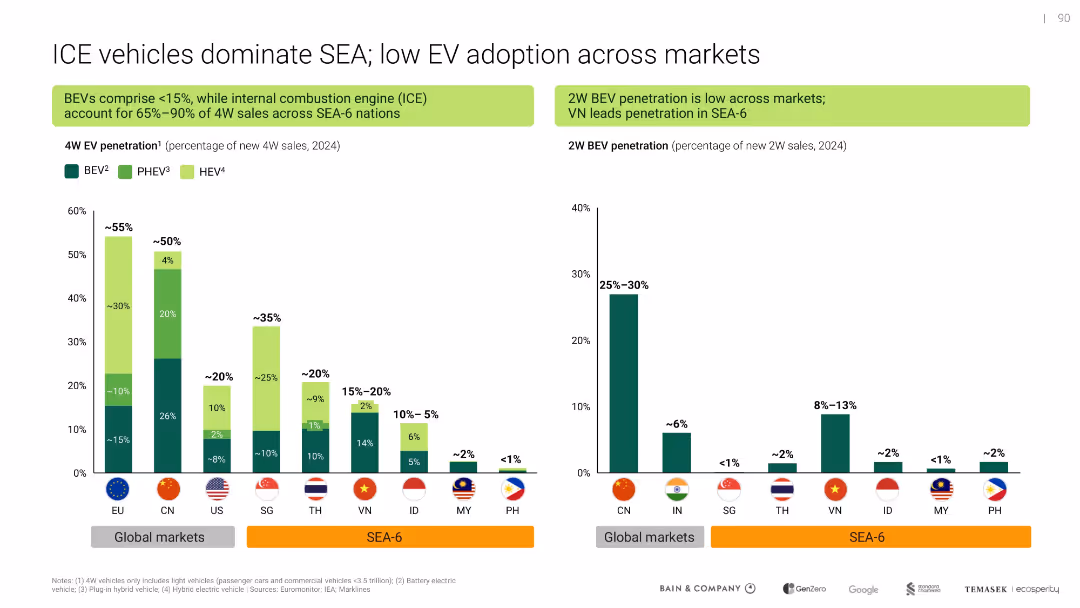
Dual-panel bar chart comparing 4W and 2W EV penetration across SEA and global markets; green color theme for EV types
Market Analysis and Trends
Transportation & Logistics
Shows that internal combustion engine (ICE) vehicles still dominate in SEA-6 countries, with low adoption of battery electric vehicles (BEVs), especially in 2-wheelers. Highlights lag in EV transition compared to global markets.
EV adoption, ICE dominance, BEV, SEA-6, 2W EV, penetration, vehicle market
false
Market Analysis and Trends
Transportation & Logistics transportation-and-logistics
Multiple Chart
Bain
View slide
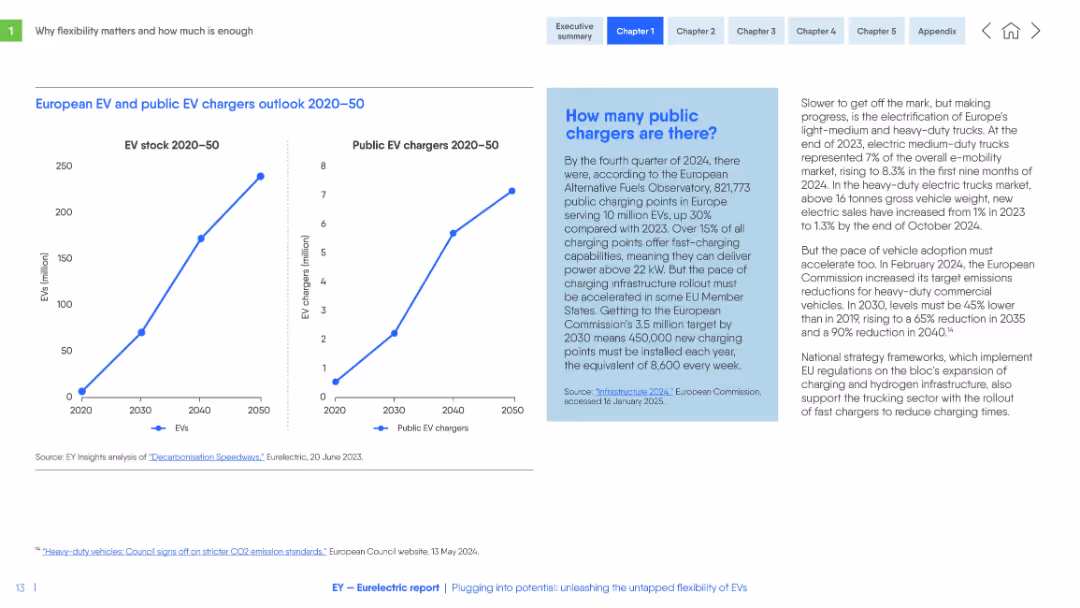
Dual-line graphs (EV stock and chargers 2020–2050), blue text box on public chargers, and right-aligned commentary on truck electrification.
Market Analysis and Trends
Energy & Utilities
The slide forecasts sharp growth in EV stock and public chargers across Europe from 2020 to 2050. It includes infrastructure data and calls for accelerated investment to meet EU targets. It also outlines challenges in electrifying heavy-duty vehicles.
EV adoption, chargers, infrastructure, electrification, EU targets, public policy, vehicle fleet
false
Market Analysis and Trends
Energy & Utilities energy-and-utilities
Multiple Chart
EY
View slide
A column chart illustrating the percentage of respondents across different countries who cite high fuel prices as a key motivator for purchasing an EV. The global average is highlighted.
Market Analysis and Trends
Transportation & Logistics
The slide shows how high fuel/oil/gas prices drive consumers to adopt electric vehicles, with data from multiple countries compared to the global average.
EV adoption, fuel prices, consumer motivation, country comparison
false
Market Analysis and Trends
Transportation & Logistics transportation-and-logistics
Single Chart
EY
Previous
Loading...
Hold On!
We are searching in our database
If nothing, comes up, please try different filters!
Column Chart
Heatmap
Chevron
Org Chart
Infographic
Callouts
Timeline
List
Graphic
Picture
Process Flow
Diagram
Paragraph
Map
Table
Framework
Subtitle
Takeaway Box
Icon
Other Chart
Radar Chart
Waterfall Chart
Mekko Chart
Pie Chart
Scatter Plot
Line Chart
Bar chart
Bullet points
Create a FREE account to continue browsing
Receive Instant Access to 1,000+ slides from companies like McKinsey, Google, and Goldman Sachs
First Name
Last Name
Email
Password
I agree to all
Terms & Privacy Policy
Thank you! Your submission has been received!
Oops! Something went wrong while submitting the form.
Have an account?
Sign in
Upgrade to PRO to Save slides
Advanced Search and Filters
Access to 15,000+ slides
Access to Category Pages
Save/Bookmark Slides
PowerPoint Template Library
Pick a Plan
MONTHLY
$12/month
Billed every month, Cancel anytime.
YEARLY
$9/year
Billed $108 annually, Cancel anytime.
Checkout for $12/month
Checkout for $108/yr
Secured by Stripe | AES-256 bit encryption