PRO
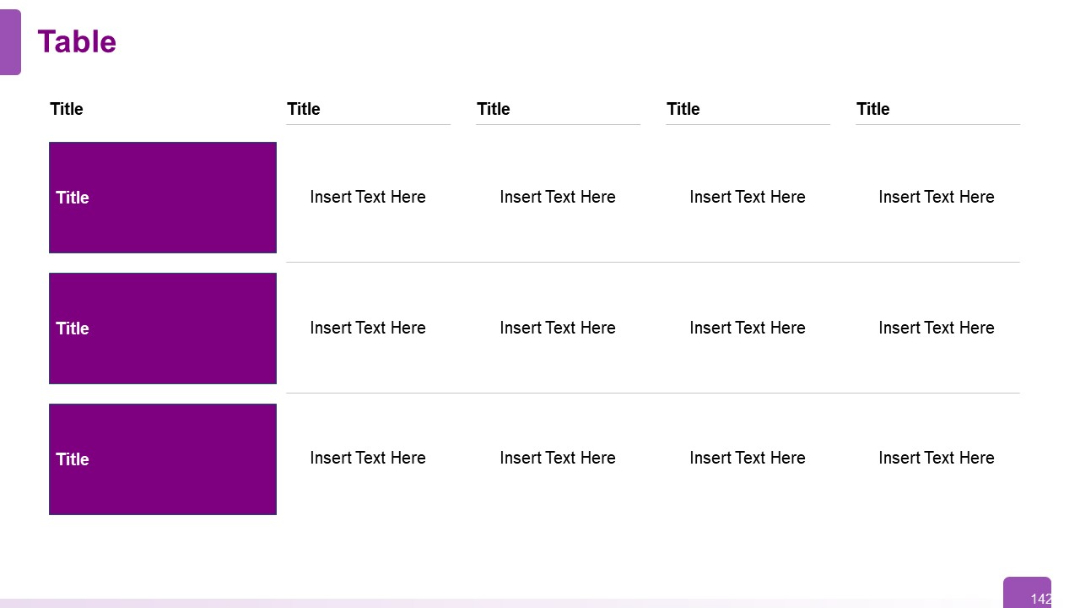
Three-row, five-column table with bold purple boxes in the first column. Gridlines and equal column widths create a clean visual hierarchy.
PRO
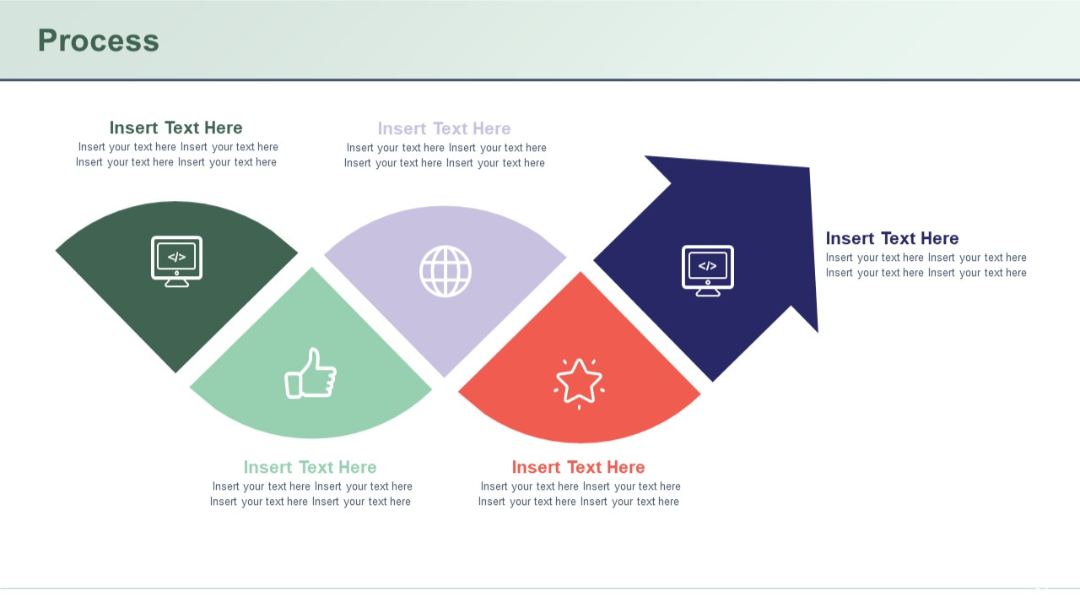
Fan-shaped segments with icons and text, transitioning into an upward arrow at the end.
PRO
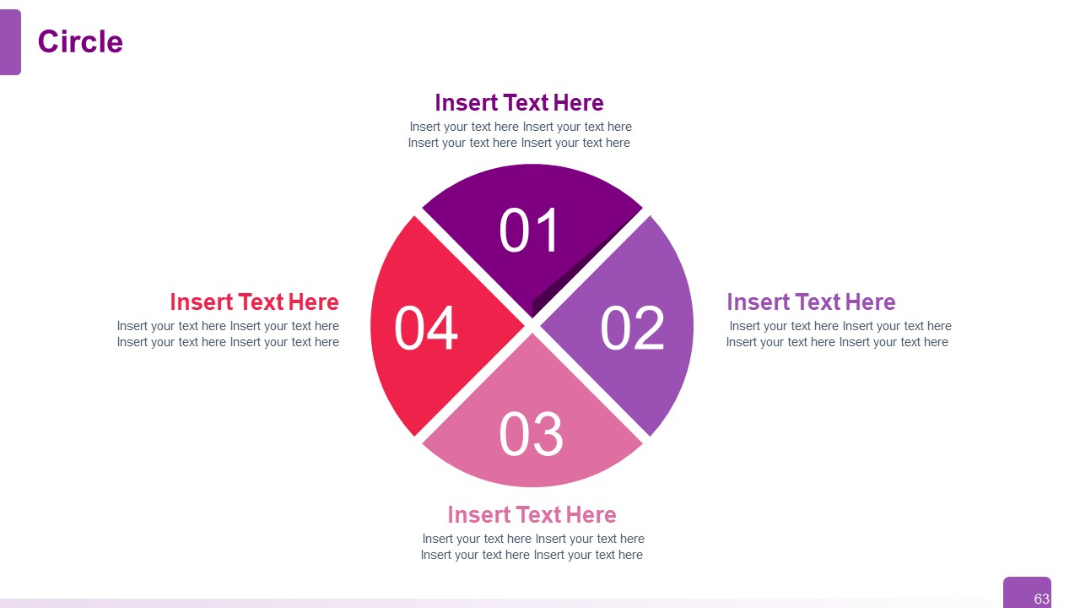
A 4-part pie chart segmented into quadrants with large numeric labels (01–04) and surrounding editable text areas.
PRO
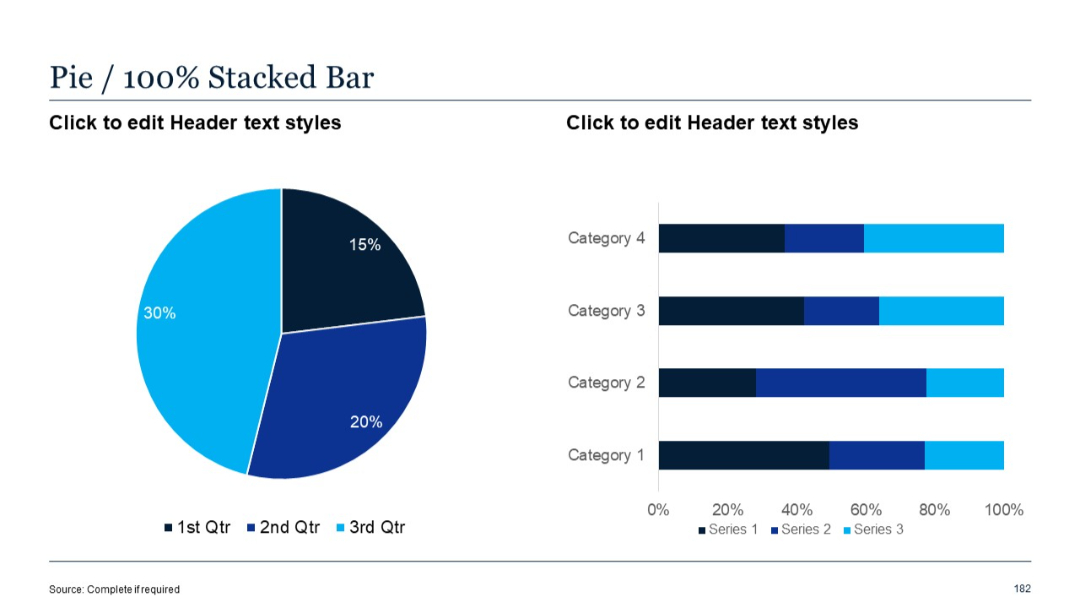
Similar layout to slide 181, but right side uses 100% stacked bar chart for percentage distribution, while left side retains the same pie chart.
PRO
Two equal-width columns with bullet points; plain white background.

PRO
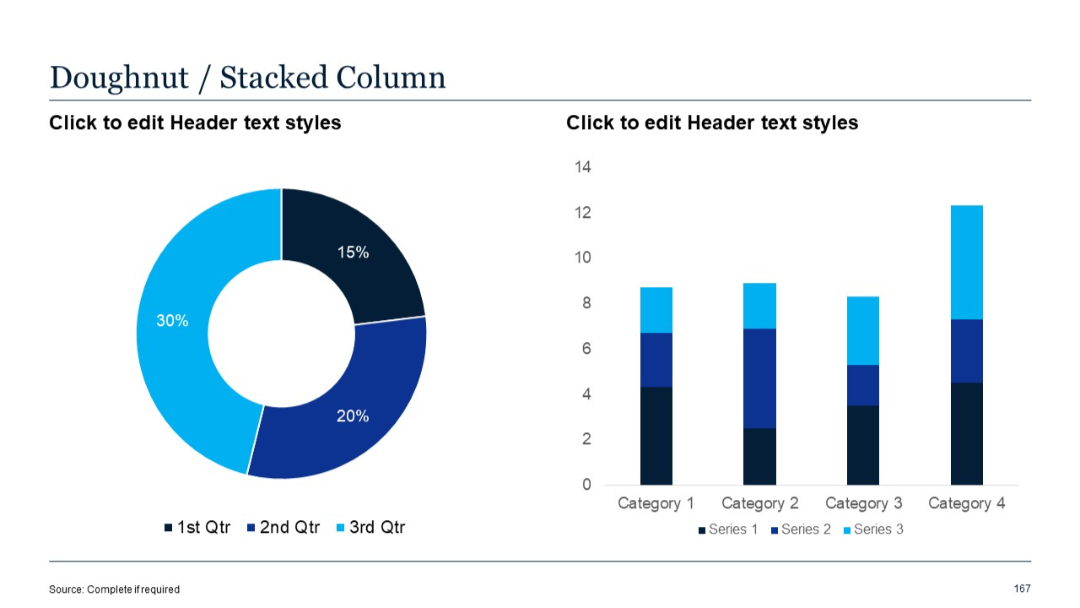
Doughnut chart on the left and stacked vertical column chart on the right showing values for three series.
PRO
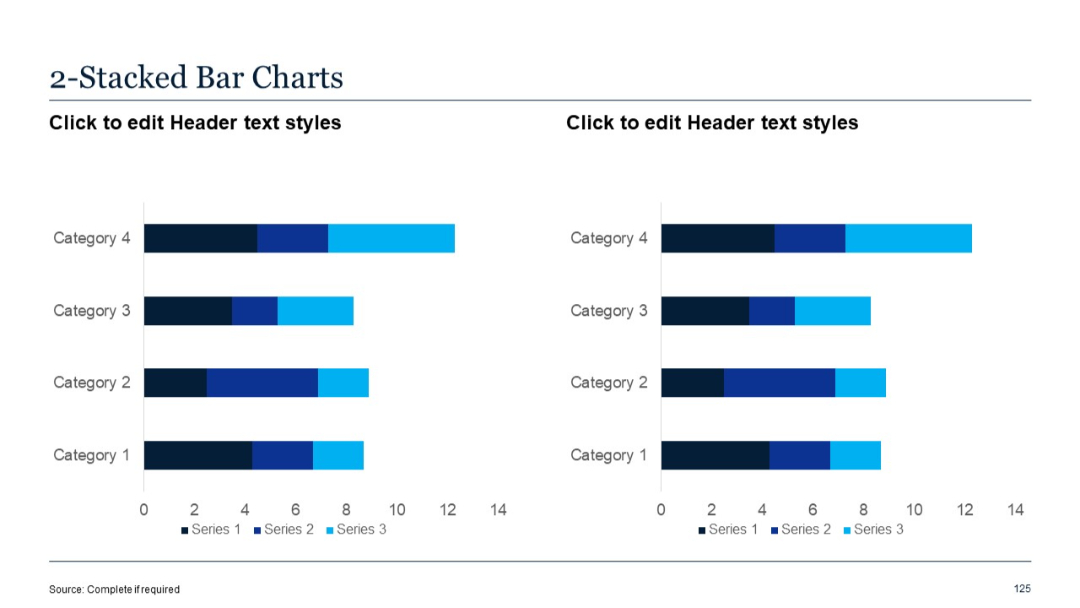
Two horizontal stacked bar charts placed side-by-side. Three color-coded series in each bar.
PRO
Left side features a pie chart, right side has a bar layout with logo placeholders; clean separation.
PRO
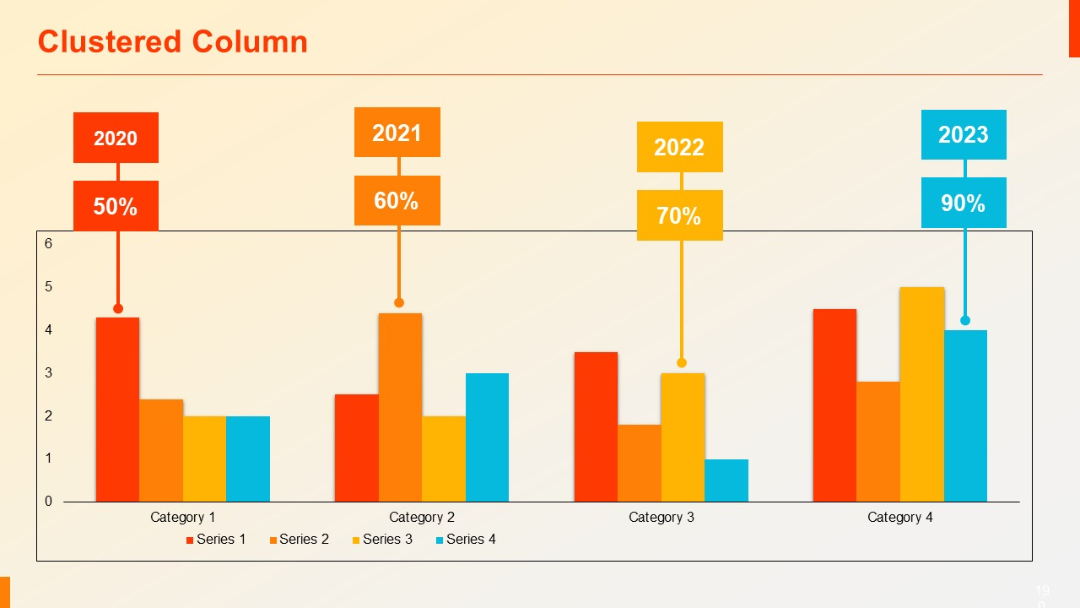
Vertical clustered column chart with year-label callouts (2020–2023) and large percentage annotations above each column group.
PRO
Left chart uses 100% stacked columns, while the right shows standard stacked columns for 3 series across 4 categories.

PRO
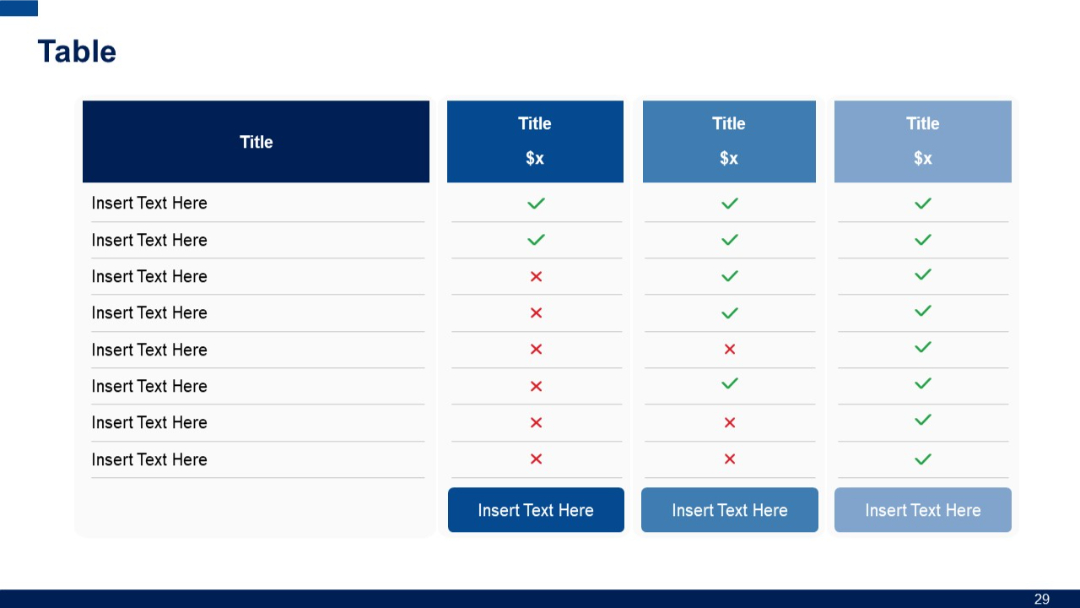
4-column table with pricing indicators ($x) in headers and visual check/cross icons in cells. Includes CTA buttons in the bottom row.
PRO
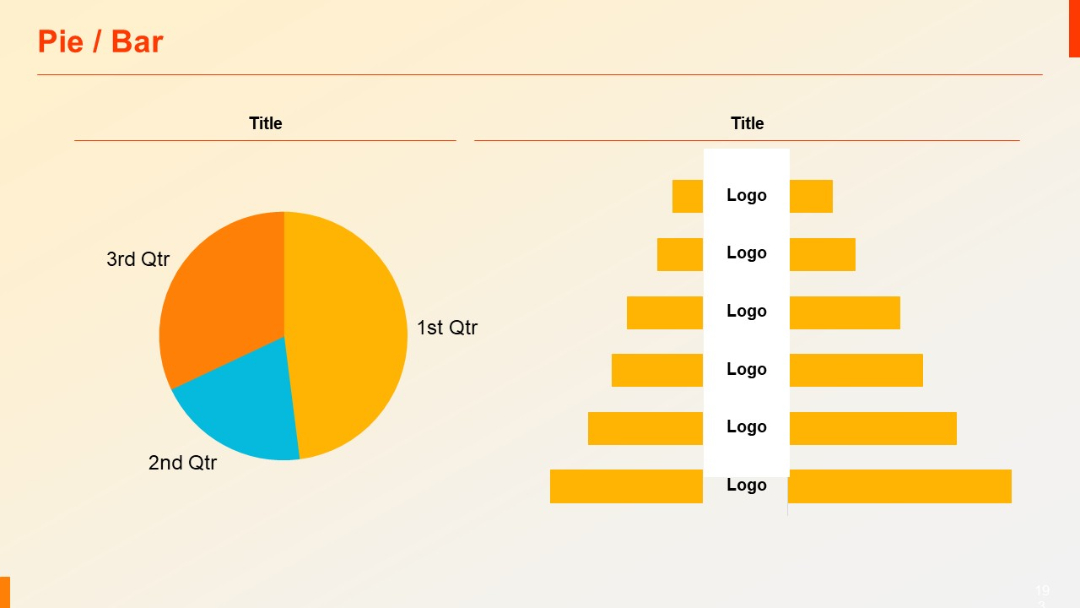
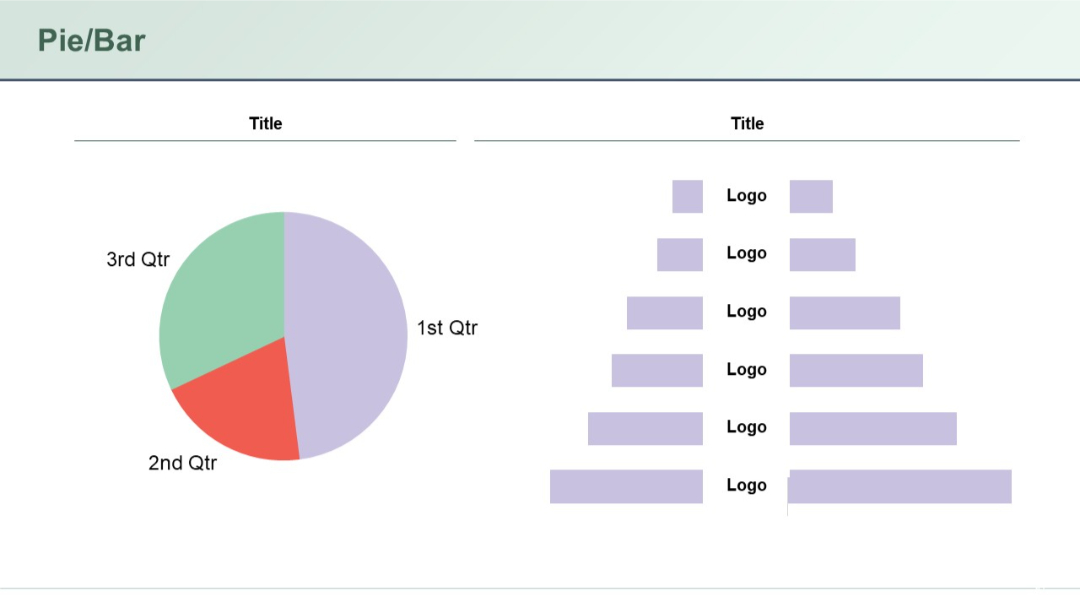
A combined visual slide with a pie chart on the left and pyramid-style stacked bar chart on the right.
PRO
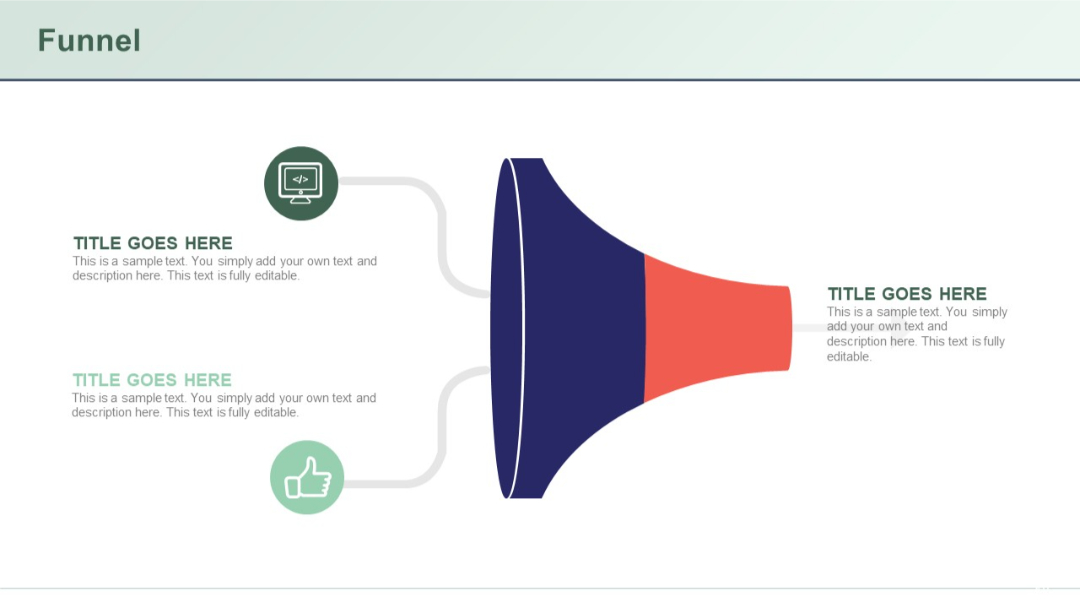
Horizontal funnel diagram with left-to-right flow, incorporating three icons and matching text labels on either side.
PRO
Chevron-step layout with four distinct vertical blocks, each containing icons, titles, and text sections beneath.
PRO
Four doughnut-style pie charts with central percentage labels, symmetrically aligned and color-coded.

PRO
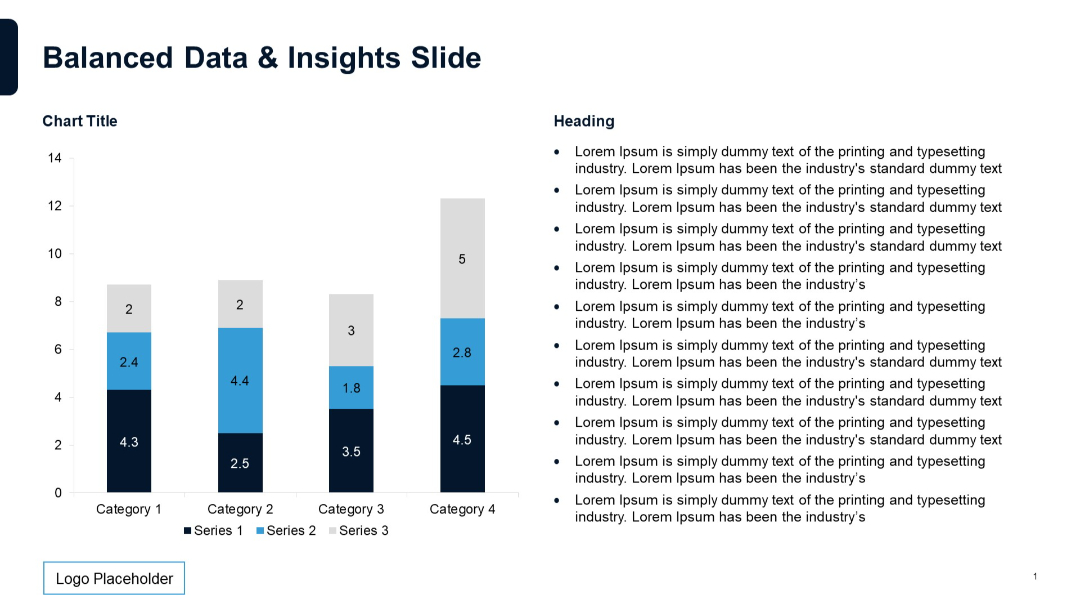
Left-aligned vertical stacked bar chart with four categories. Right side has bulleted text. Minimalist layout with navy and white theme. Logo placeholder at bottom left.
PRO
Four circular icons placed along a horizontal arrow. Each icon has a colored circle and space below for text. Modern and vibrant visual.

PRO
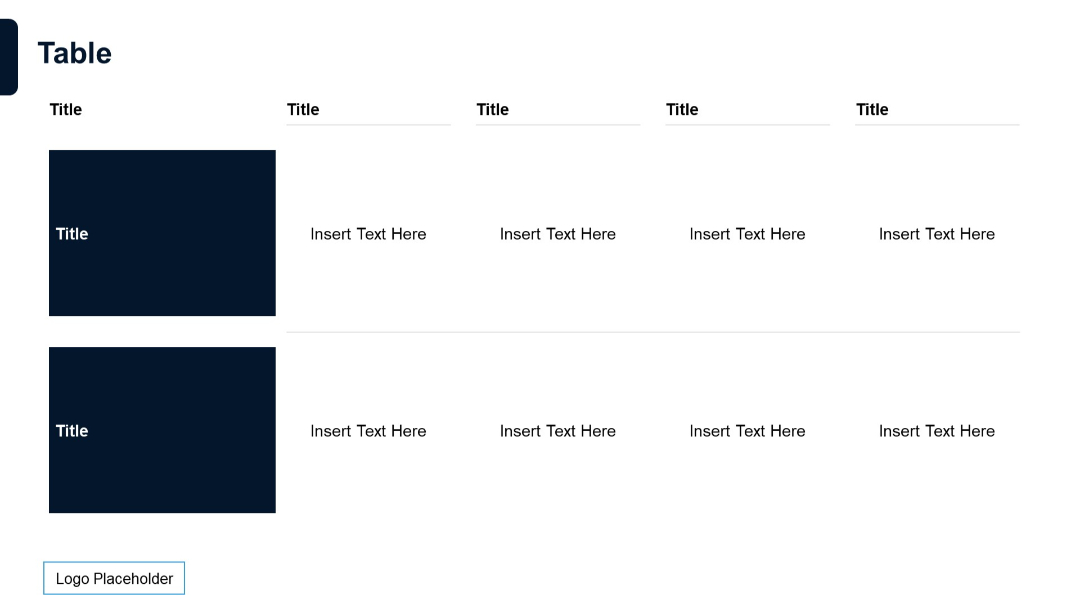
2-row, 5-column table; first column shaded with titles; rest are white cells with centered text placeholders.
PRO
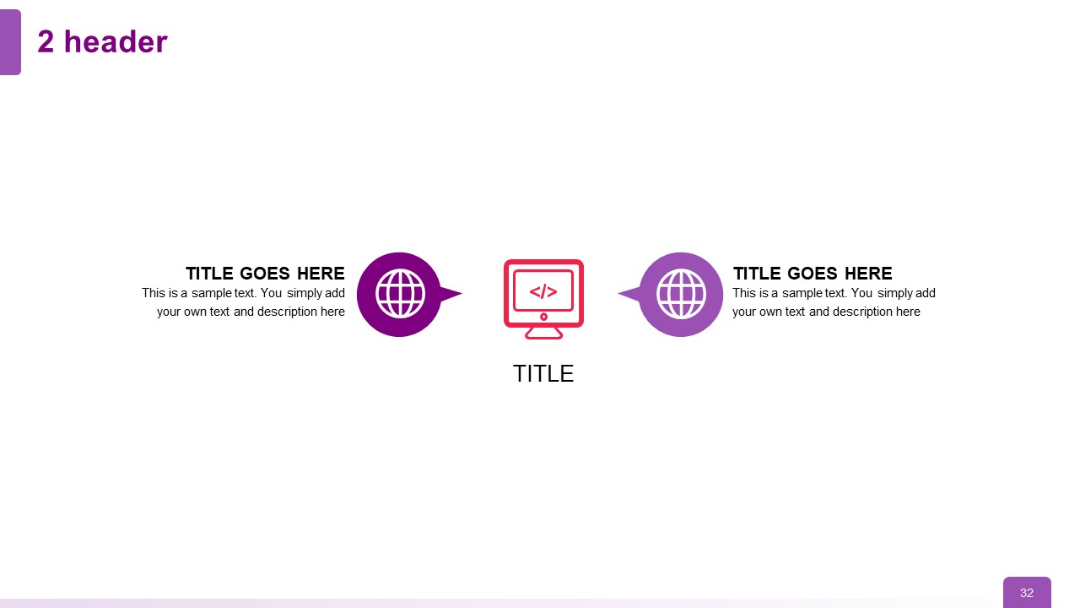
Horizontal layout with two icons and text blocks on either side of a central icon and title; minimal and symmetrical design.
PRO
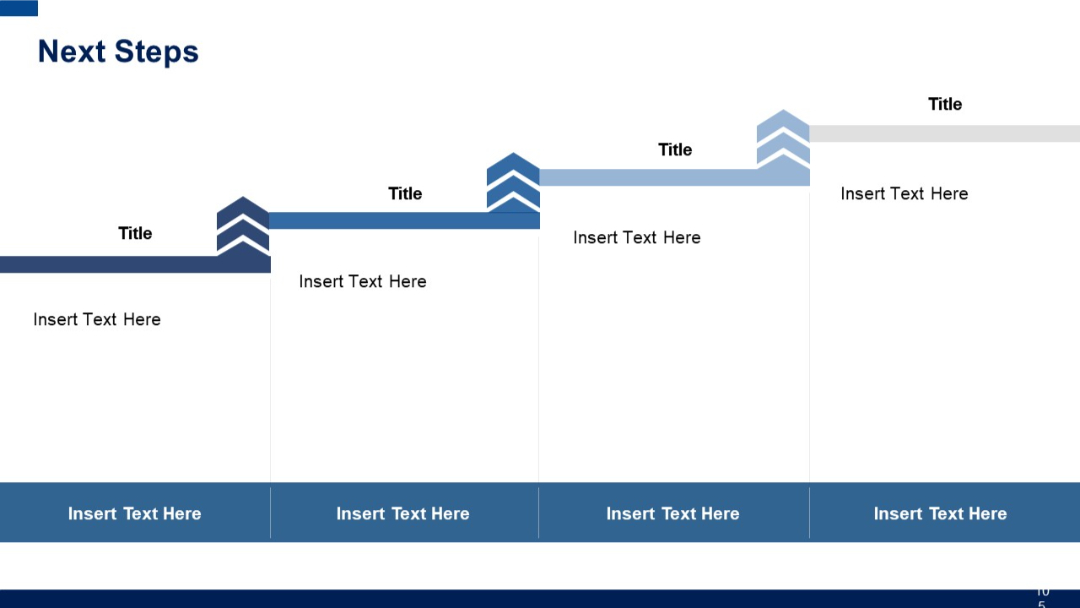
Four horizontal chevrons in alternating blue/dark blue shades, each containing a heading. Beneath each chevron is a vertically aligned column of bullet points. Clean layout with logo placeholder.

PRO
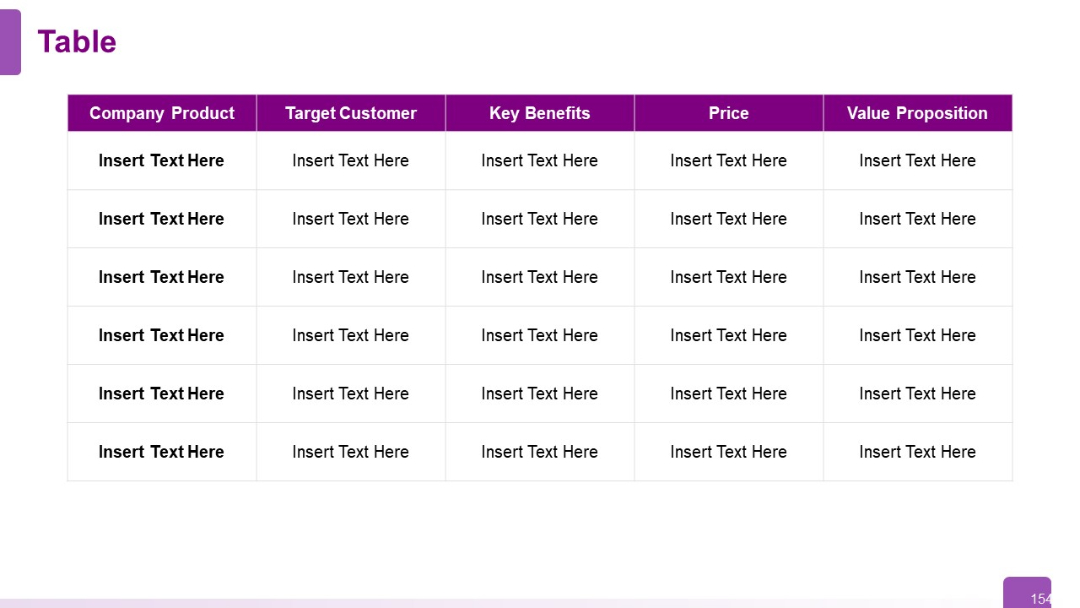
Same structure as previous, extended to six rows; enables broader product comparisons.
PRO
A four-layered radial chart with arc segments in yellow, orange, and blue tones; text headers aligned on the left.

PRO
Four colorful circular speech bubble icons with center-aligned graphics, positioned in a 2x2 grid. Each has accompanying title and descriptive text.

PRO
A clean, evenly spaced grid of business, communication, and digital interaction icons including graphs, magnifiers, chats, and data charts.
PRO
A dense feature comparison table with green checkmarks and red Xs across 7 columns. Only two rows are shown for contrast.
PRO
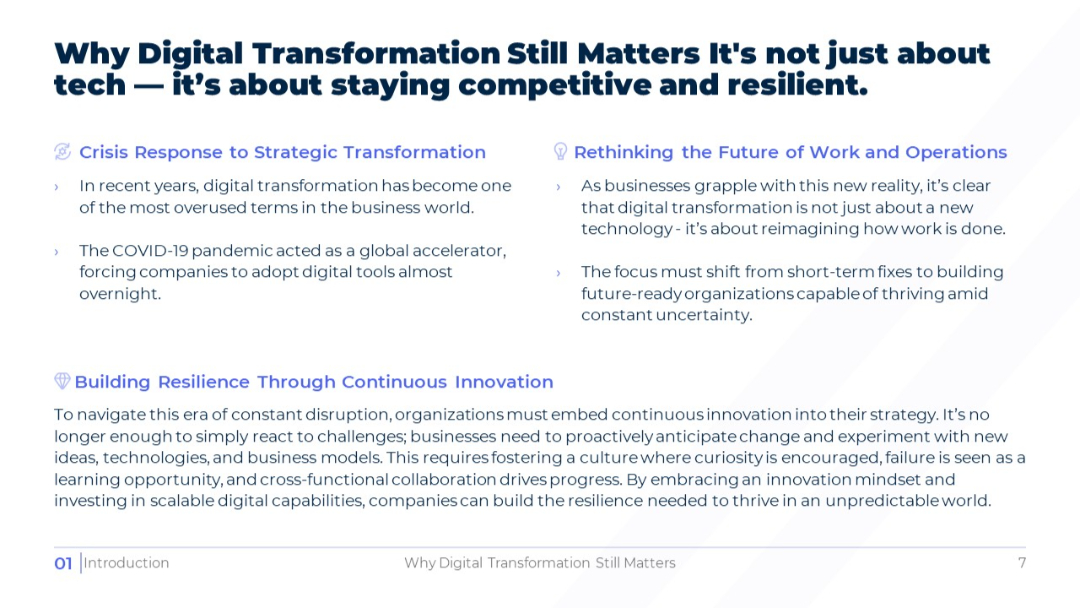
Three-topic layout with icons: Strategic Transformation, Future of Work, and Continuous Innovation. Mix of bulleted lists and a paragraph. Visually engaging with iconography and highlighted subheadings.
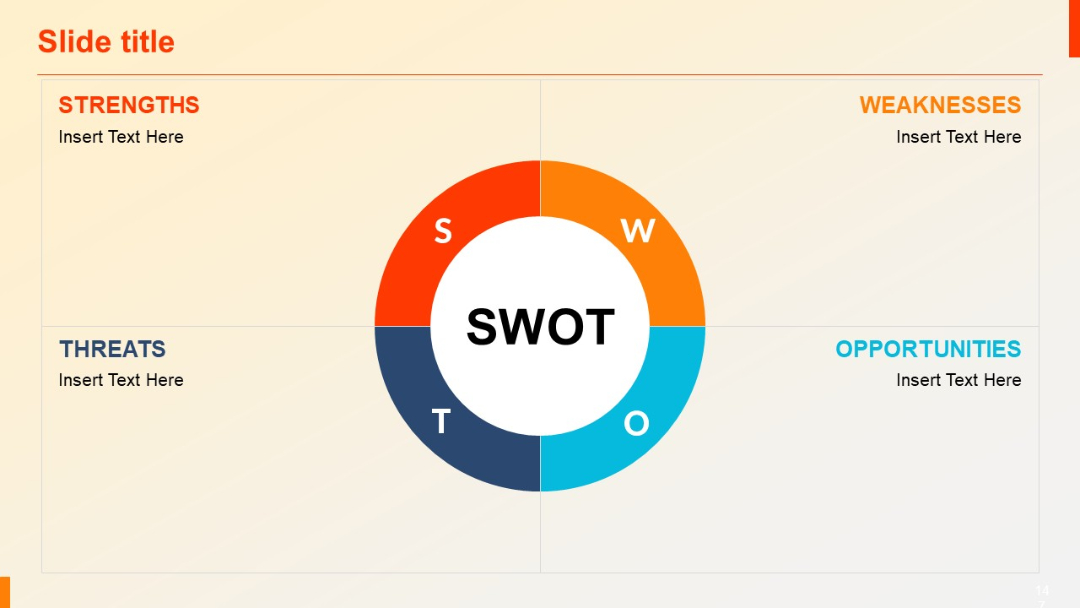
PRO
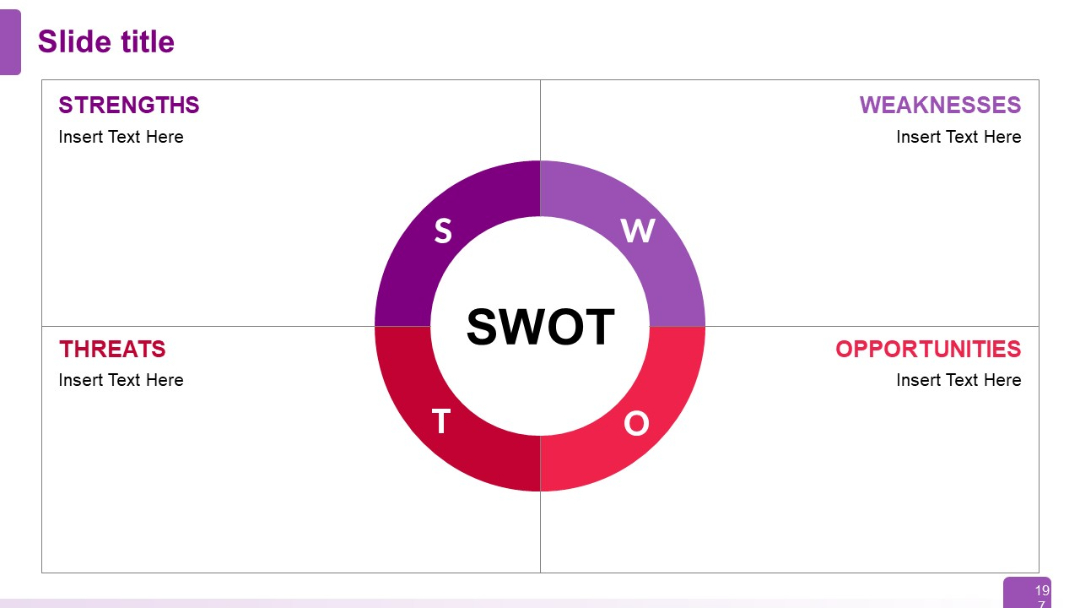
Central circular SWOT wheel surrounded by quadrant text areas, each labeled with S, W, O, T.
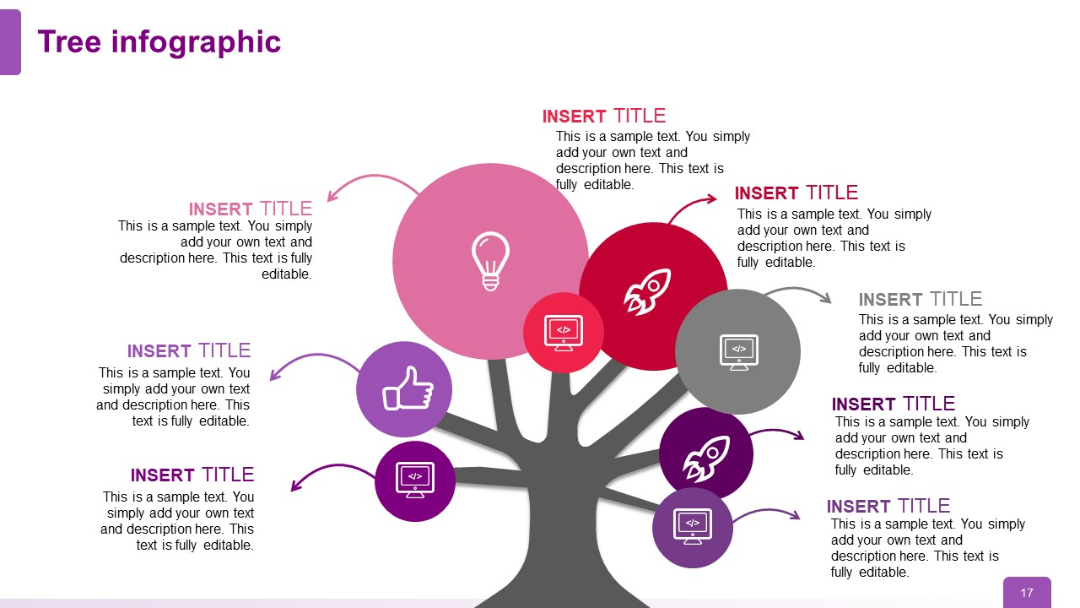
PRO
Fully built-out tree with eight circular nodes including a mix of lightbulb, rocket, thumbs up, and computer icons in various colors and sizes.
PRO
Circular infographic with 4 segments arranged around a central hub. Each segment has an icon and placeholder text, with a clean white background.

PRO
Circular segmented SWOT diagram with quadrants around a donut chart format.