PRO
Horizontal process diagram with icons in circles connected by a line, underlined by colored arrow boxes.
PRO
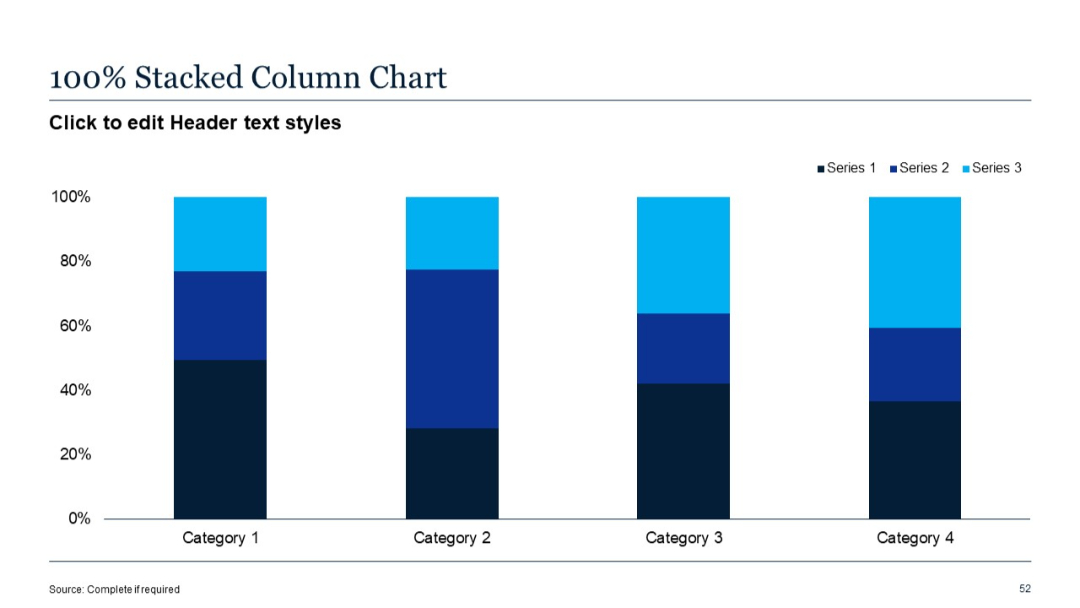
Vertical 100% stacked column chart; equal-height bars normalized to percentages.
PRO
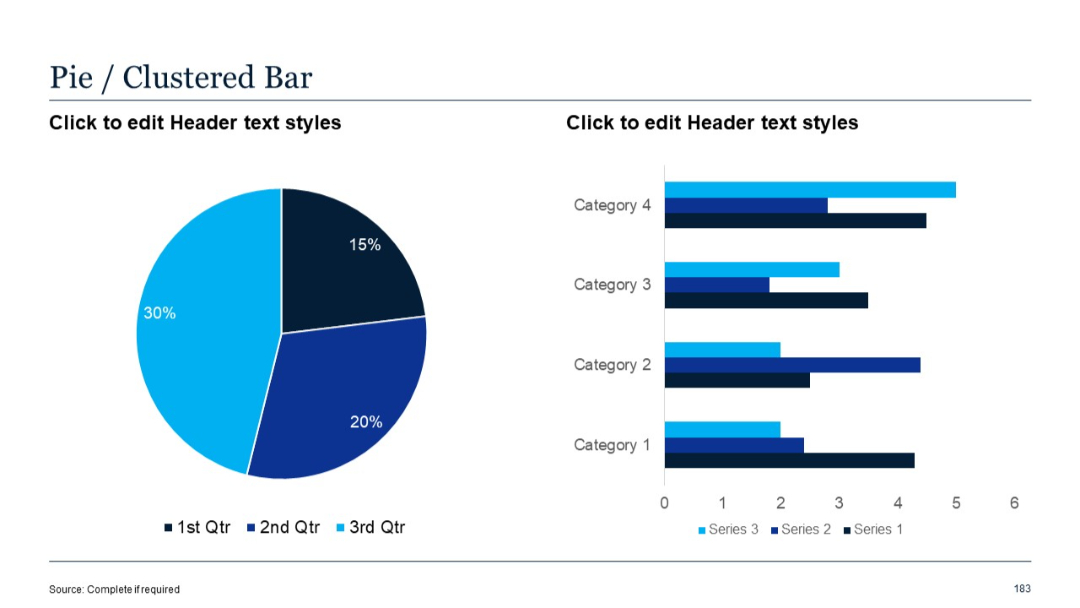
Left pane contains pie chart; right side displays clustered bar chart with three data series per category, aligned side-by-side.
PRO
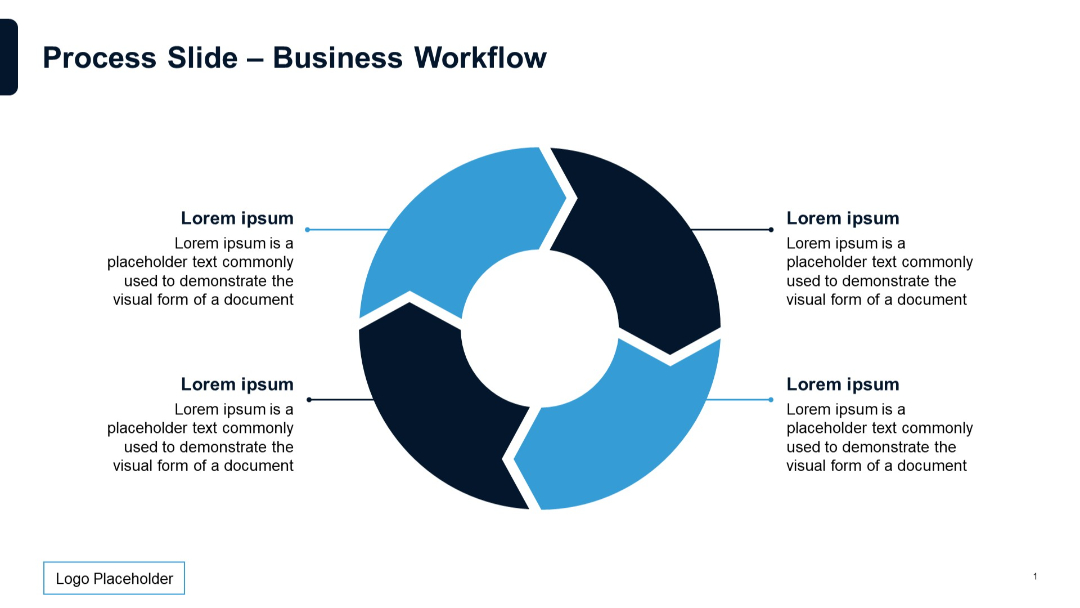
Six-segment circular flow diagram, dark and bright color mix, clearly labeled segments with external text explanations.

PRO
Vertical four-column layout with title and text placeholder for each SWOT category in color-coded boxes.
PRO
Four horizontal rows with dots and right-pointing lines ending in circular step numbers; text areas are aligned left of each numbered circle.
PRO
Eight-part pie-style radial diagram with segment-specific icons and mirrored text placement on both sides.
PRO
Modern tab-style SWOT with rounded card design; each segment begins with a bold letter (S, W, O, T).
PRO
Four-segment circular flow diagram with arrows and icons, centered around a bold header. Each quadrant is paired with text on the outer edges.

PRO
A grid of six vertical column-style bar charts with placeholders for percentage values, titles, and descriptions.
PRO
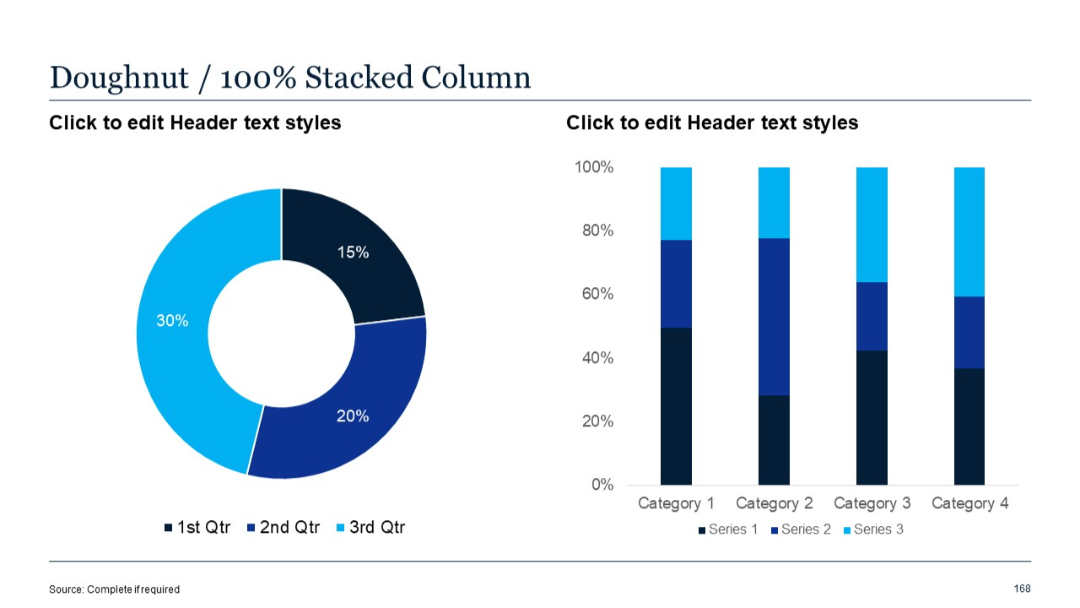
Doughnut chart and 100% stacked column chart showing relative series proportions across categories.
PRO
Grid layout mapping customer actions, business touchpoints, and digital transformation impact across six journey stages from Awareness to Loyalty.

PRO
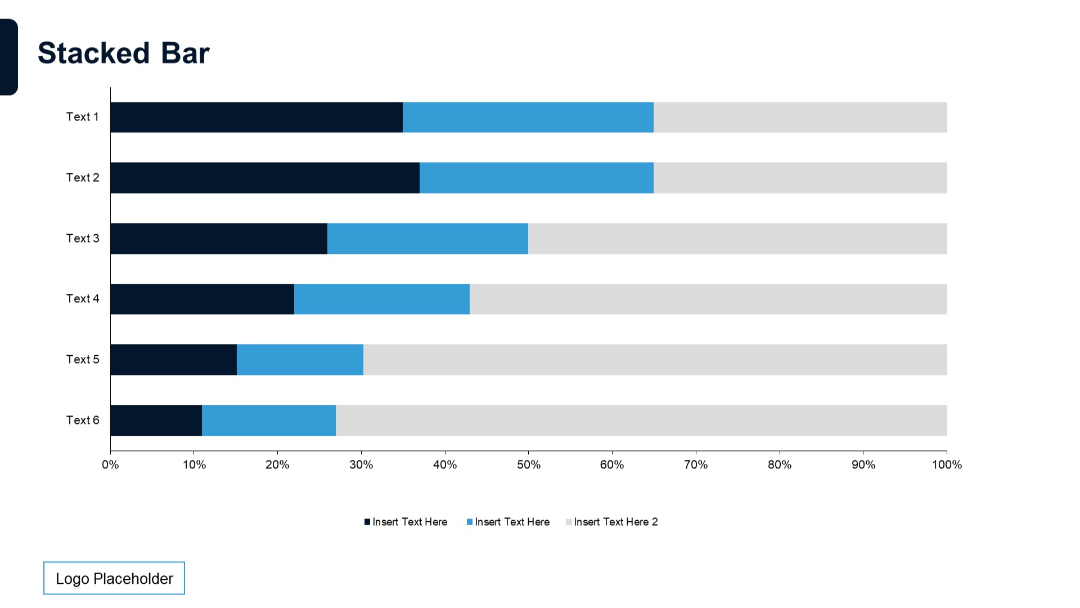
Horizontal stacked bar chart with six entries. Each entry contains three segments (dark blue, blue, and gray) labeled below.
PRO
Minimalist block-style org chart with colored rectangles and circles indicating hierarchy levels.

PRO
Similar to previous, 5-column matrix with three rows. Blue headers, grey cells, ellipses as data placeholders. Structured layout.

PRO
A full-width quote box occupying the center of the slide. The quote area is colored in blue with large quotation marks, centered text, and a white border on the right side.

PRO
4 blocks on top, 4 below; visually consistent with previous slides; blue and white theme; icons and text-balanced.

PRO
Map-centered slide with callouts and regional labels; muted global map with blue highlights for countries; callouts on left and right sides.

PRO
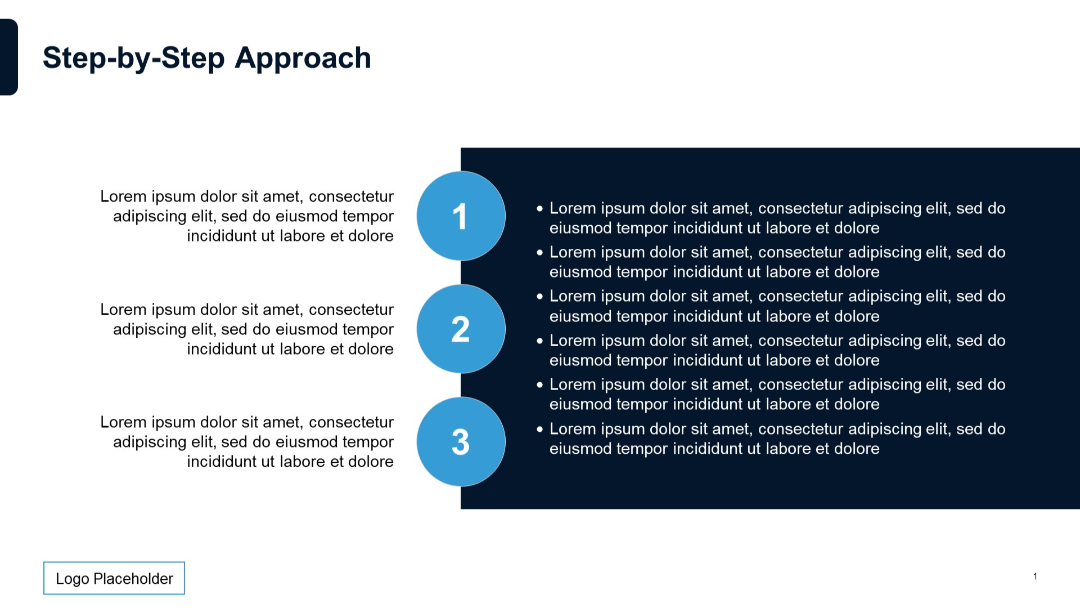
Left-aligned numbers 1–3 with adjacent bullet point sections and supporting paragraph text on left.
PRO
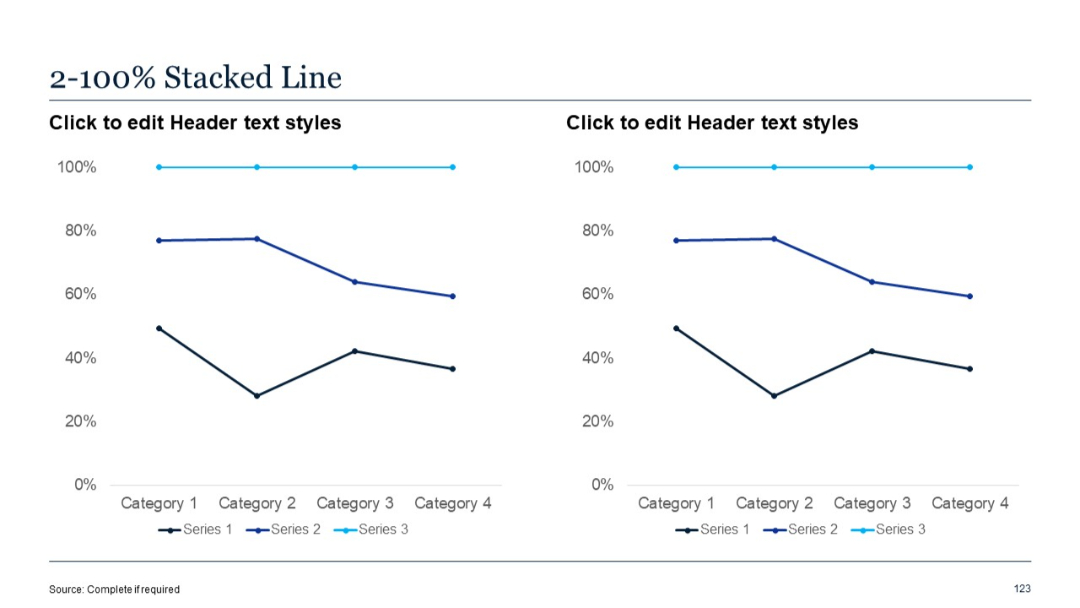
Two identical 100% stacked line charts, showing data proportions over categories.
PRO
Agenda layout with 10 circular numbered items and a left-side gray box for date and event title. Mid-points for lunch and coffee breaks are included.
PRO
A segmented grid layout with iconography and sparse text. One section uses person icons and a large "90%" marker to highlight a dominant value.
PRO
Vertical numbered list from 01 to 04 on the left with text placeholders; each number has a colored block; clean, minimalist layout.
PRO
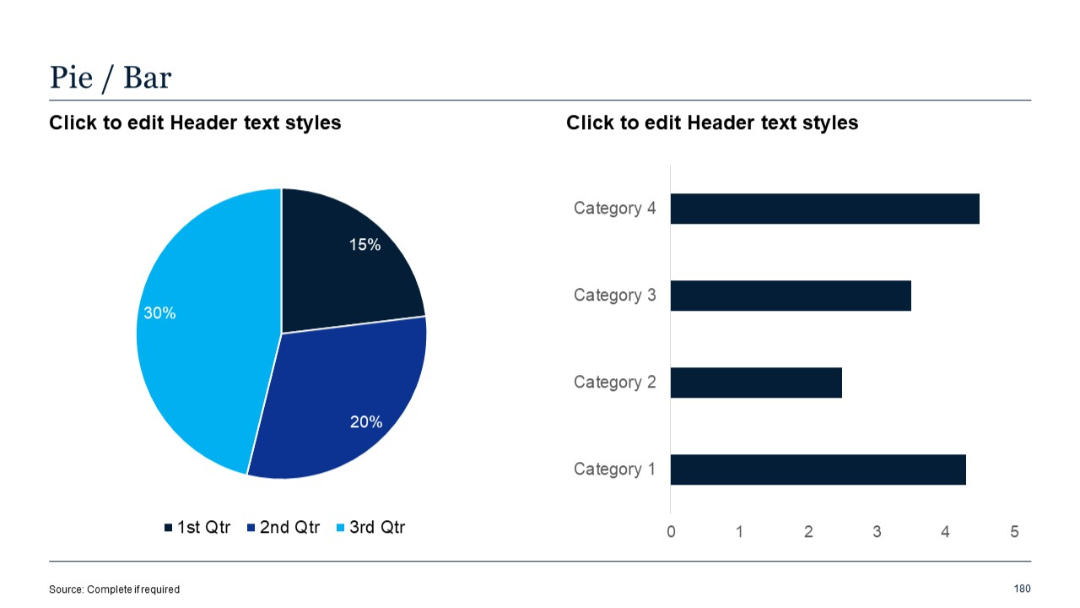
Pie chart on the left and a simple horizontal bar chart on the right.
PRO
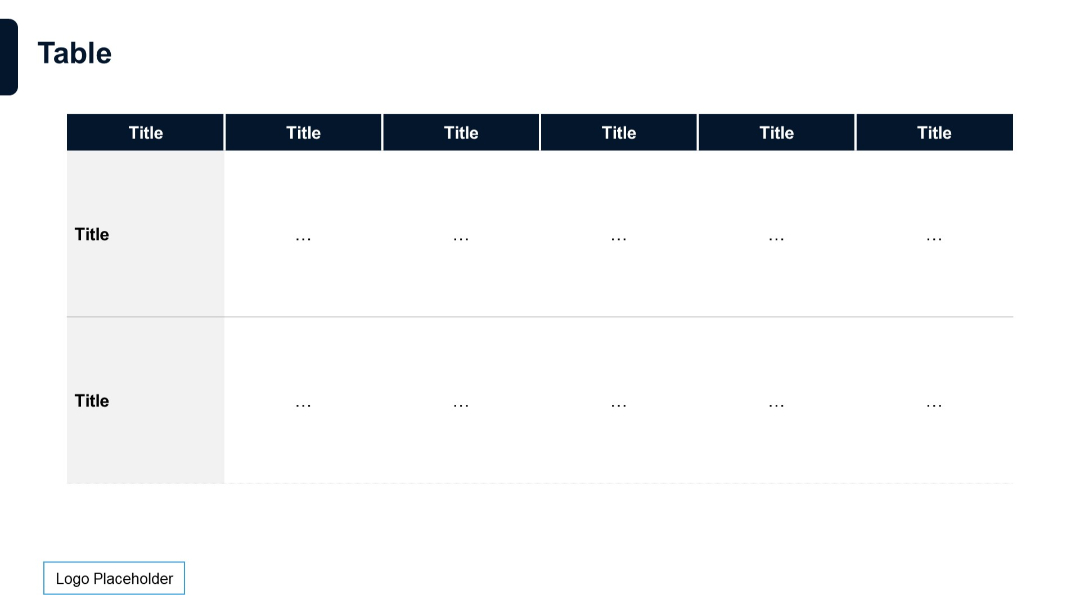
Matrix-style table with five column headers and two rows. Top and left headers are dark blue, body uses ellipses as placeholders.
PRO
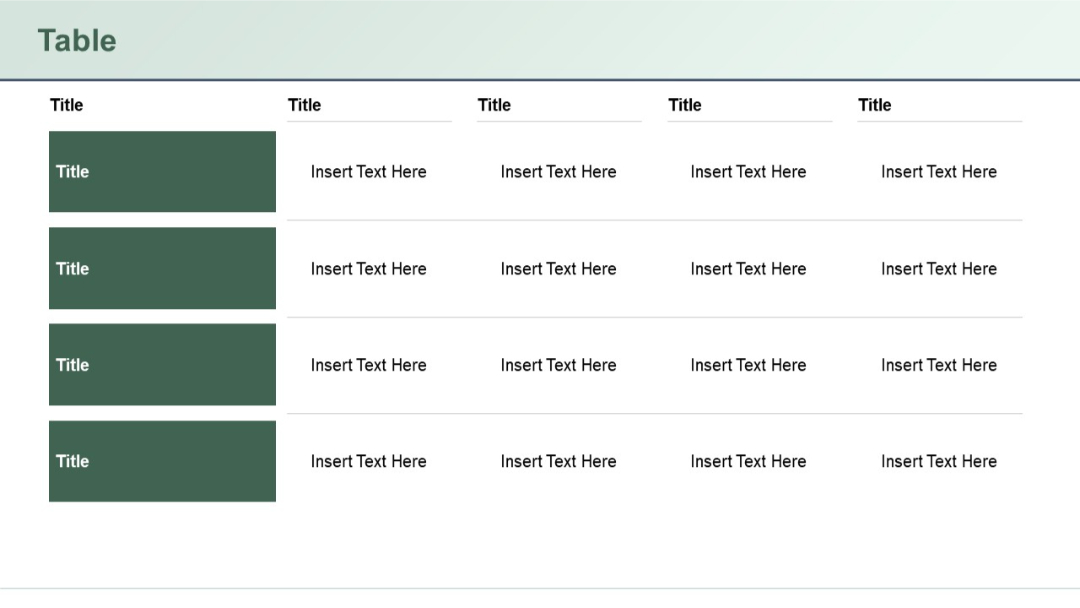
Four shaded cells stacked vertically on the left, aligned with four rows of horizontal cells to the right, each row having four textual columns.
PRO
Circular segmented diagram with arrows, surrounded by text and labels.
PRO
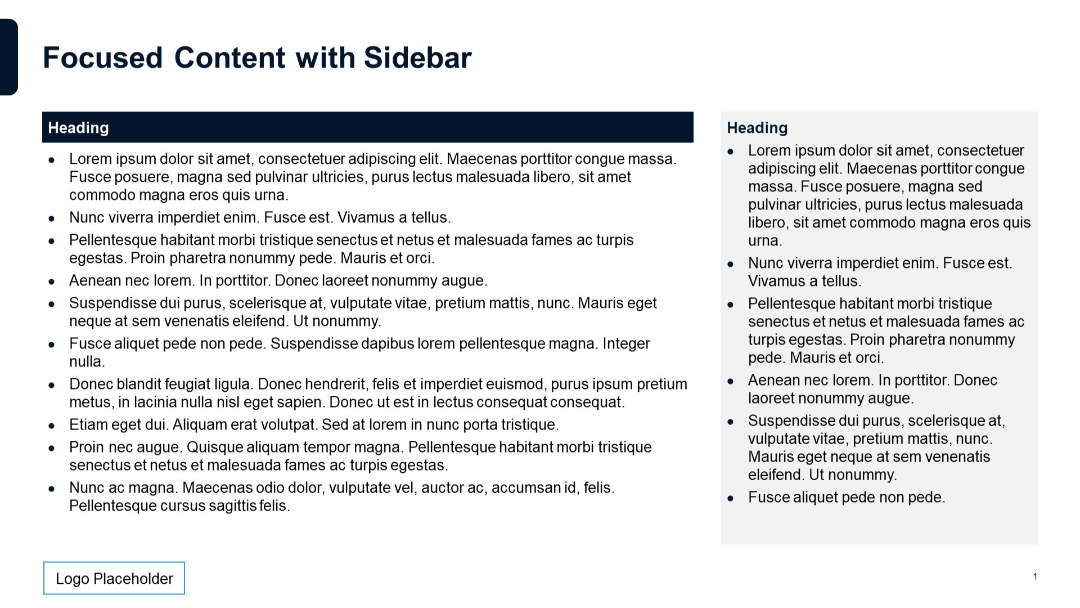
Main content on left with bullet points and dark heading. Light grey sidebar on right containing a shorter list with same structure.
PRO
Light theme version of the title slide; clean layout, title centered with supporting subtitle below.

PRO
A full-width stacked area chart over quarterly periods from Q1 2019 to Q4 2021, showing five data segments distinguished by color.


