PRO
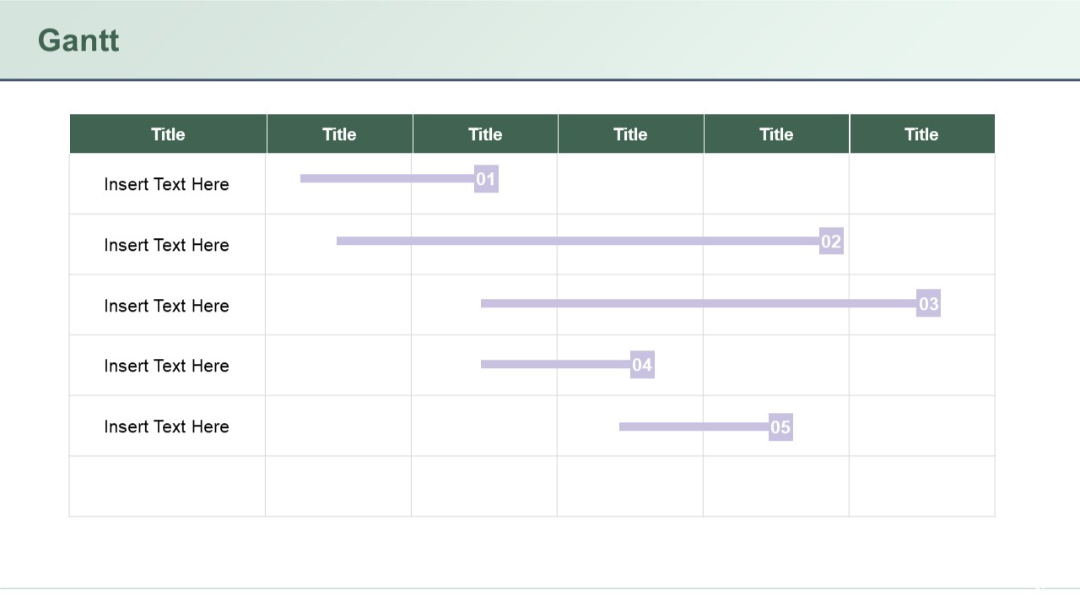
Horizontal bar chart with rows and columns; light purple bars across a grid representing tasks over time. Dark green headers, minimal labeling.
PRO
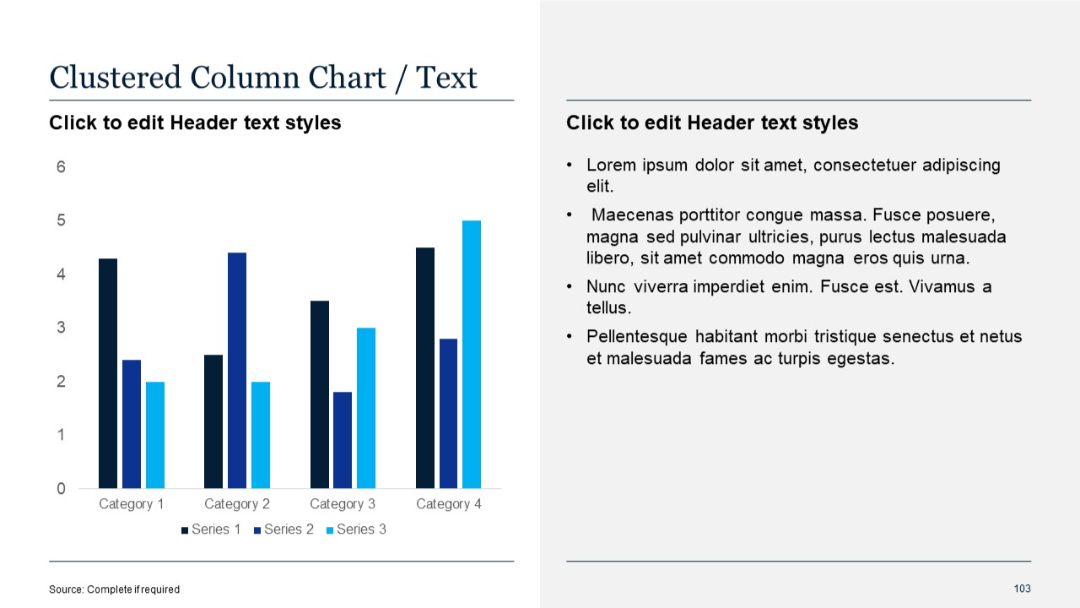
Left side features a clustered column chart; right side contains standard bullet text layout.
PRO
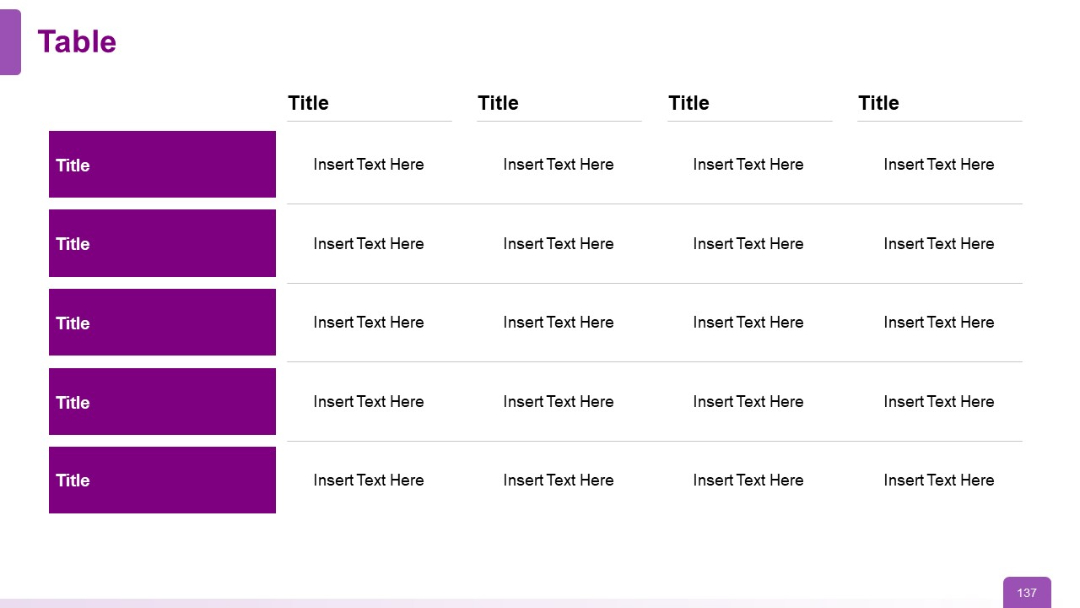
Extended table with five rows, maintaining the format of purple title columns and placeholder text across the grid. Balanced and symmetrical layout.
PRO
Grid layout of 5 rows of minimalist line icons in purple; icons represent arrows, navigation directions, and basic UI actions like play, check, etc.
PRO
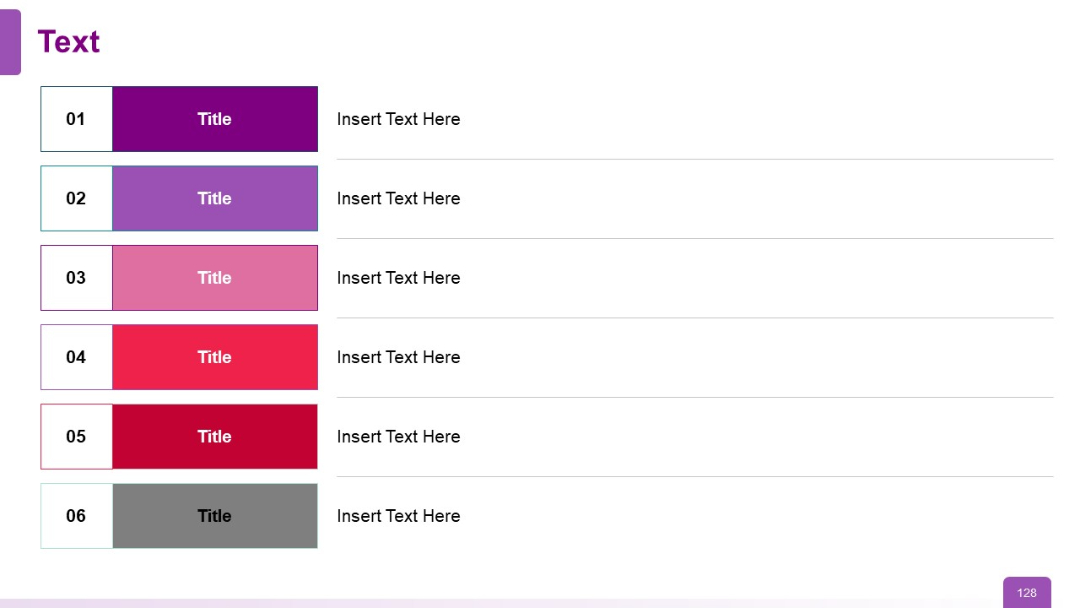
Four modular blocks with vertically stacked labels showing number and title, paired with content blocks on the right. Rounded corners, soft colors.
PRO
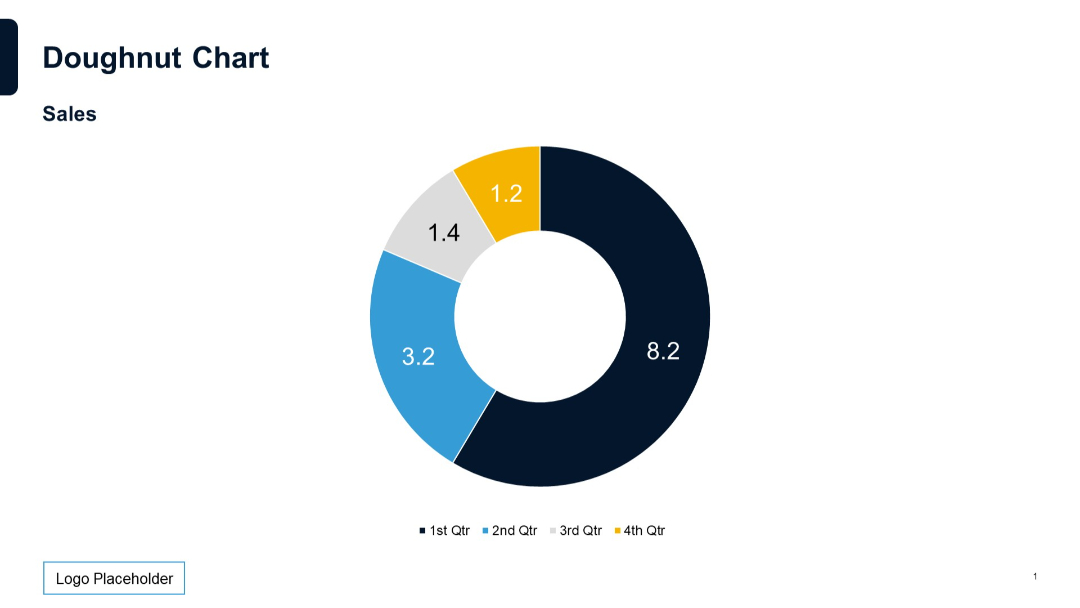
Circular doughnut chart with four color-coded segments, center cutout, and labeled data values; includes title and legend at the bottom.
PRO
Smartphone graphic on left with five horizontal text boxes connected by lines.
PRO
Grid of four testimonials featuring avatars, quote marks, and text boxes. Balanced two-column layout with user profile icons.
PRO
Three horizontal rectangular blocks in gradient shades of pink and purple, each with bold left-side labels, icons (screen, thumbs-up, bulb), and bullet-point text on the right.
PRO
Circular infographic split into 5 equal segments, each leading to a circular label. Minimalist, clean layout with dark blue tones.

PRO
Matrix-style layout on a dark background showing four quadrants with descriptors for varying levels of digital maturity and value. A key takeaway is highlighted at the top.

PRO
Three evenly spaced text columns with subtitles; minimal layout; white background; logo placeholder bottom left.
PRO
Waterfall chart on the left with vertical columns showing total impact, and standard column chart on the right with single-series vertical bars across categories.

PRO
Simplified block-style org chart with rectangles and colored circles beneath them, indicating departments and team members.
PRO
Bold horizontal bars in red-orange connected to circular icons. List of five items in a stacked vertical layout.
PRO
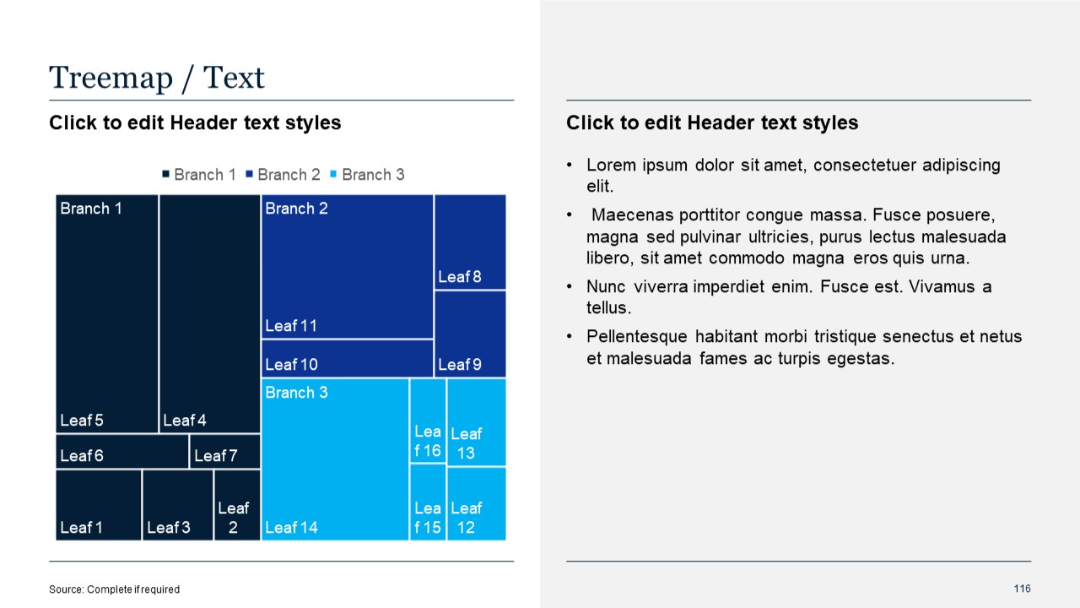
Treemap chart on left with hierarchical blocks; text placeholder on right side in standard format.
PRO
Four circular ribbon-like icons with numbers (1–4) below each, spaced horizontally, each labeled “Title” with accompanying placeholder text underneath.
PRO
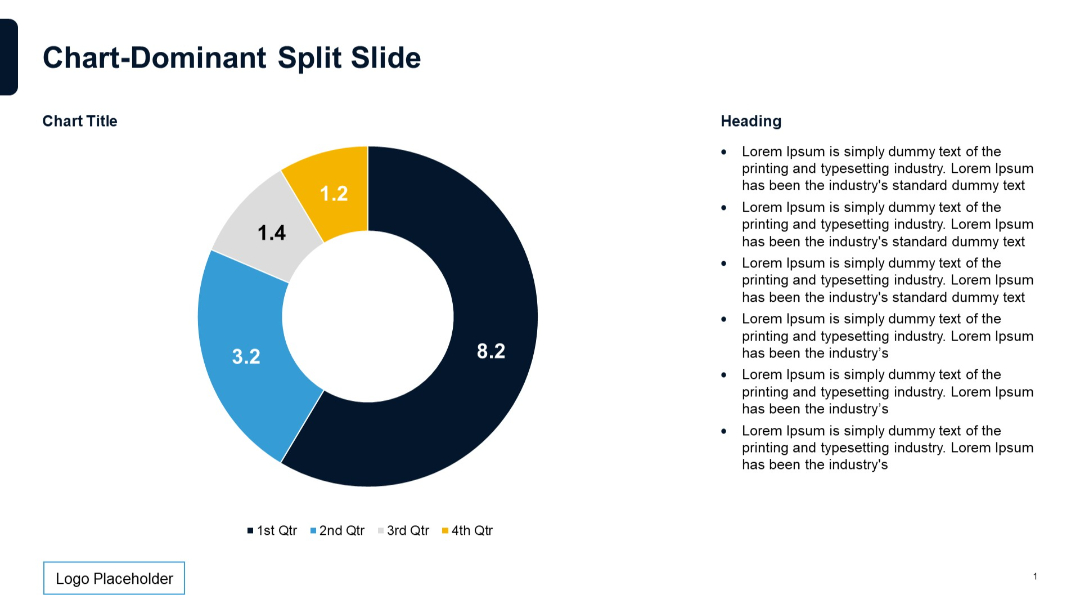
Donut chart with four colored segments; large value labels; insight bullets on right.
PRO
Two-column timeline layout with vertical dividers and red bullet points; each item includes a box with a placeholder title and text.
PRO
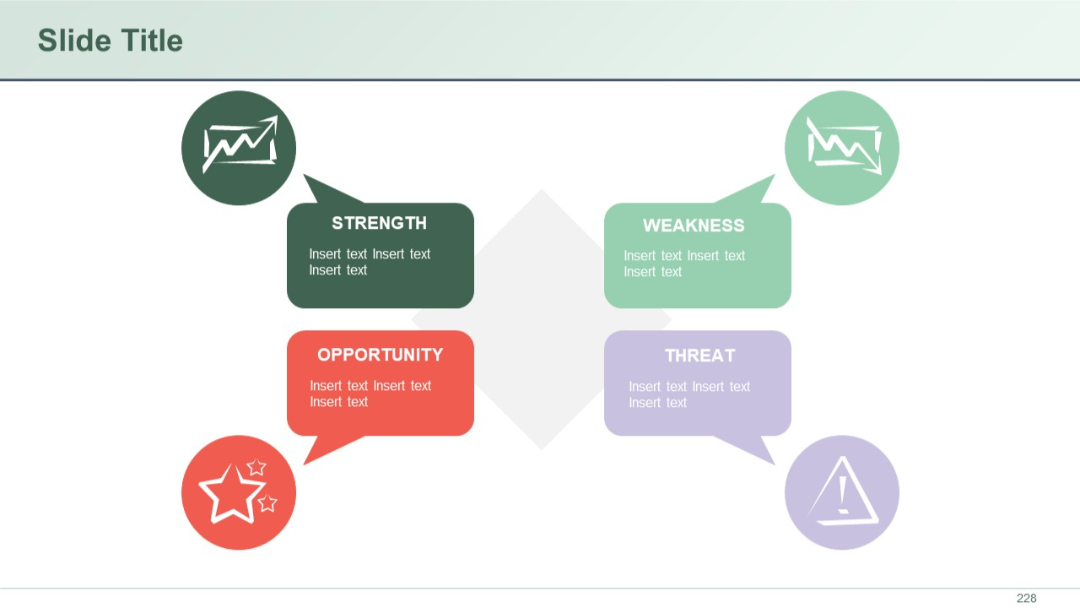
Four quadrants around a diamond shape: Strength, Weakness, Opportunity, Threat. Includes icons and color-coded labels.
PRO
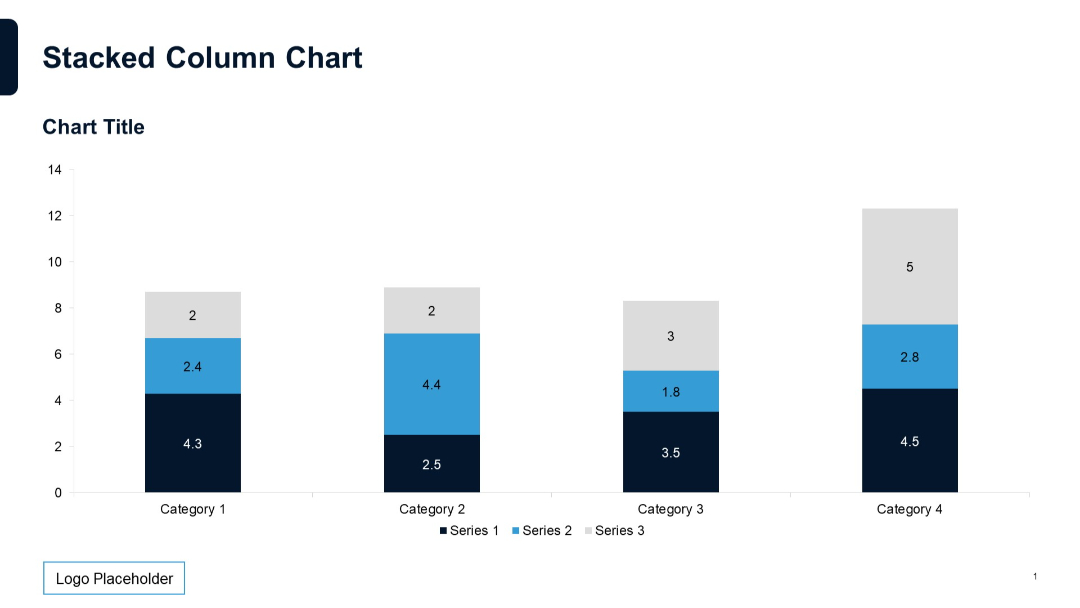
Three-segment vertical bars for four categories, left-aligned title, legend at bottom, logo in lower left corner, minimal design on white background.
PRO
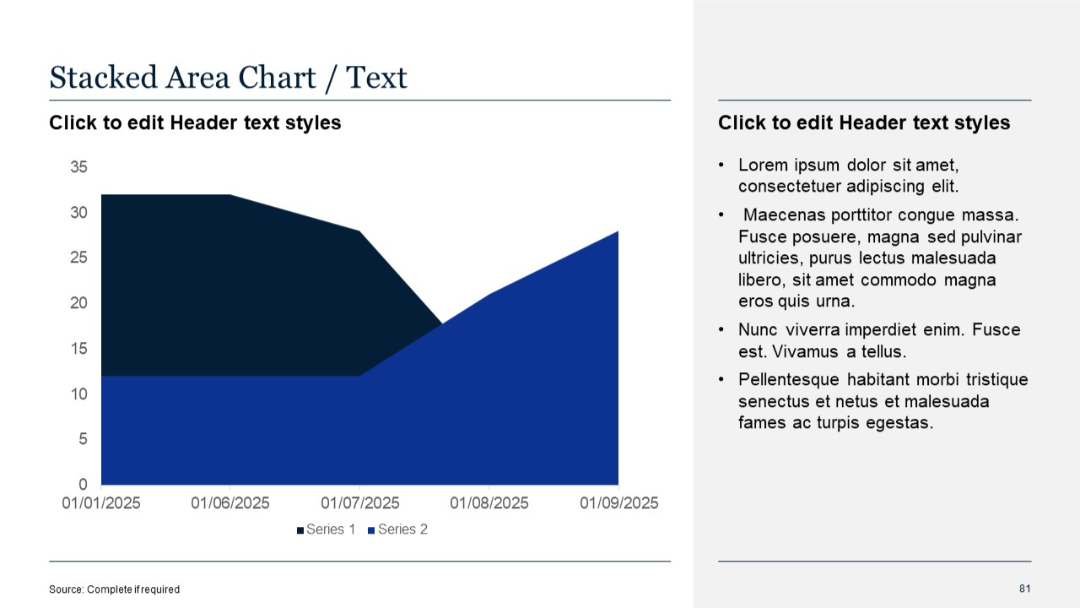
Two-column layout with a stacked area chart on the left and bulleted text on the right
PRO
Vertical timeline with six steps, each colored differently with step number, title, and description space.
PRO
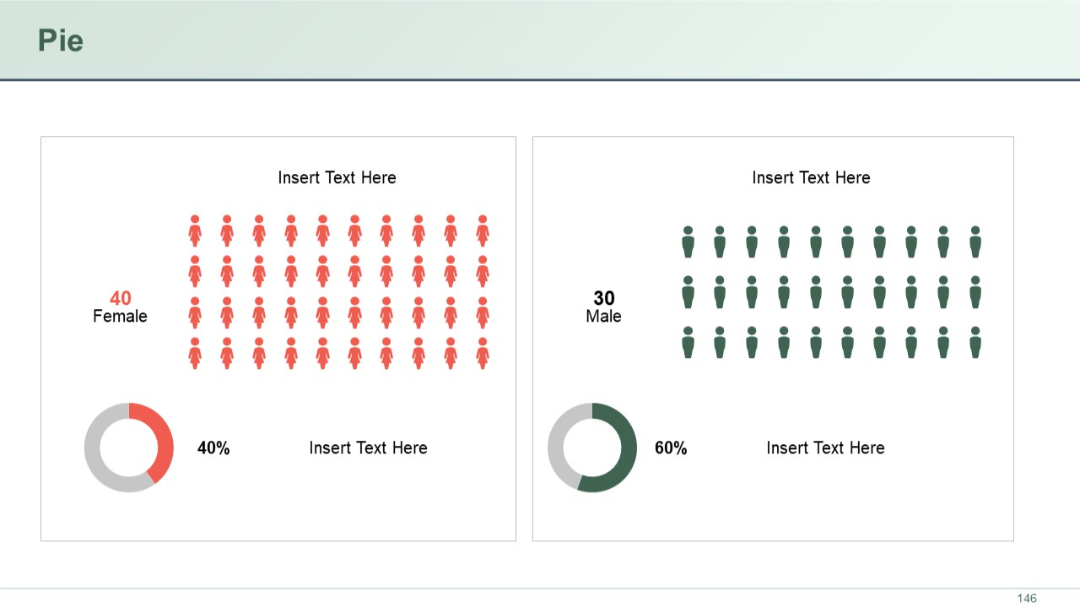
Two side-by-side infographics showing gender distribution with people icons, total counts, and donut charts for visual emphasis.
PRO
Dual-column comparison tables with headers in bold and color-coded columns (purple and red variants). Simple alternating row structure for clarity.

PRO
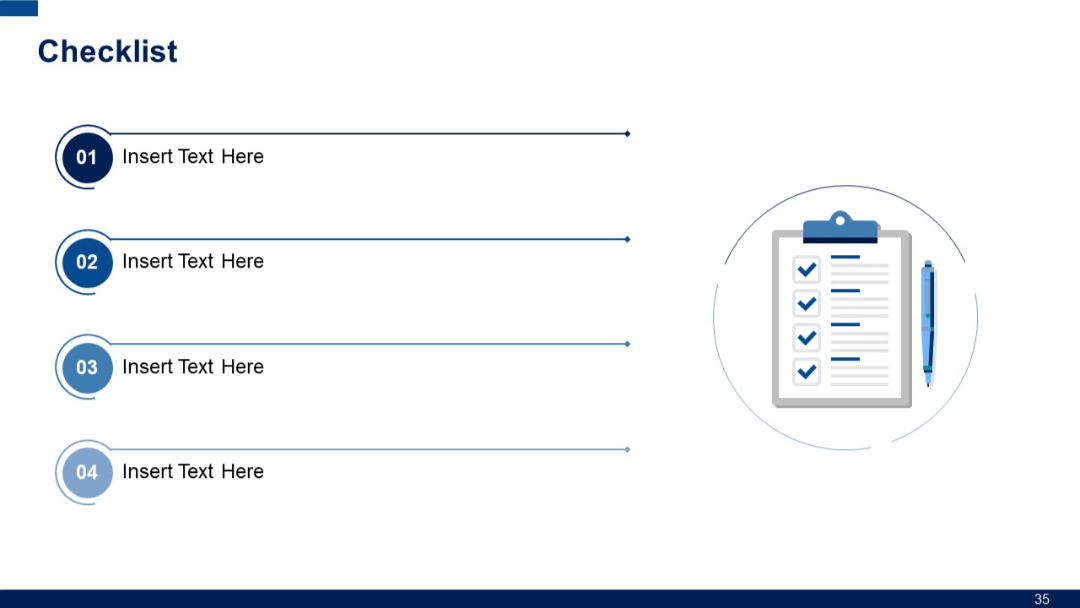
Left-aligned numbered points with corresponding arrows pointing right; includes a checklist graphic with pen illustration on the right.
PRO
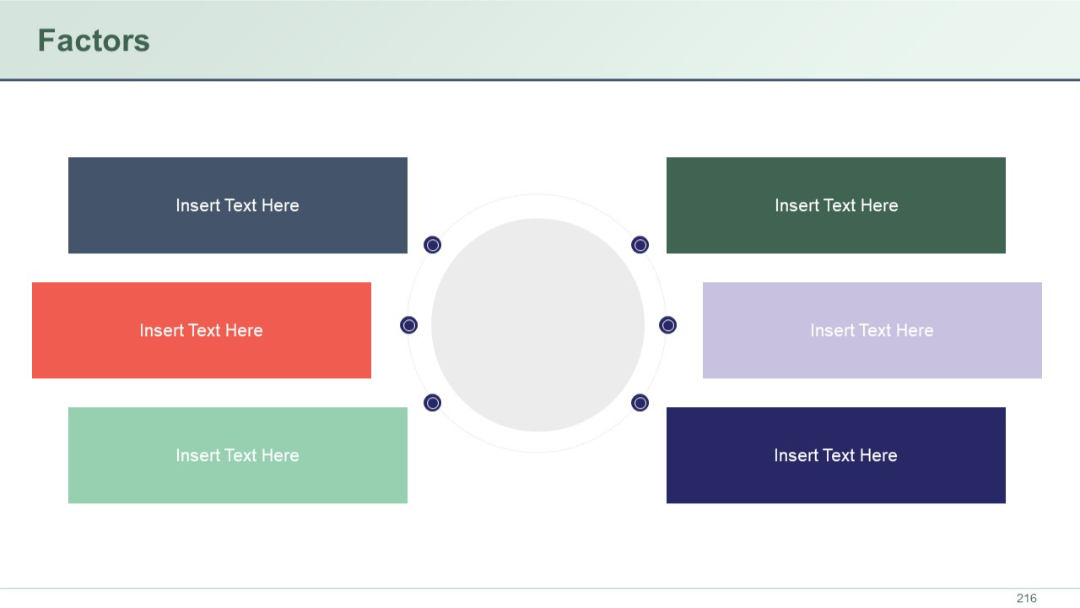
A radial layout with a central circle surrounded by six horizontally aligned rectangular blocks, three on each side, each colored and labeled with placeholder text.
PRO
Left-aligned three-section layout with icons and headers (purple, lavender, pink) beside bullet points.

PRO
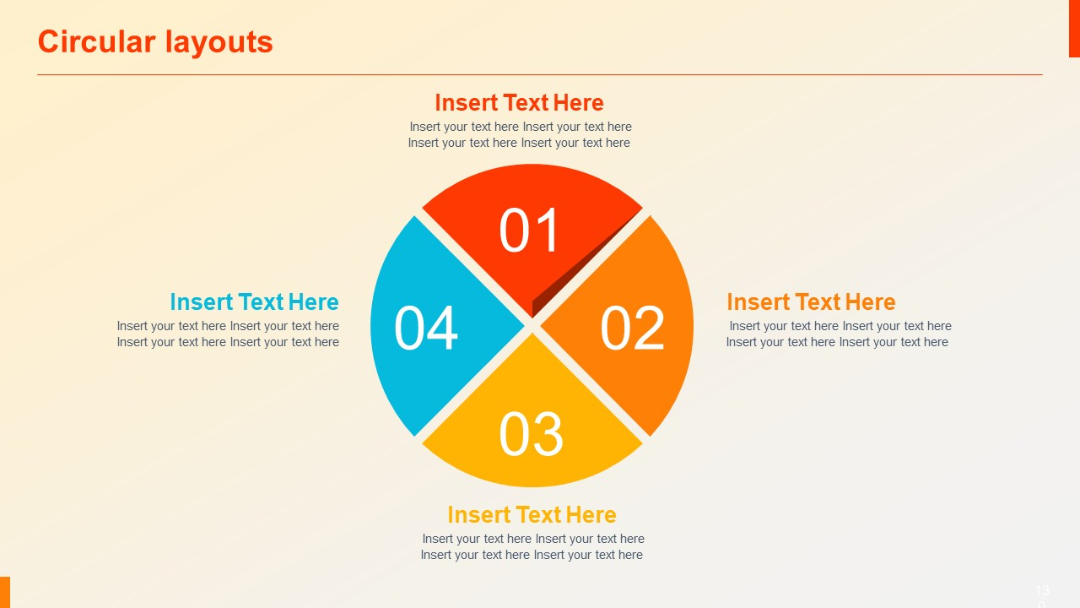
A four-quadrant pie chart numbered 01–04 with color-coded sections and matching editable text around the circle.
PRO
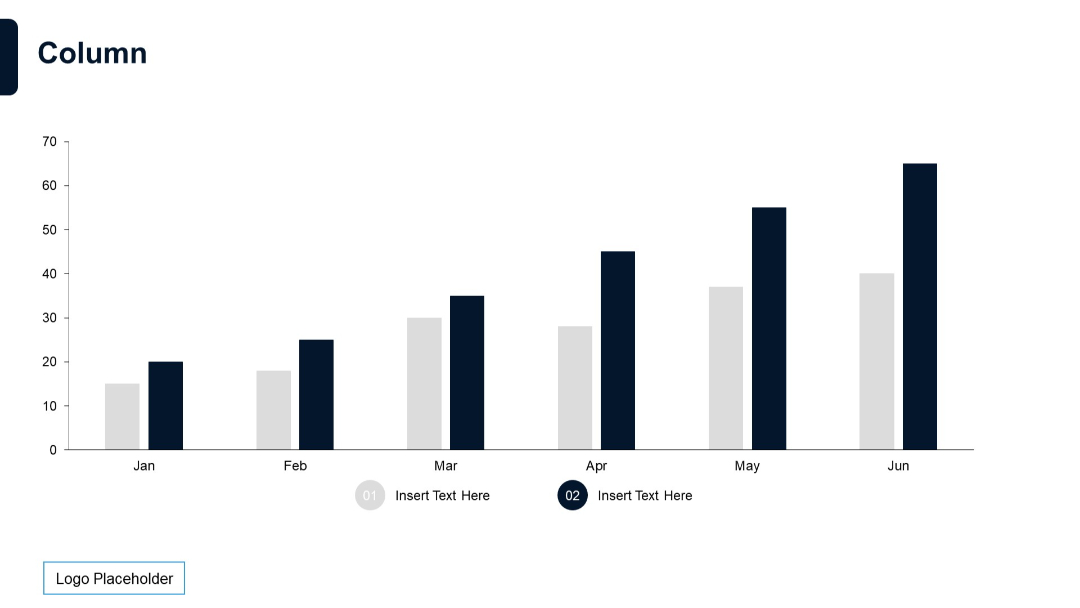
Dual-color vertical column chart for Jan–Jun, showing two data series. Below, two circular text placeholders marked 01 and 02.