PRO
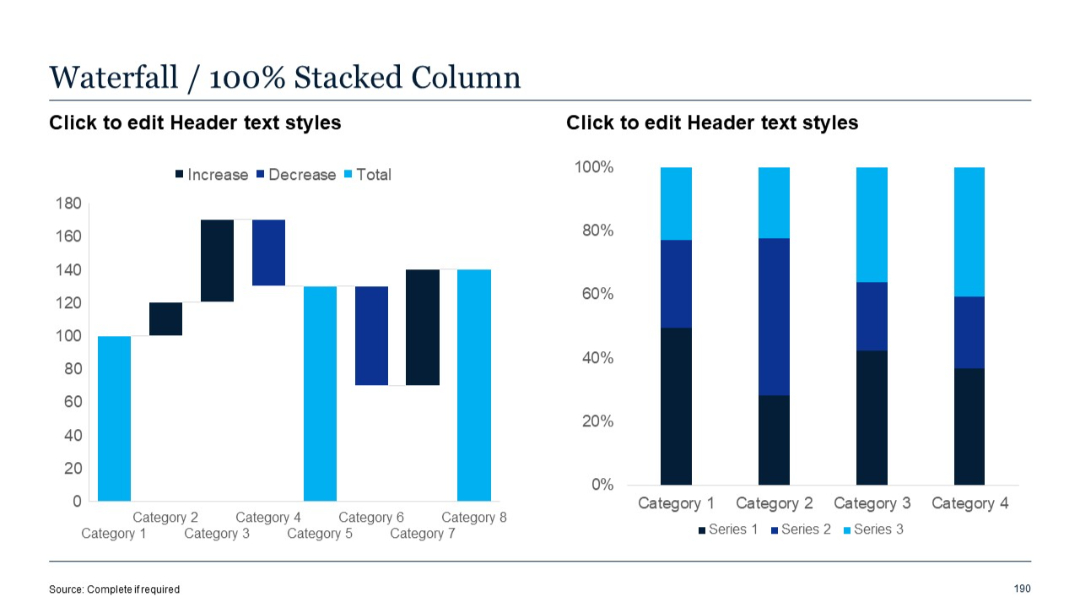
Waterfall chart (left) and 100% stacked column chart (right), showing proportional contributions of three series per category.
PRO
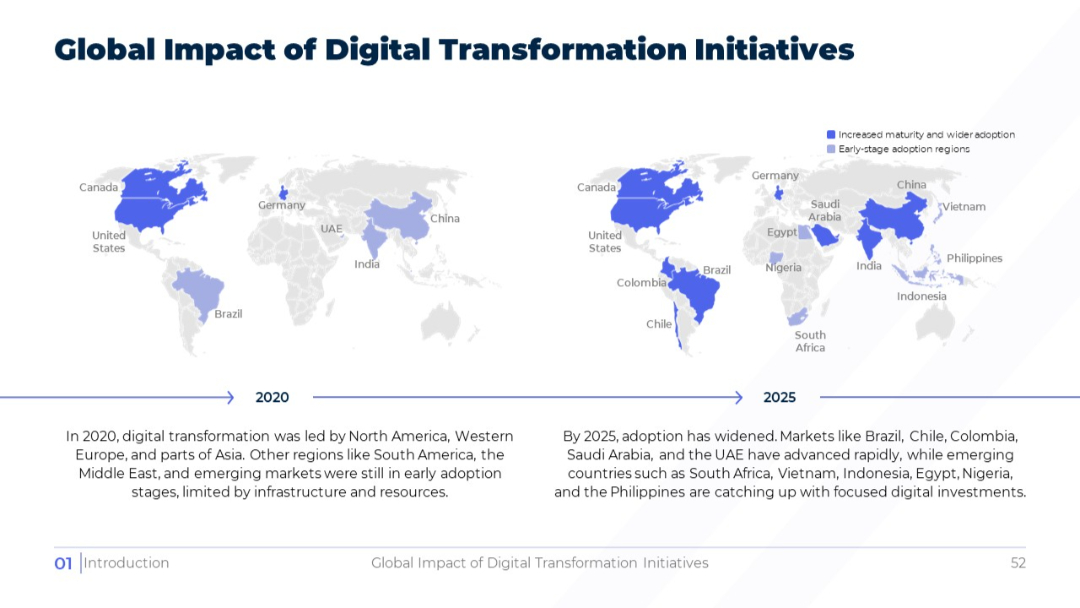
Side-by-side world maps for 2020 and 2025 showing country adoption maturity in darker/lighter shades; explanatory text at the bottom.
PRO
Grid of six horizontally aligned diamond-shaped icons with circular numbering, each linked to a rectangular title-text block.
PRO
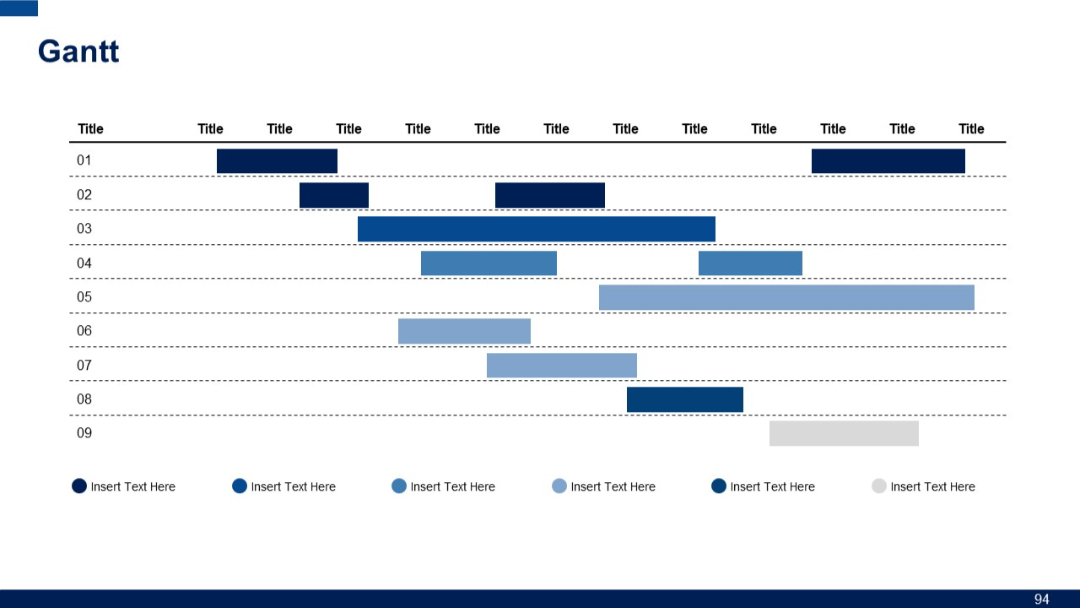
Grid-based Gantt chart with nine rows and multiple color-coded horizontal bars representing various activities across several columns.
PRO
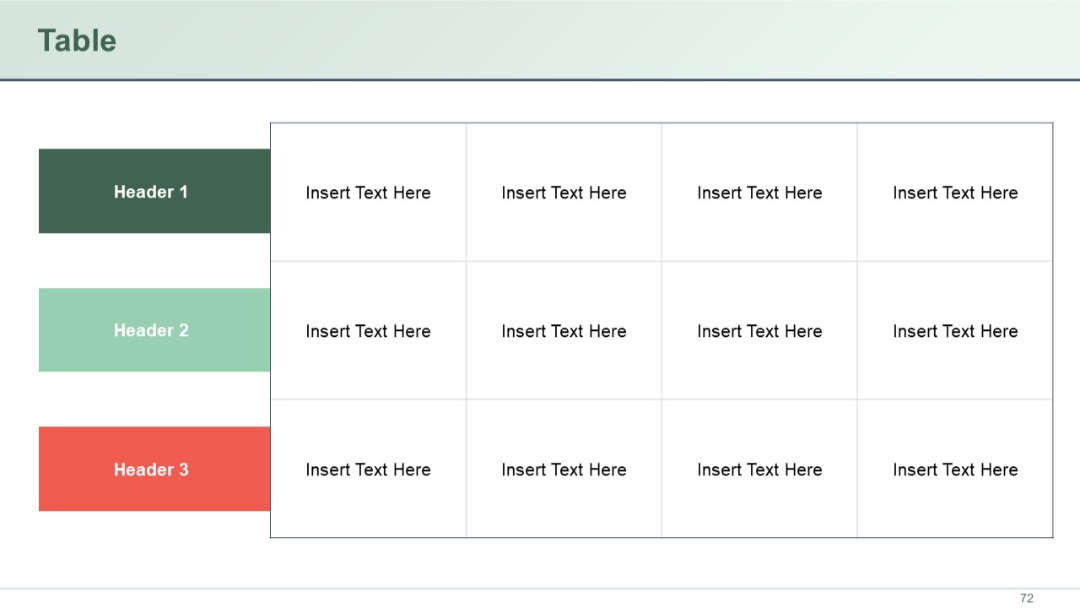
A color-coded 4-column table with three left-side row headers in dark green, light green, and red. Right cells are empty with “Insert Text Here.”
PRO
Clean, white background; structured into 4 equal horizontal blocks with icons and bold headers; blue numbering; modern professional layout.

PRO
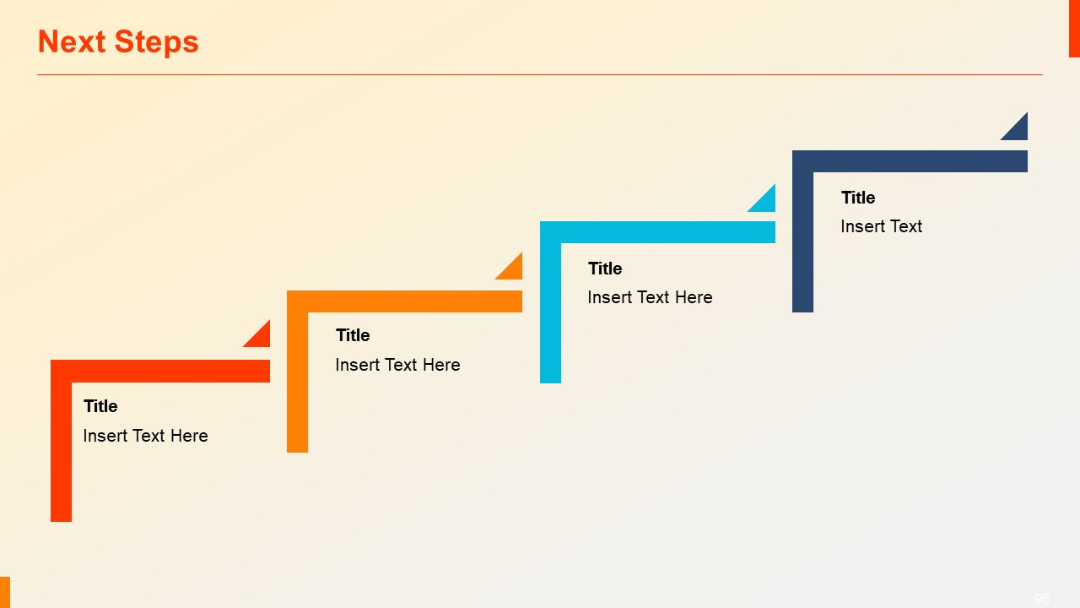
Stair-step style layout with four L-shaped segments in ascending order from left to right, each labeled with title and editable text.
PRO
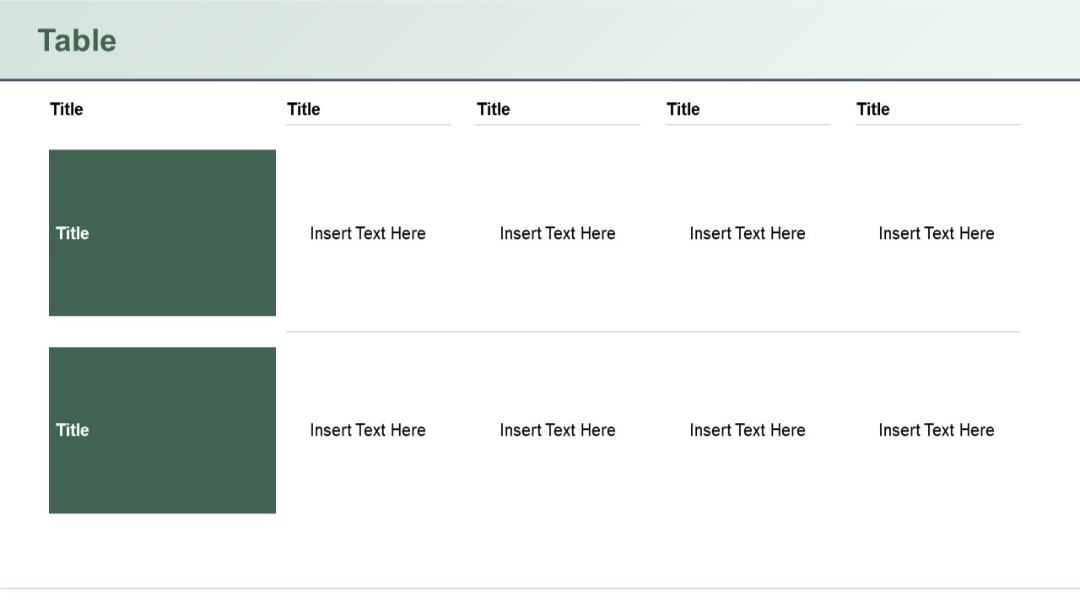
Horizontal table layout with two main rows. Each row has one large shaded cell (left) and four textual columns (right) aligned horizontally with placeholder text.
PRO
Vertical timeline with five stages; left side has numbered circular markers, right has title and text.

PRO
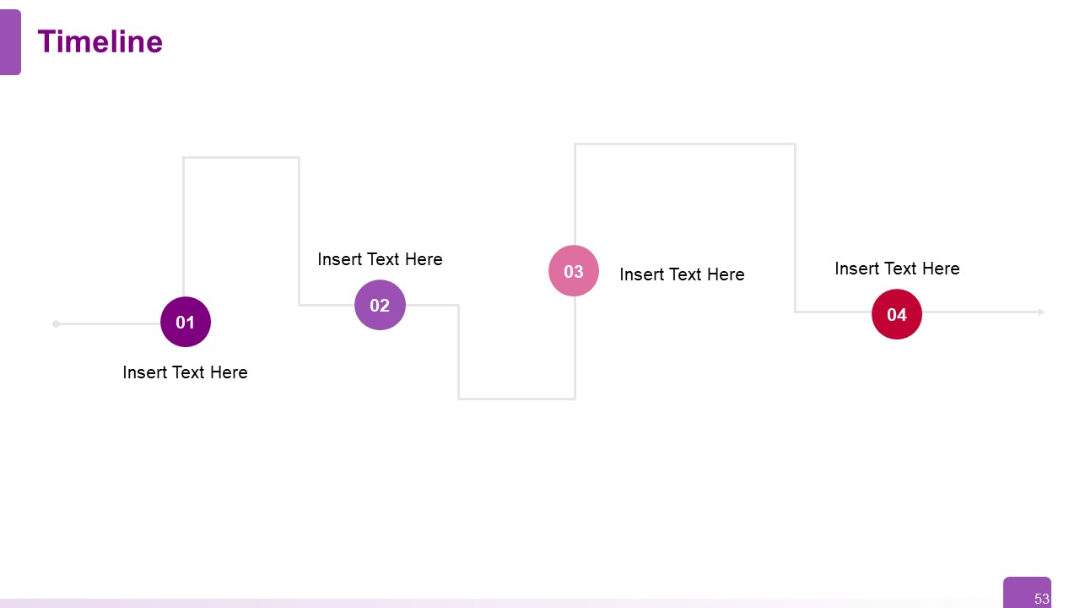
Zigzag-style vertical flow with four circular nodes (01–04) connected by alternating vertical lines and right-angled connectors.
PRO
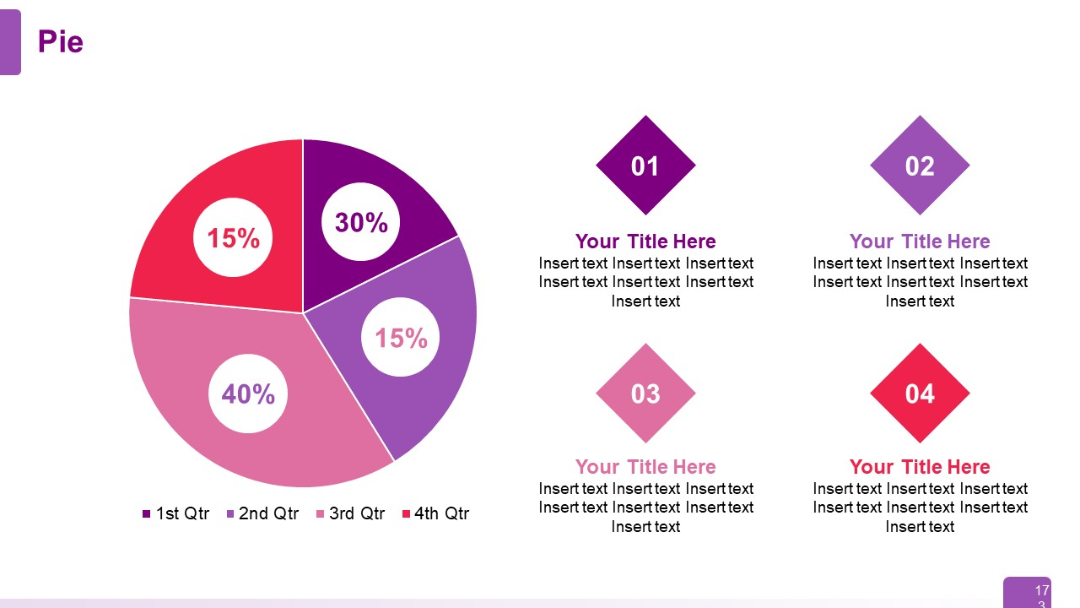
Central pie chart divided into four colorful segments (15%, 30%, 15%, 40%) representing quarters. Four diamond shapes on the right side with placeholders for titles and text.
PRO
Three evenly spaced vertical columns with subtitles and text placeholders. Balanced design, ideal for comparisons or listing items in parallel.
PRO
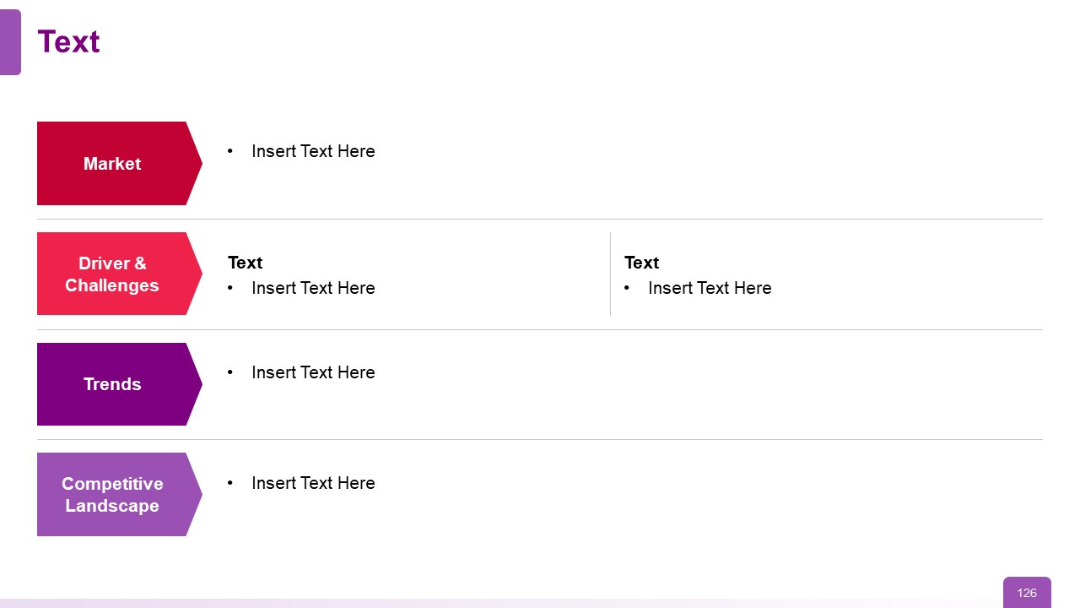
Left-side arrow graphics with colored section titles (Market, Drivers, Trends), aligned with bullet point content.
PRO
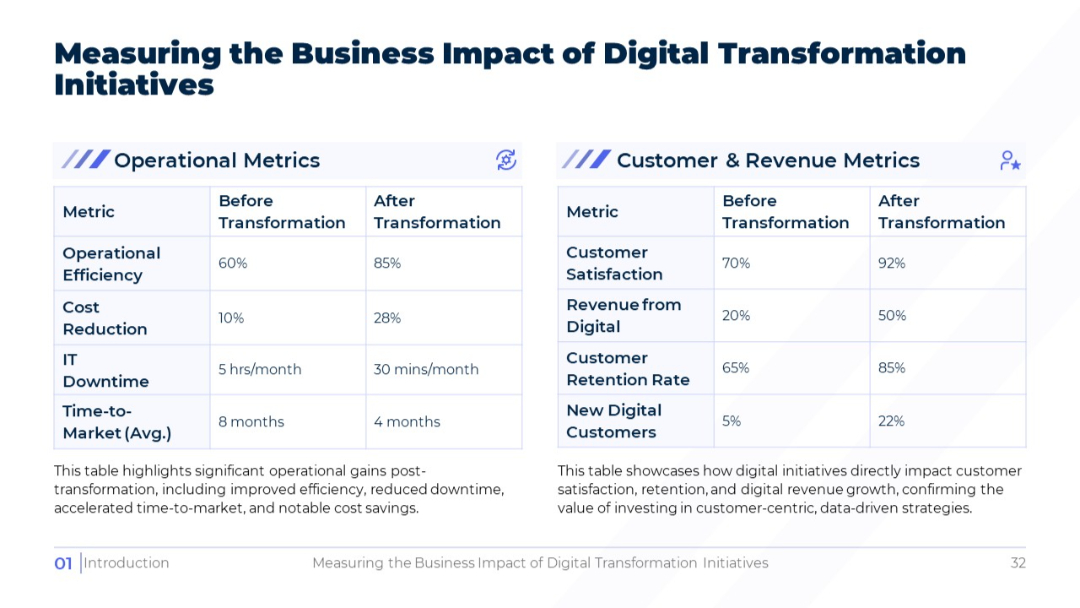
Split-screen layout with two data tables: Operational Metrics (left) and Customer & Revenue Metrics (right). Each table includes "Before" and "After" columns.
PRO
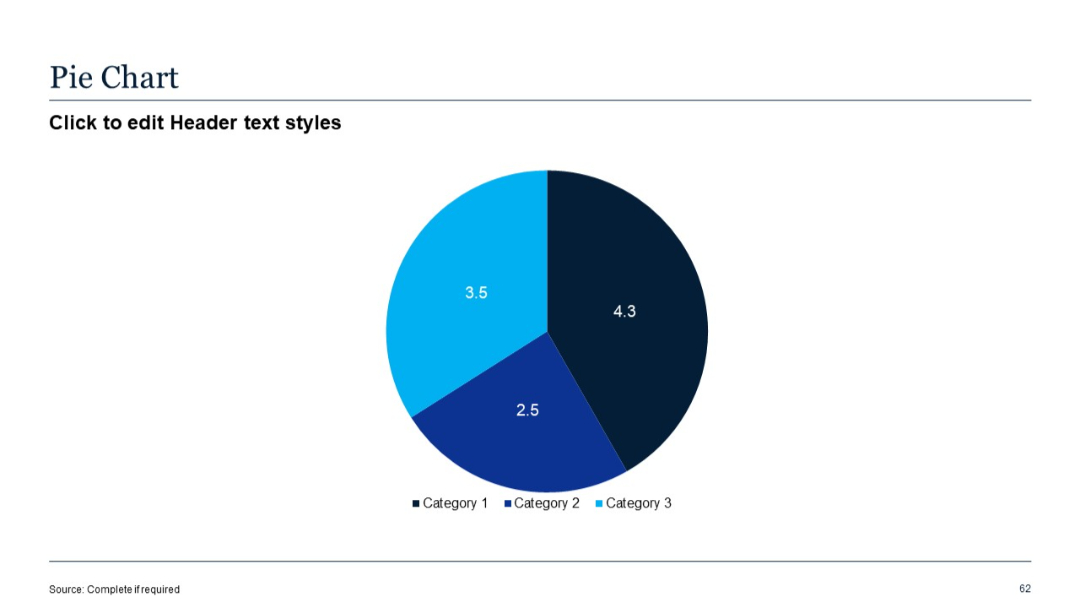
Centered pie chart with three segments in blue shades; minimalistic design with category labels.
PRO
Four sequentially numbered circular shapes (1–4), arranged horizontally with descriptive text under each. Increasingly lighter shade of blue left to right.
PRO
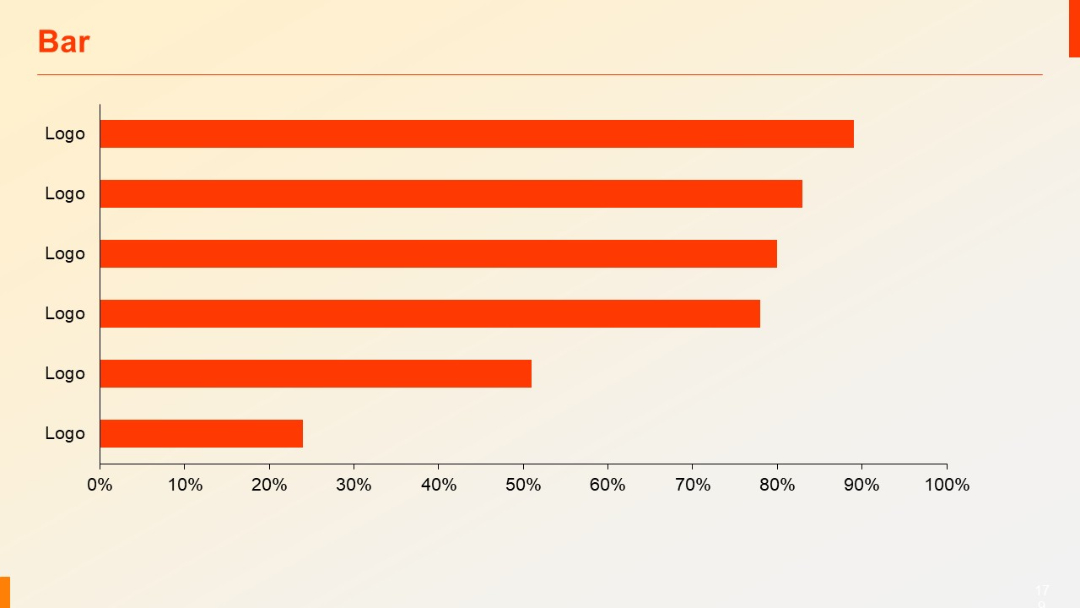
Horizontal bar chart with identical “Logo” labels on the Y-axis. Bars are in orange, aligned from highest to lowest.
PRO
Zigzag flow from left to right with 4 numbered circular nodes and connecting vertical lines. Alternating top-bottom text placements.
PRO
Three horizontal colored blocks labeled Vision, Mission, Goals, each paired with icons on the left; simple linear layout on light gradient.
PRO
Another grid of line-style icons related to education, communication, and recognition displayed in rows.

PRO
Icons arranged in rows depicting clocks, calendars, stopwatches, timers, and watches, all using simple, outline-based design.
PRO
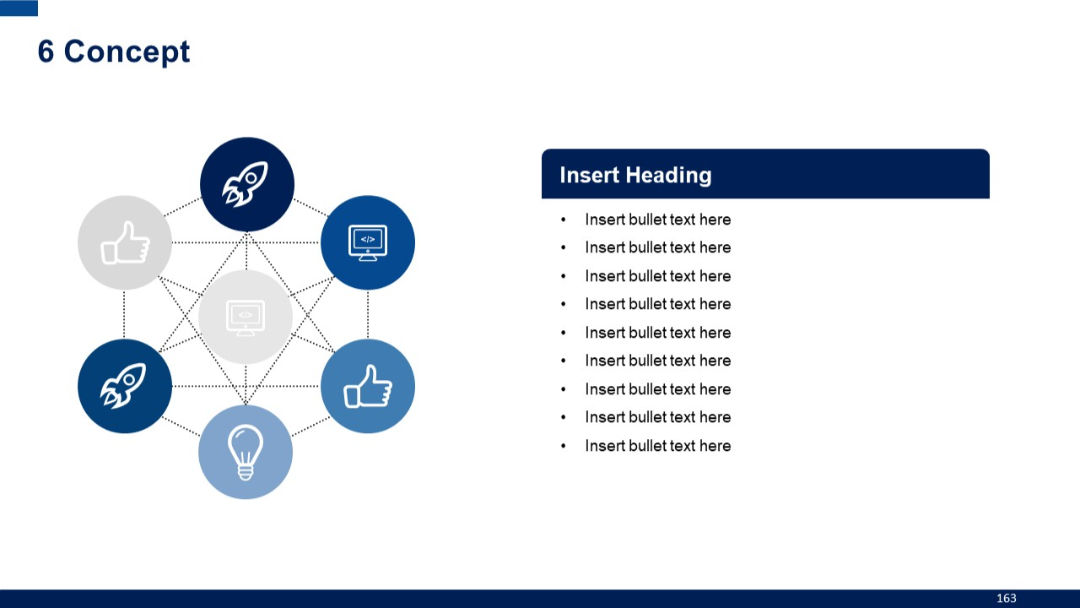
Centralized network of six icons in a hexagonal pattern, fully interconnected. Right panel maintains bullet format with dark blue header.
PRO
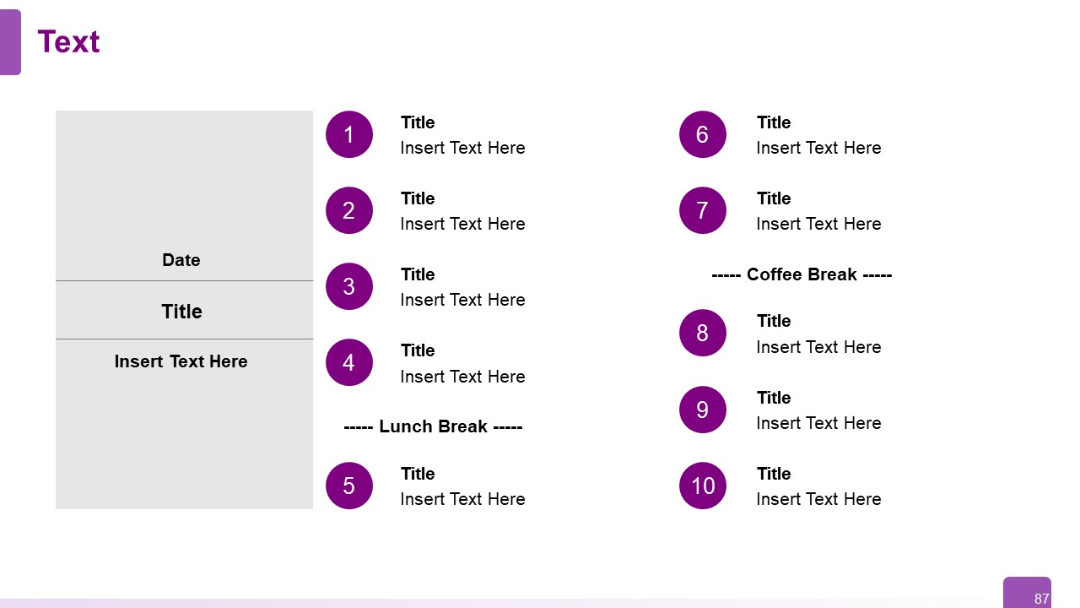
Event agenda format with numbered purple circles. Left block for date and session title, right side lists 10 agenda items with breaks included.
PRO
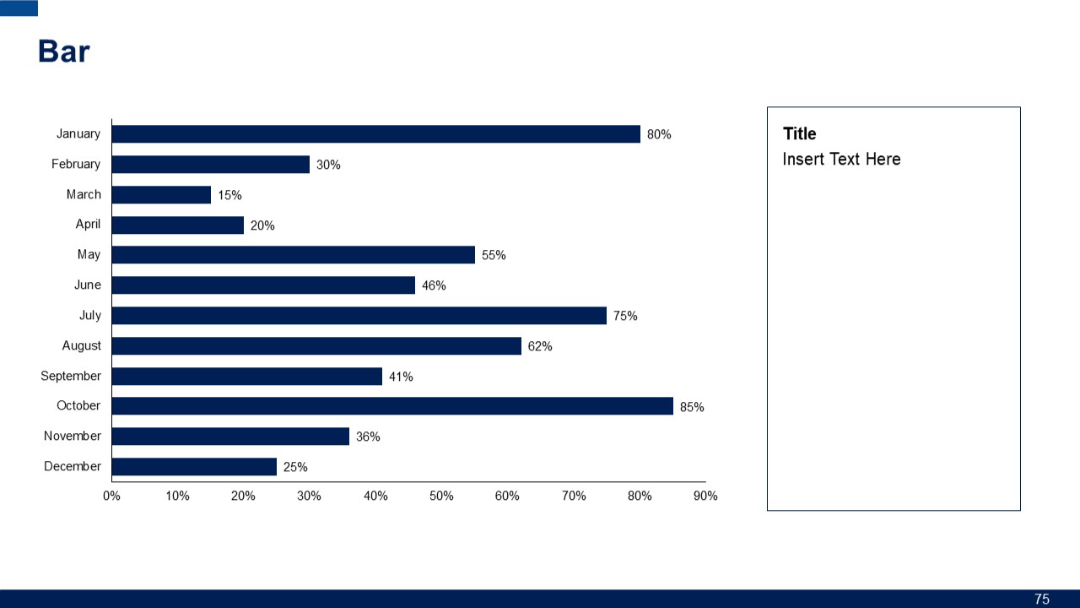
Horizontal bar chart with months on the y-axis and varying percentages. Right side contains a large empty text box labeled “Title.”
PRO
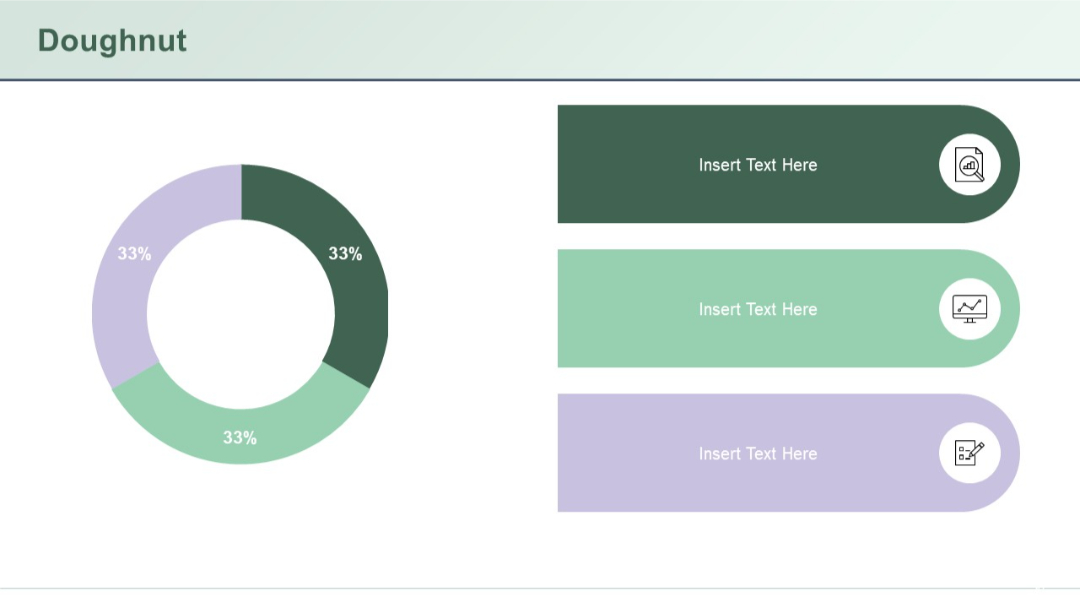
A single donut chart (33% split three ways) with three large rounded text boxes and icons to the right.
PRO
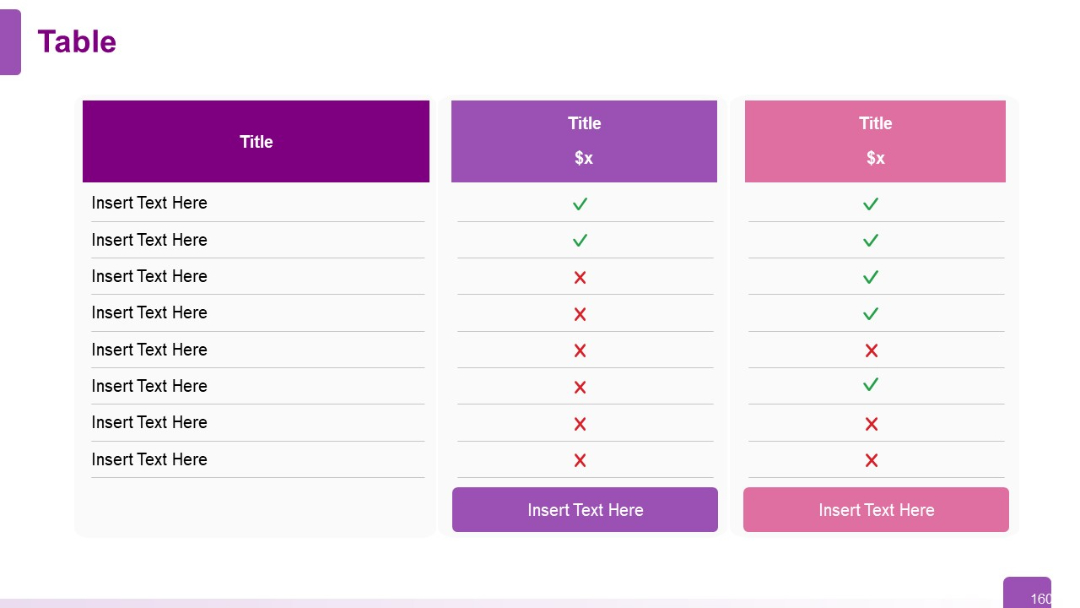
Similar to Slide 159 with fewer columns (only two options compared). Simple layout with pricing labels and feature availability via icons.
PRO
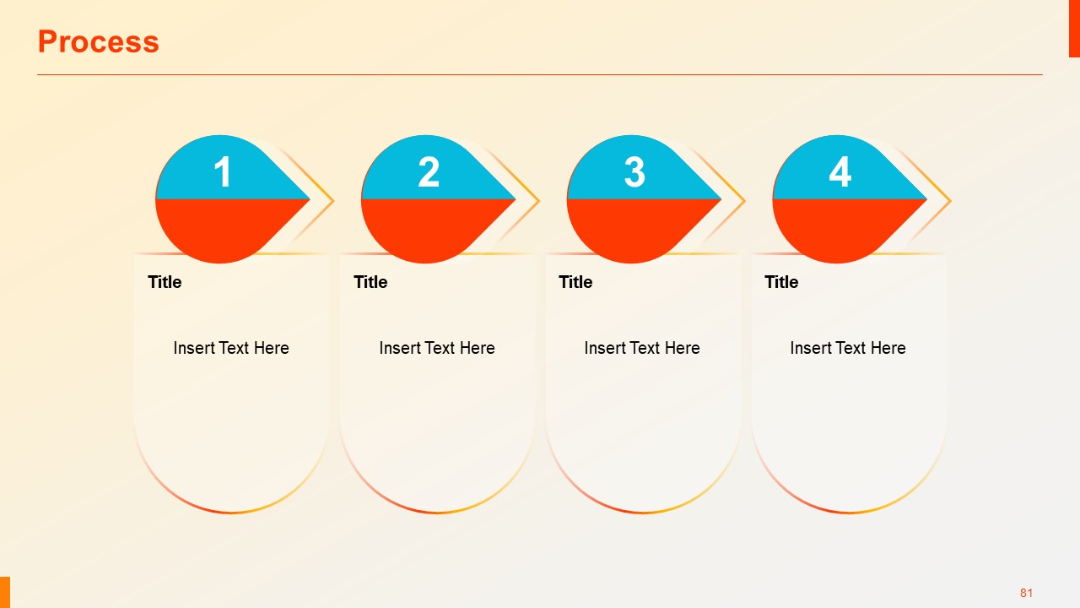
Four rounded vertical containers with arrow-tipped circles labeled 1–4 at the top. Light background and shadowed design with placeholders for text.
PRO
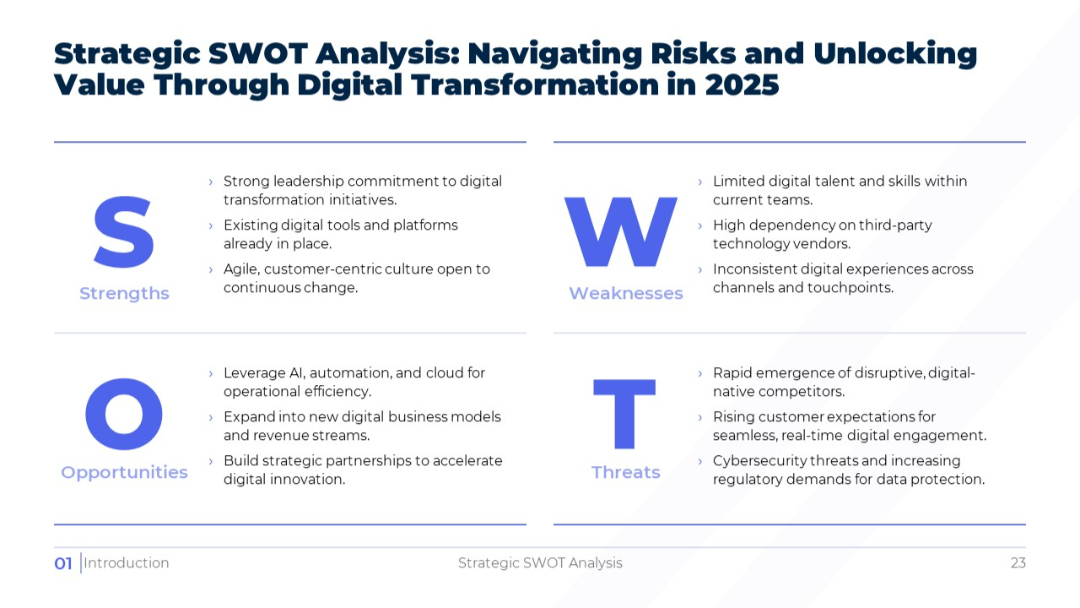
Clean, light-themed 2x2 SWOT matrix layout with large S-W-O-T letters and text under each quadrant.
PRO
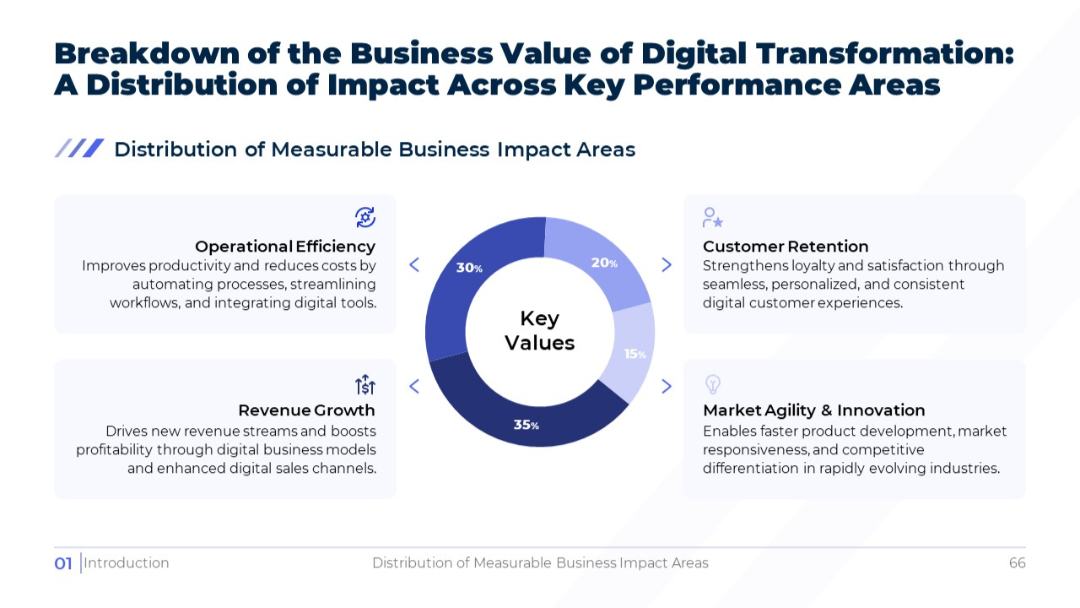
Circular donut chart at the center, with four surrounding labeled boxes explaining each impact area. Bright white background with blue tones.
PRO
Dual waterfall charts showing increase, decrease, and total. Charts use step-style bars in three colors across multiple categories.


