PRO
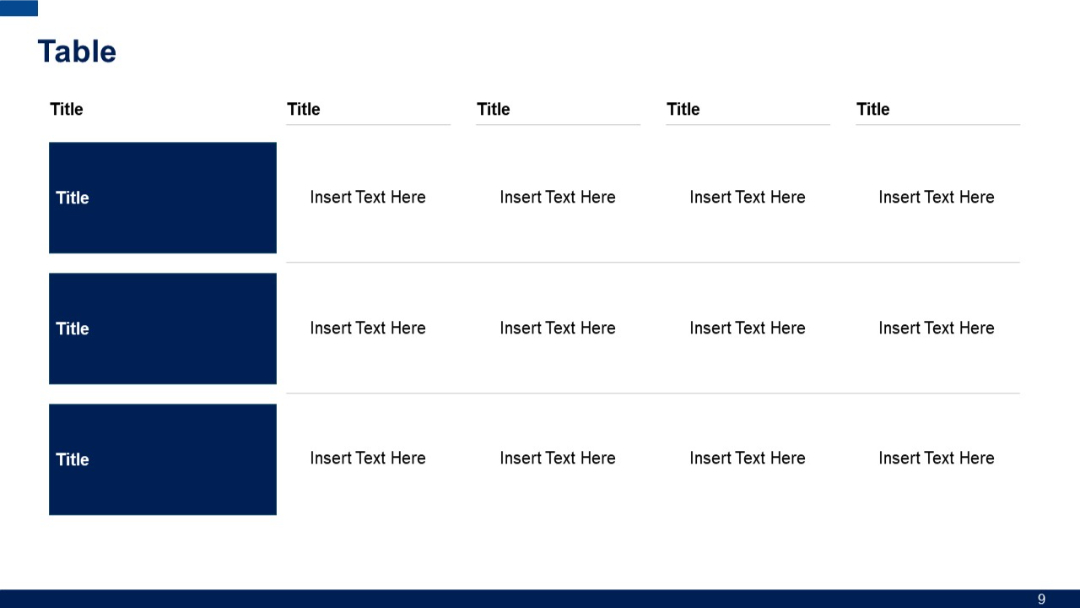
Four-row, five-column table. First column contains bold purple boxes as row headers; remaining cells are placeholders. Uniform structure.
PRO
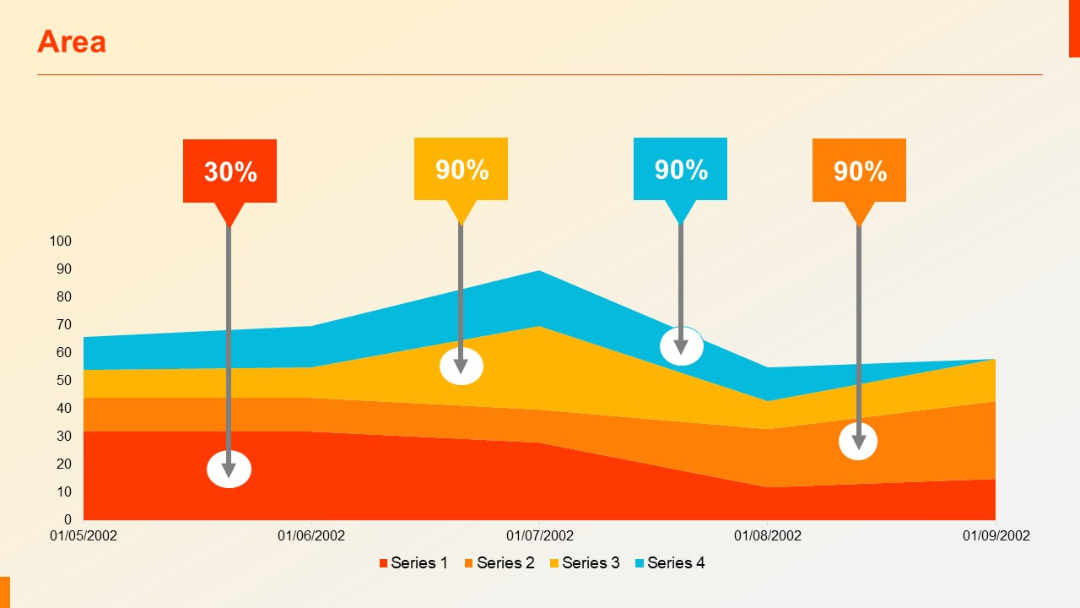
Multi-series area chart with four data series stacked. Percentage markers and labels (30%, 90%) are used for emphasis above specific data points.
PRO
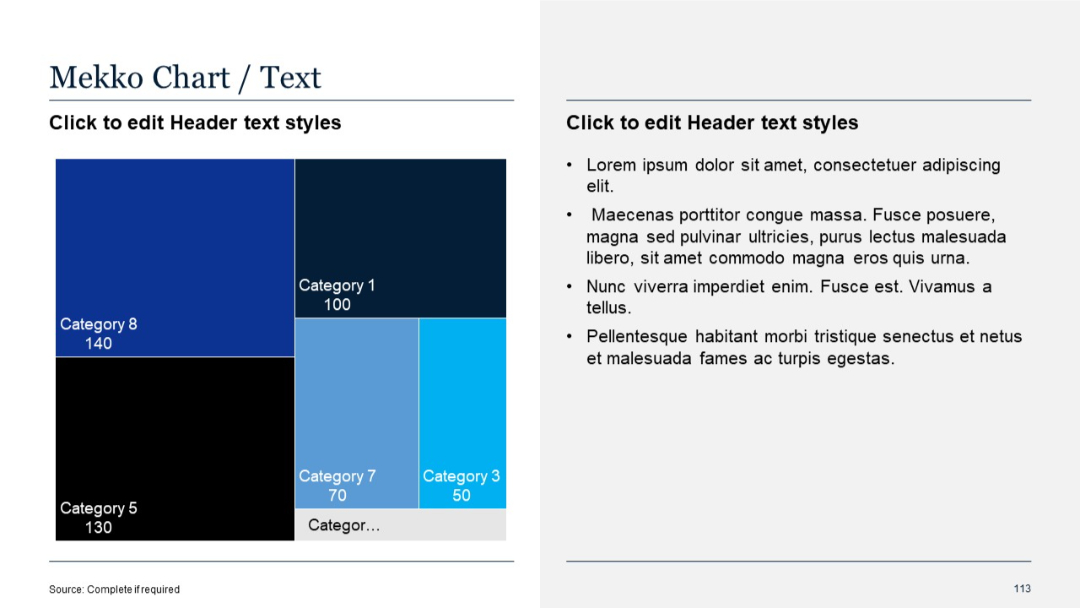
Mekko chart on left showing categories in varied block sizes by value; text on right in standard bullet list.
PRO
Horizontal timeline with alternating colored rectangular titles above and below a central line.
PRO
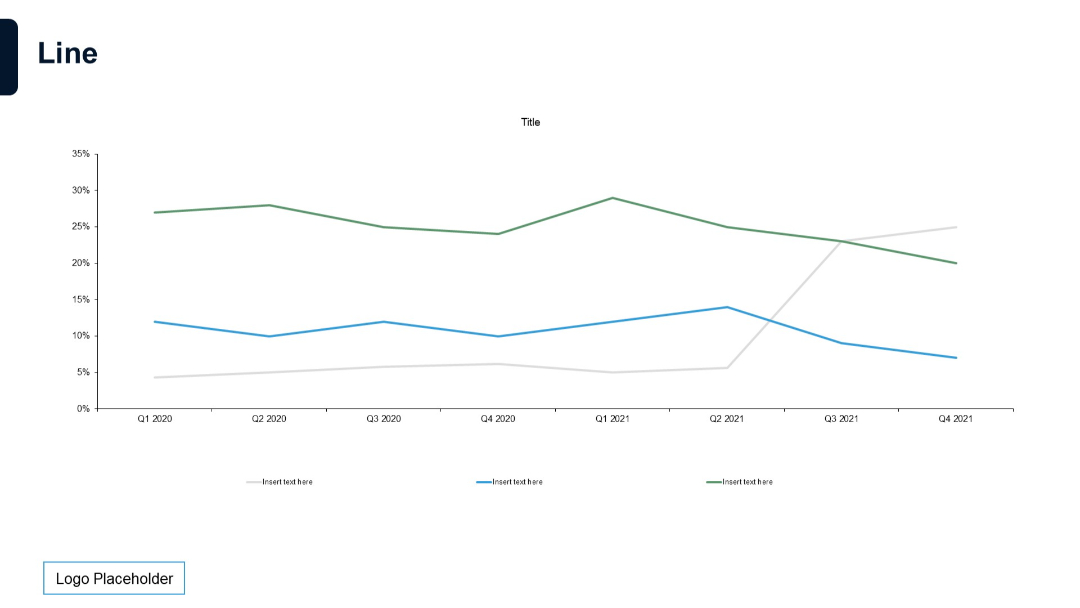
Full-width line chart with four series. Simple grid with quarterly time axis and minimal styling.
PRO
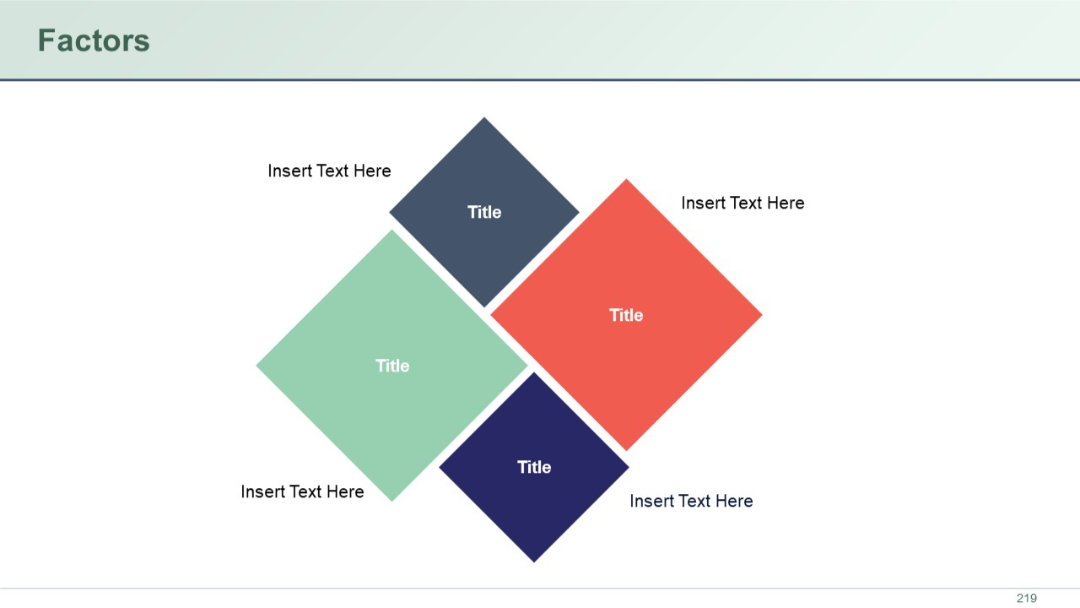
Four diamond-shaped blocks in a square arrangement, each labeled “Title” with accompanying placeholder text on each side.
PRO
Similar to previous, but includes three title rows on the left; horizontal fields aligned per row, suggesting more grouped data layout.
PRO
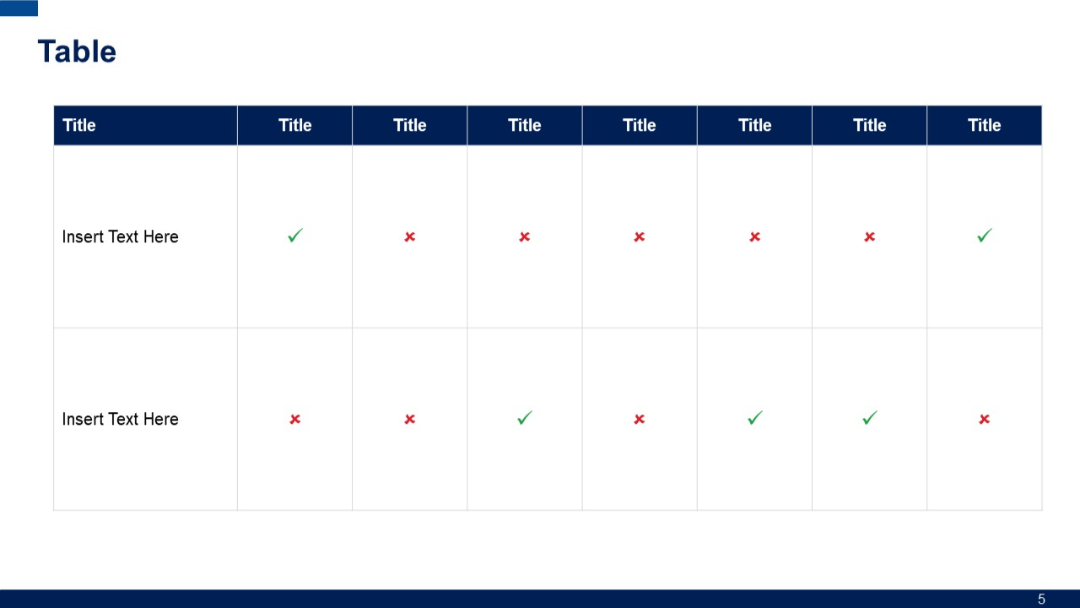
A grid-based table with alternating checkmarks and crosses; top row uses dark blue background for headers; two rows for data input.
PRO
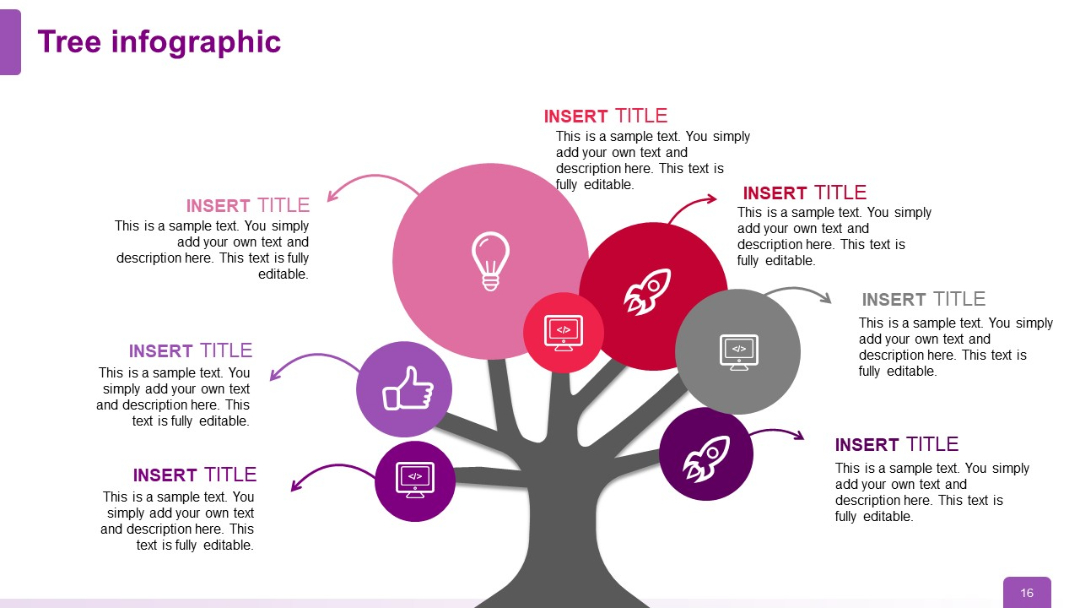
Tree structure now has seven nodes; icons include computers, rockets, lightbulb, thumbs up; layout becomes visually full and comprehensive.
PRO
A grid layout with 2 rows and 3 columns of text boxes, each with a bold heading and bullet points. Alternating blue and dark headers.

PRO
Three colorful blocks labeled 30, 60, and 90 Day, each with gear icon and space for descriptive text.
PRO
Vertical list of six items with numbered icons and title-text pairs aligned in two columns.
PRO
Classic table structure with vertical headers and minimal text (represented by ellipses) in cells. Two-row format, each with six column headers.
PRO
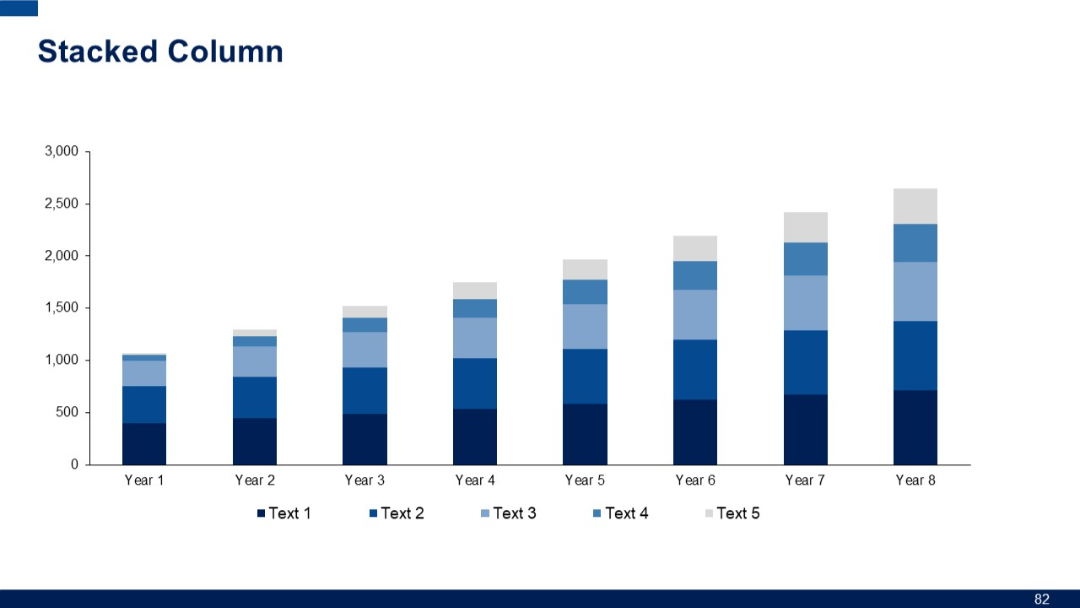
Full-width stacked column chart displaying eight years of data with five series. Uniform bar spacing and color variations for each series.
PRO
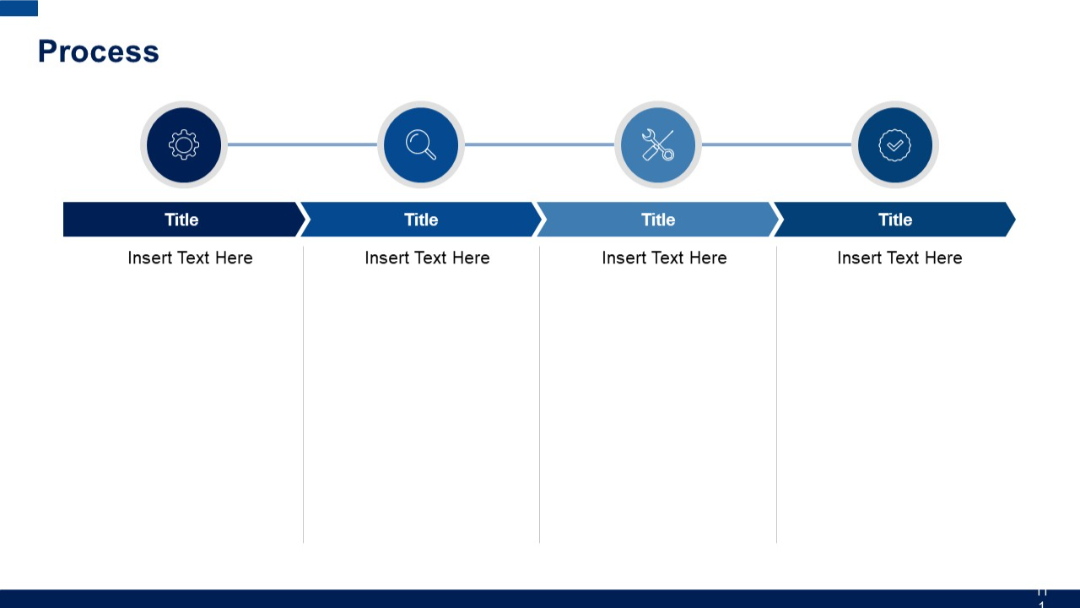
Horizontal step-based layout with four circular icons connected by a line at the top. Below each icon is a title box and placeholder text box.
PRO
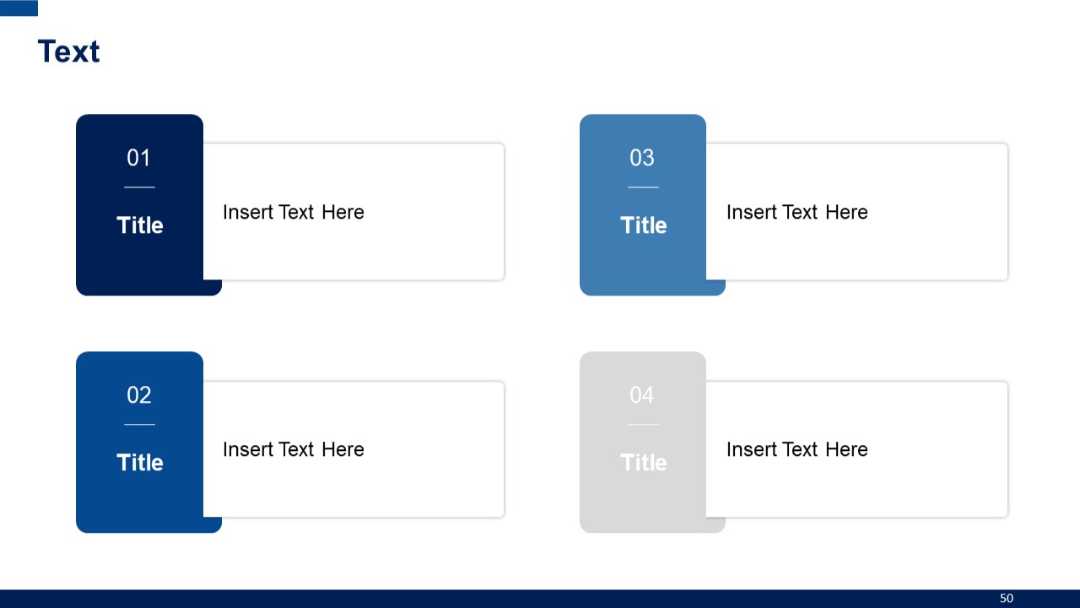
Four box elements with sidebar numbers and titles in a color-coded layout, arranged in 2x2 grid.
PRO
Light-themed version of a slide with typical structure and minor style adjustments for visual contrast.

PRO
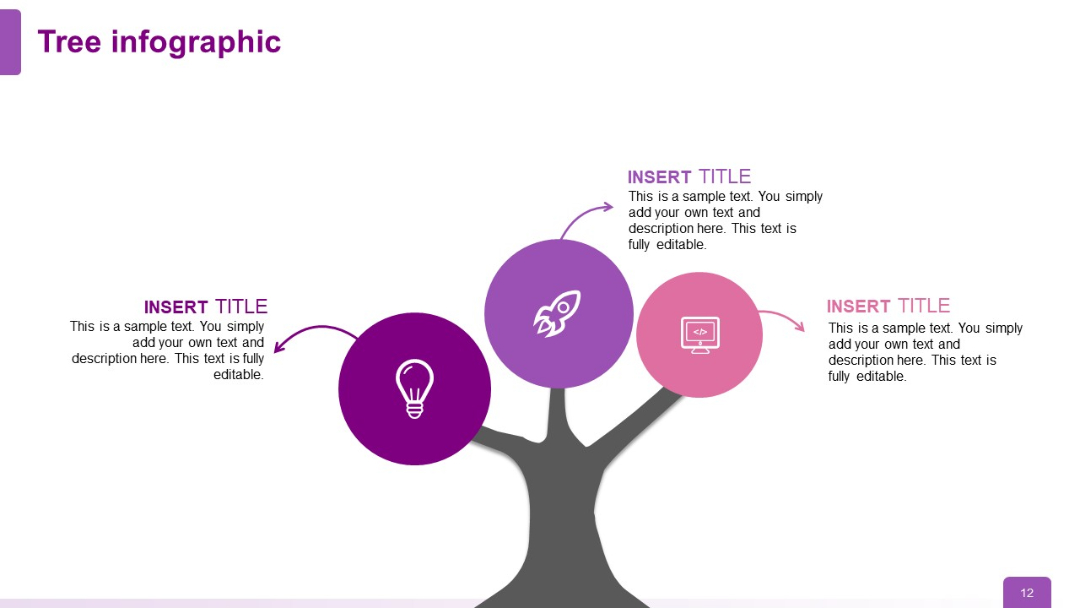
Tree diagram with three circular nodes (icons: lightbulb, rocket, computer); icons branch out from the tree in increasing complexity, maintaining symmetry.
PRO
Split layout with a vertical "Contents" label on the left and structured agenda items on the right.

PRO
Three-column layout with detailed paragraphs under three headings: business environment, customer expectations, and operational efficiency. Narrow columns with evenly spaced blocks of text.

PRO
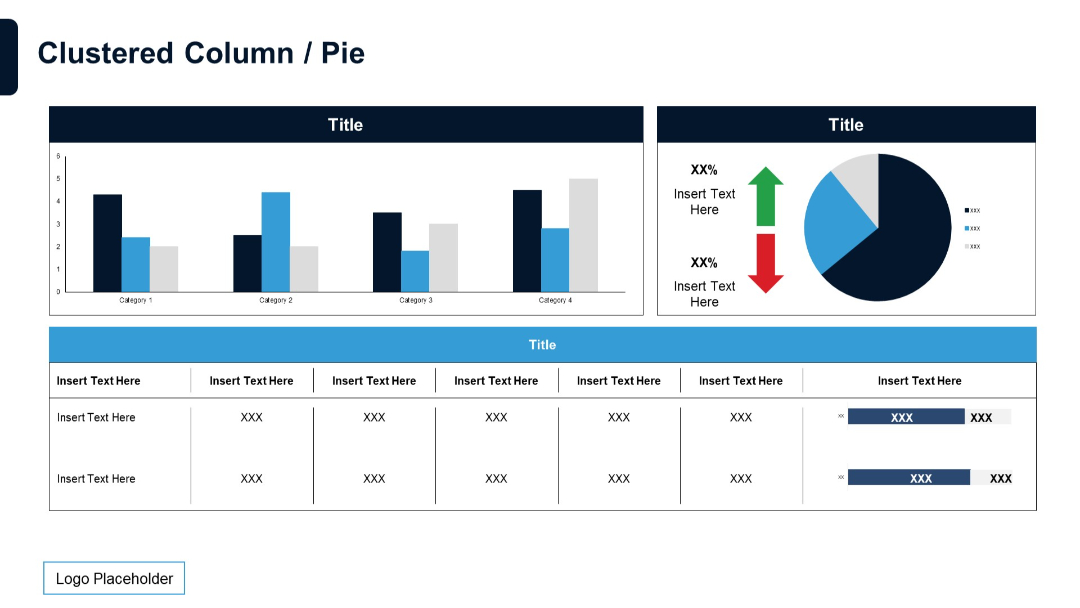
Combination of clustered column chart and pie chart in the upper section. Lower part shows a data table with bar charts embedded.
PRO
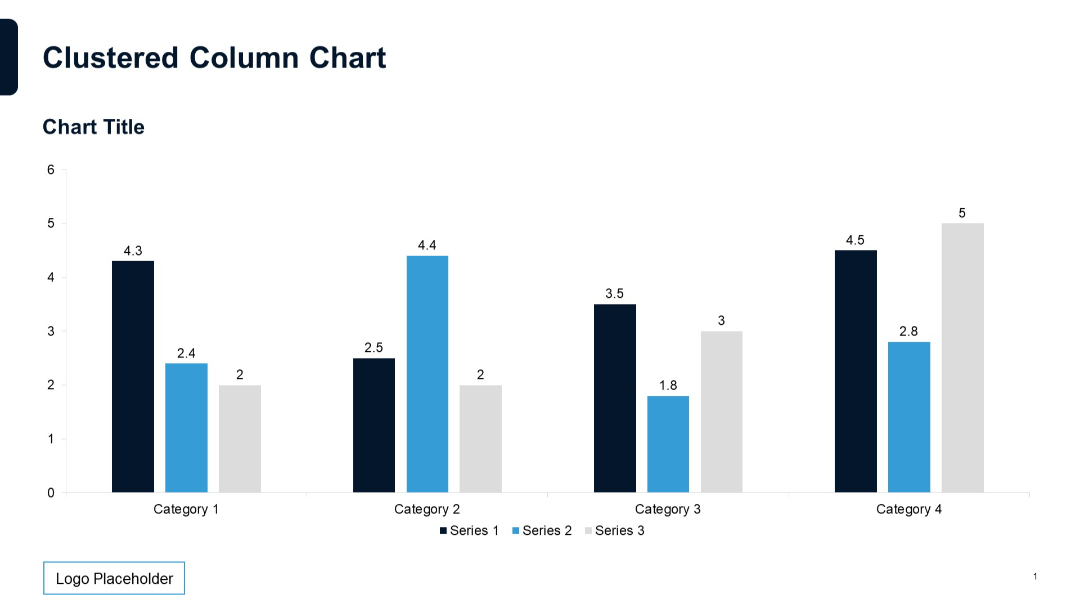
Vertical clustered column chart with labeled data points; three series across four categories; neutral grid and clear formatting.
PRO
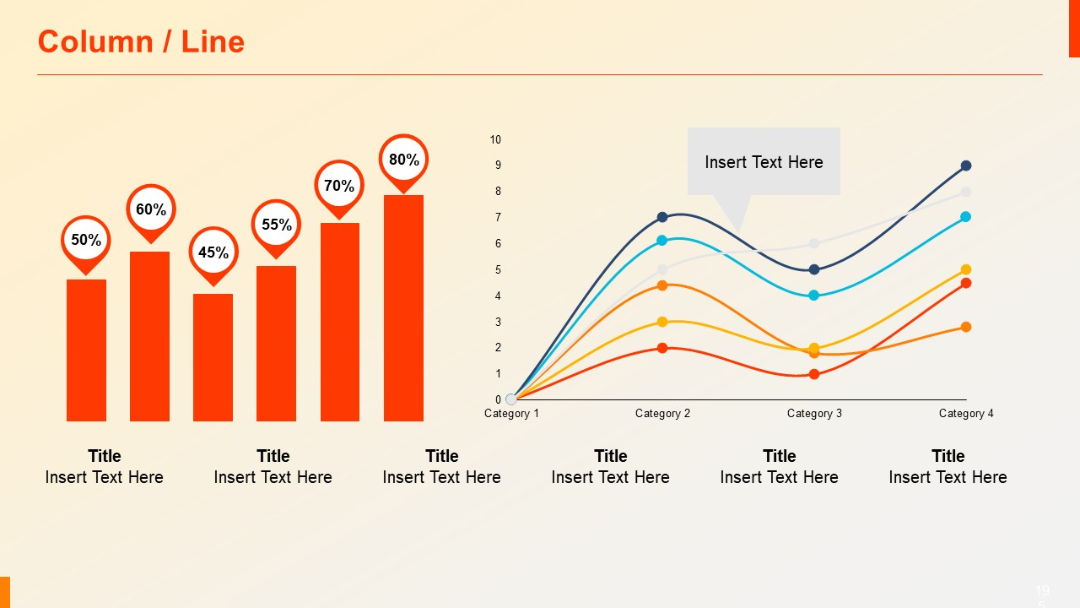
Left section has a column chart with percentage markers; right has a line chart across four categories.
PRO
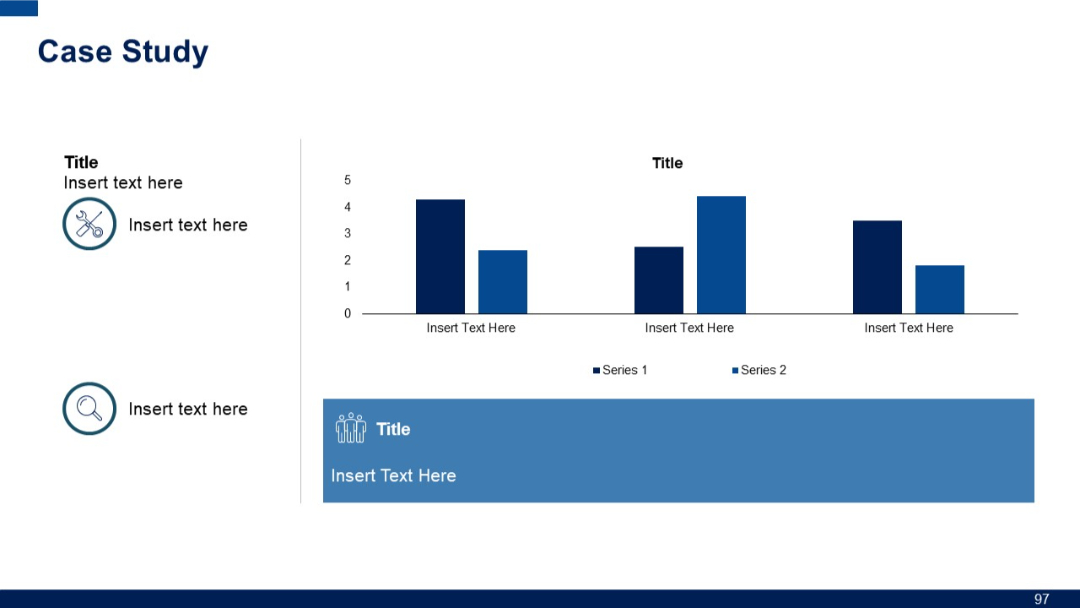
Left-aligned icons with titles and text, paired with a simple bar chart and a wide blue banner at bottom containing an icon and text placeholder.
PRO
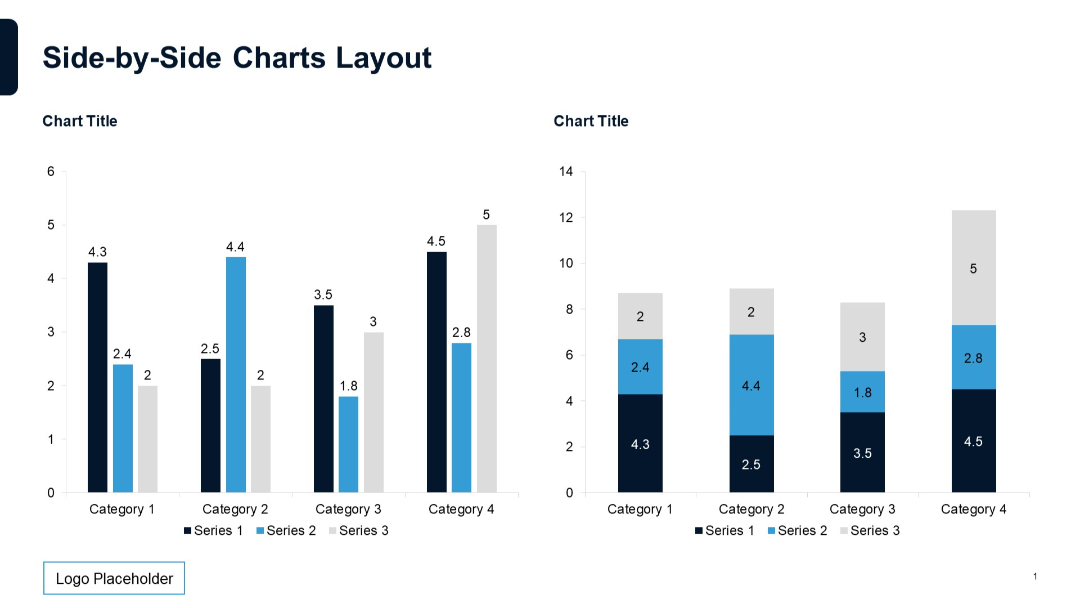
Two column charts: one vertical grouped bar chart and one stacked bar chart. Matching color schemes and categories.
PRO
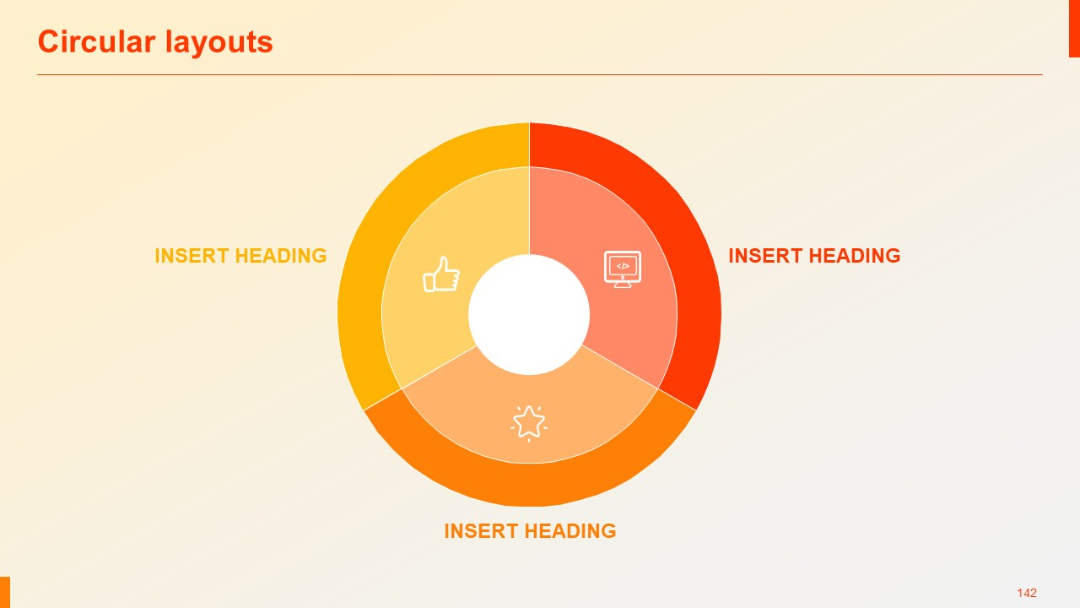
Three-segment donut chart design with central icons and gradient color fills in yellow-orange-red.
PRO
Vertical gear-linked checklist with checkmark icons and horizontal lines connecting them.

PRO
Vertically aligned colored diamonds on the left connected to horizontal text blocks. Each row has a distinct hue.
PRO
Two-column layout with bold headers and color-coded background blocks
PRO
Five circular icons with headings and descriptive text underneath; arranged in a semi-elliptical formation with ample spacing.