PRO
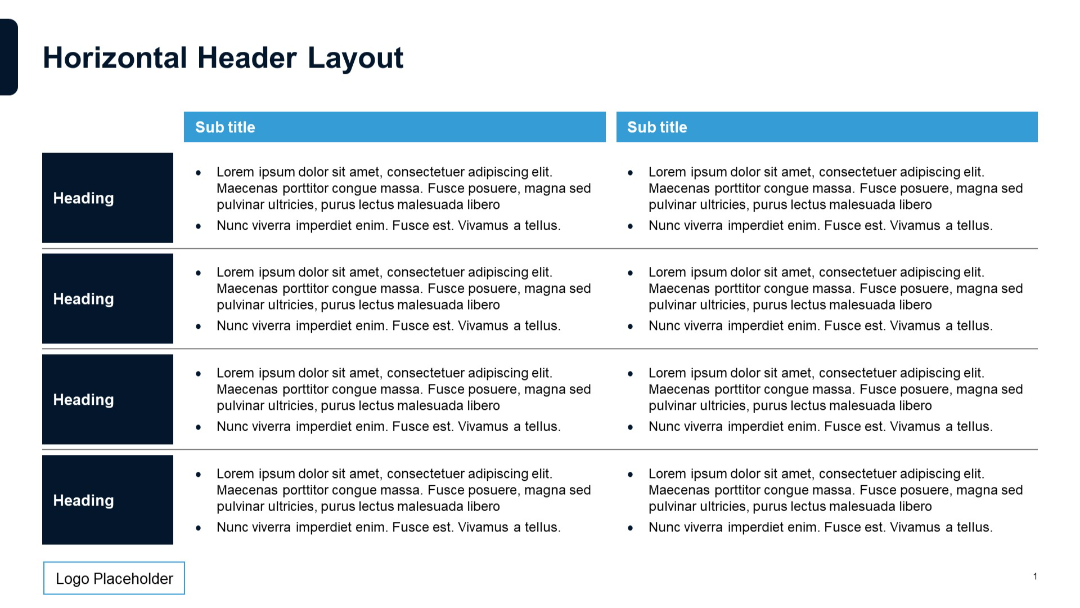
Similar to previous slide but with clearer line separations between rows. Left column with headings, two right columns under subtitle headers with bulleted text. Simple layout with grid style.
PRO
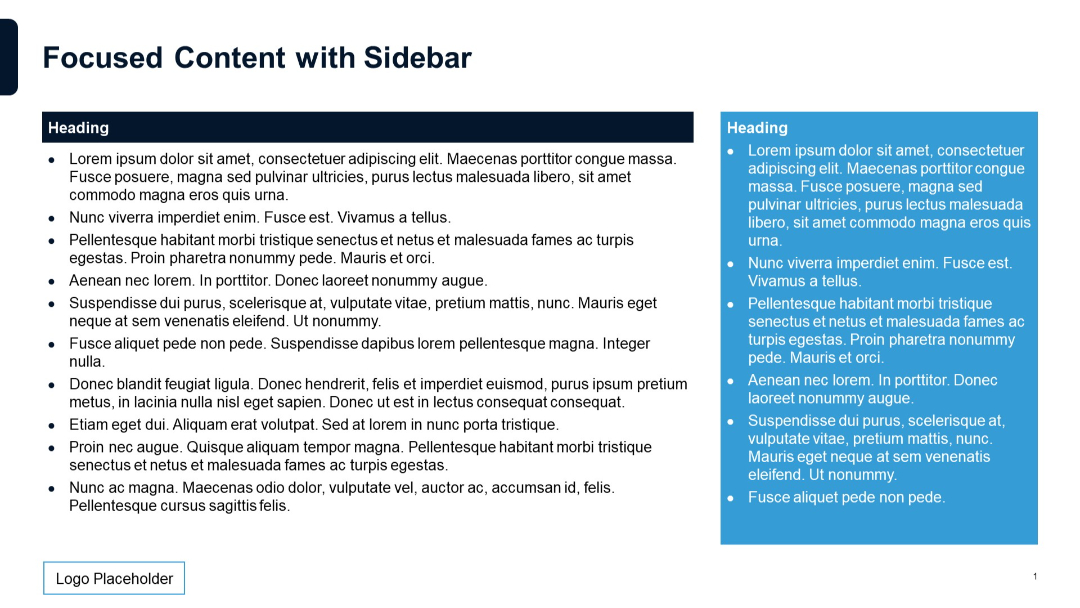
Same layout as previous but sidebar is more visually prominent with a bold blue background.
PRO
Horizontal layout with arrow icons leading into five rows of text. A solid header bar at the top displays the slide title with contrasting end block.
PRO
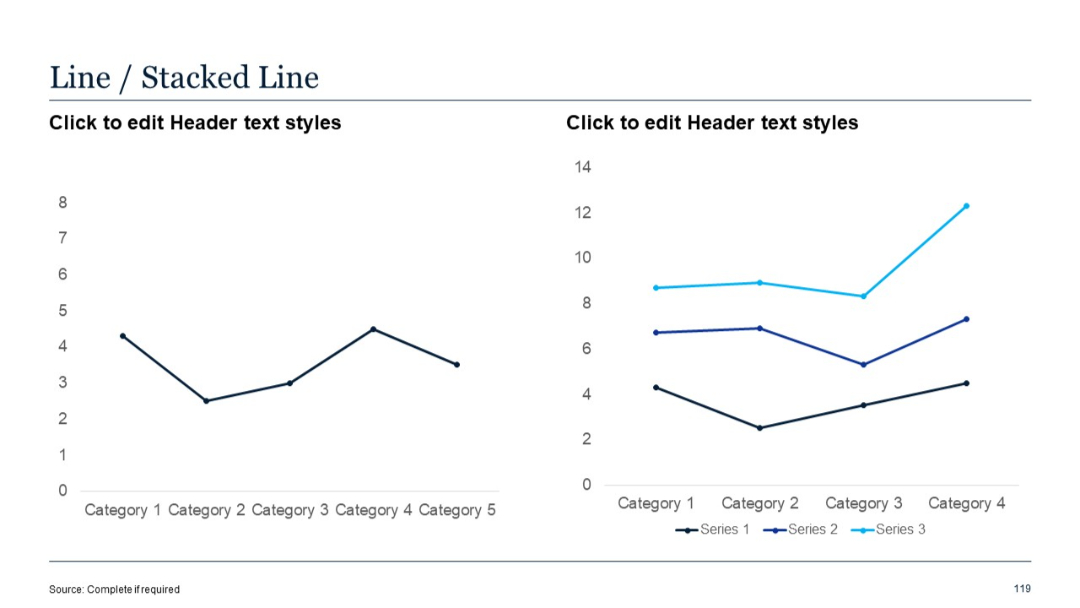
Two-panel layout with a regular line chart and a stacked line chart; both share similar category axes.
PRO
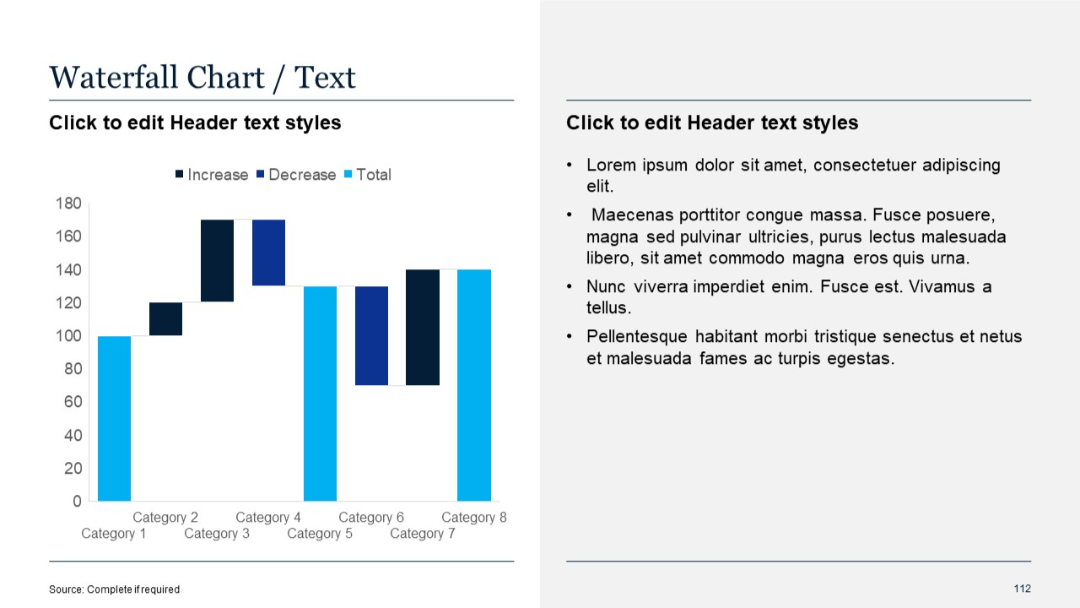
Left side waterfall chart showing increases, decreases, and totals; right side with placeholder text in bullet format.
PRO
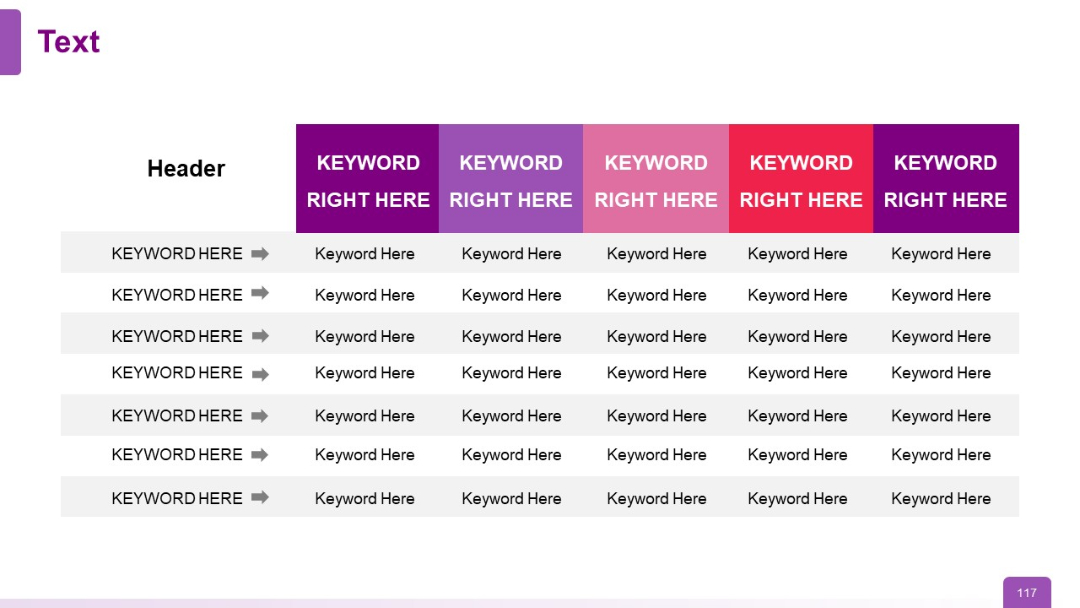
Wide table with color-coded columns and keyword rows with arrow indicators
PRO
Dark background version of the same profile; portrait in circular frame with text on right.

PRO
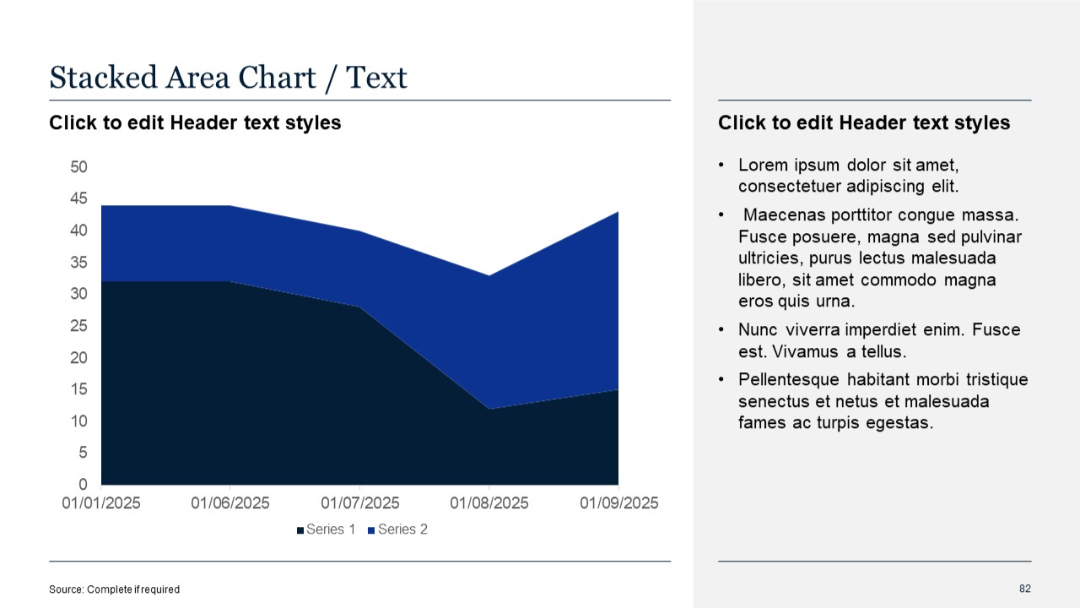
Similar layout as Slide 81, with a more pronounced Y-axis scale and denser data visualization
PRO
Four evenly spaced columns with bullet lists; simple structure, clean background.
PRO
Two-column table layout with alternating rows for "Title" and "Slide No"; mirrored structure repeated side by side across the slide.
PRO
Horizontal table with six columns and two rows; bold headers in purple; placeholders for company, product, target customer, benefits, price, and value.
PRO
Two-column checklist with red title headers, checkmark icons, and placeholder text in bullet format.
PRO
A ring of eight small circular nodes with red star icons, surrounding a central “HEADING” label. Text blocks are on both left and right sides.
PRO
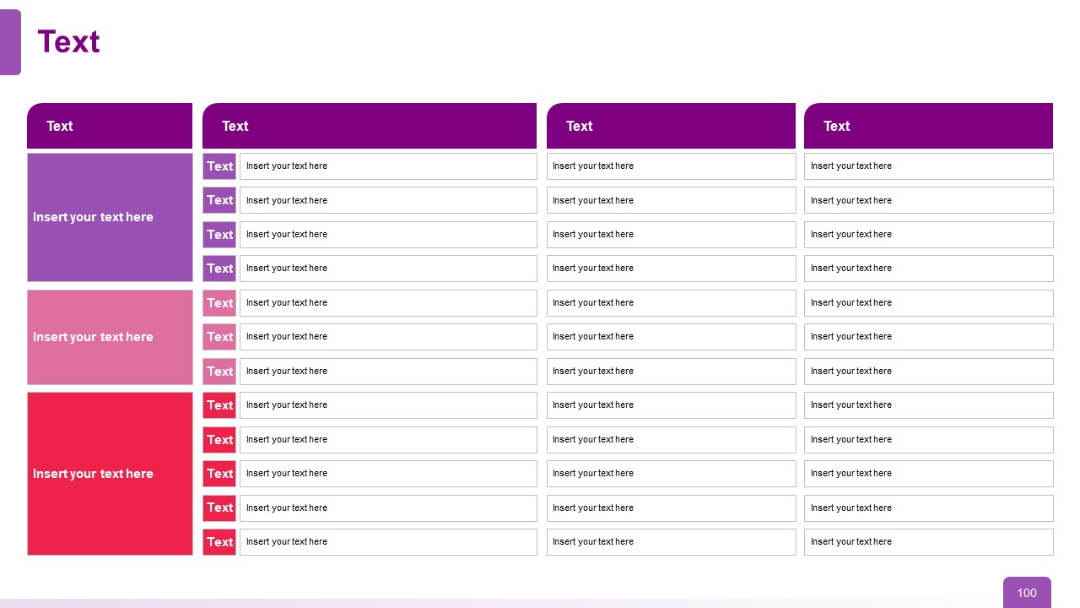
Three content panels with headers titled "Text", followed by titled sections. Vertical separators enhance clarity and segmentation.
PRO
Two-row table with four columns of placeholder text and bold blue title cells on the left. Minimalist grid structure.
PRO
Semi-circular numbered visual on the left with four aligned title-text rows on the right.
PRO
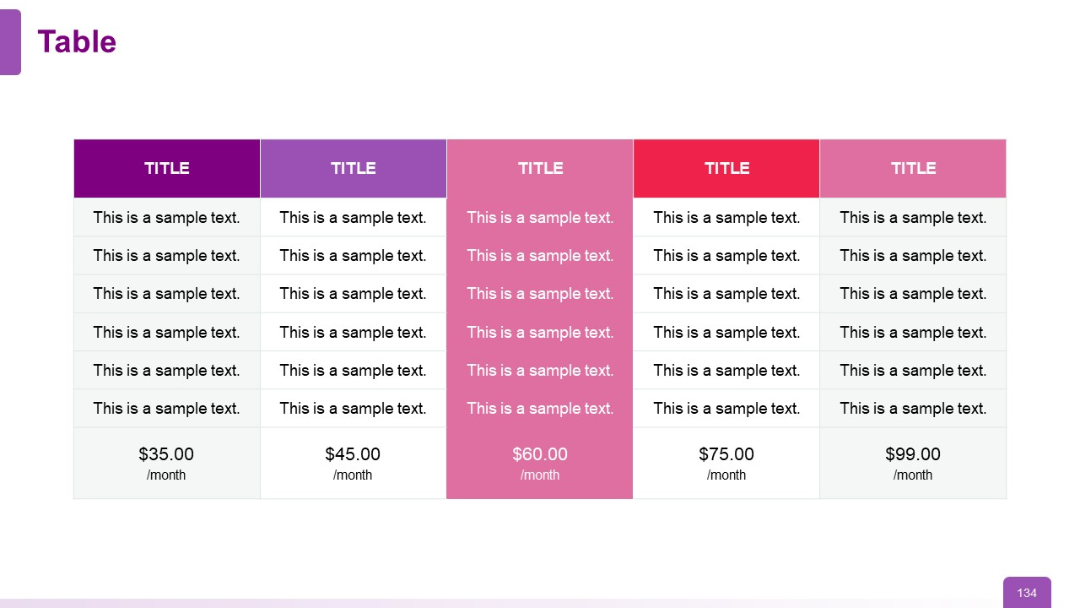
Multi-column pricing table with each column in a different color (purple, pink, red, etc.). Pricing prominently displayed at the bottom of each column.
PRO
Right-aligned 3-step infographic with circular progress-style icons above each text block (30, 60, 90 days), left-side image element.

PRO
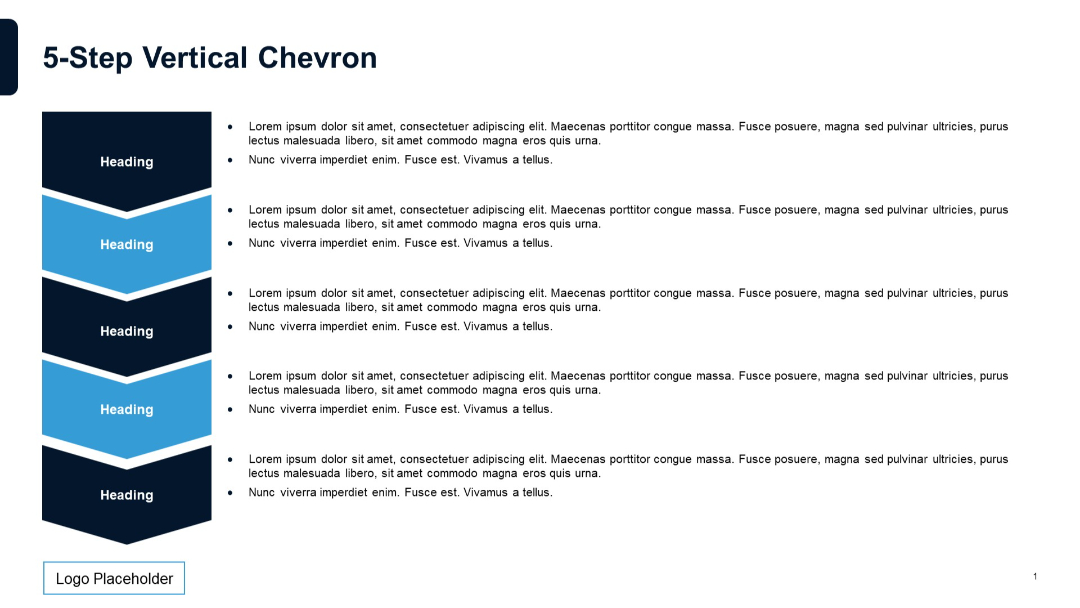
Five vertically arranged chevrons on the left with accompanying bulleted descriptions to the right of each. Design is simple and structured, with alternating chevron colors.
PRO
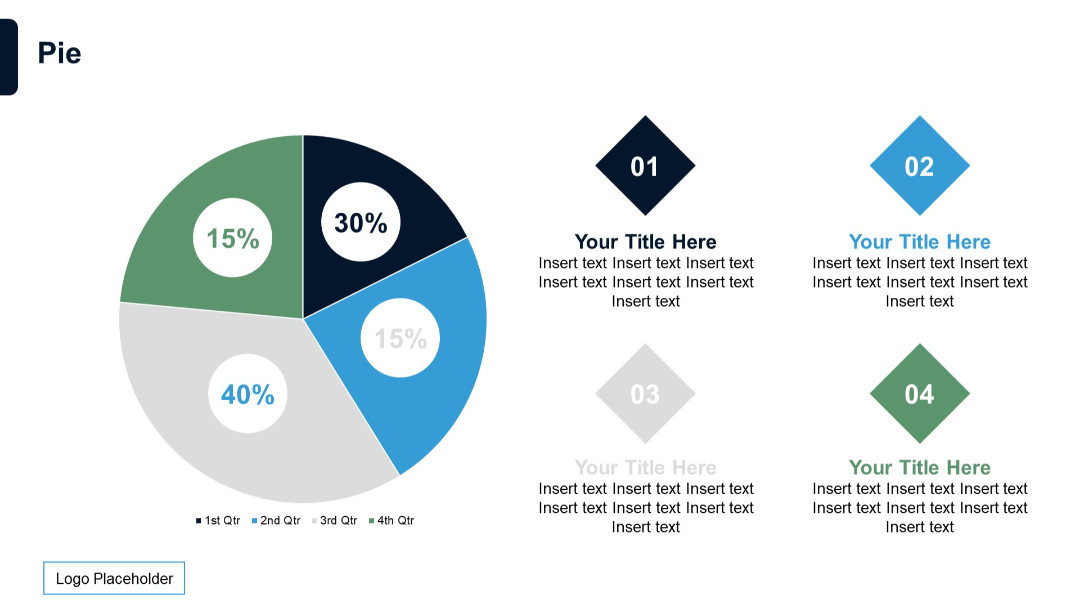
A circular pie chart divided into four segments (15%, 30%, 40%, 15%) with color-coded quarters. On the right, four numbered diamond shapes with text placeholders.
PRO
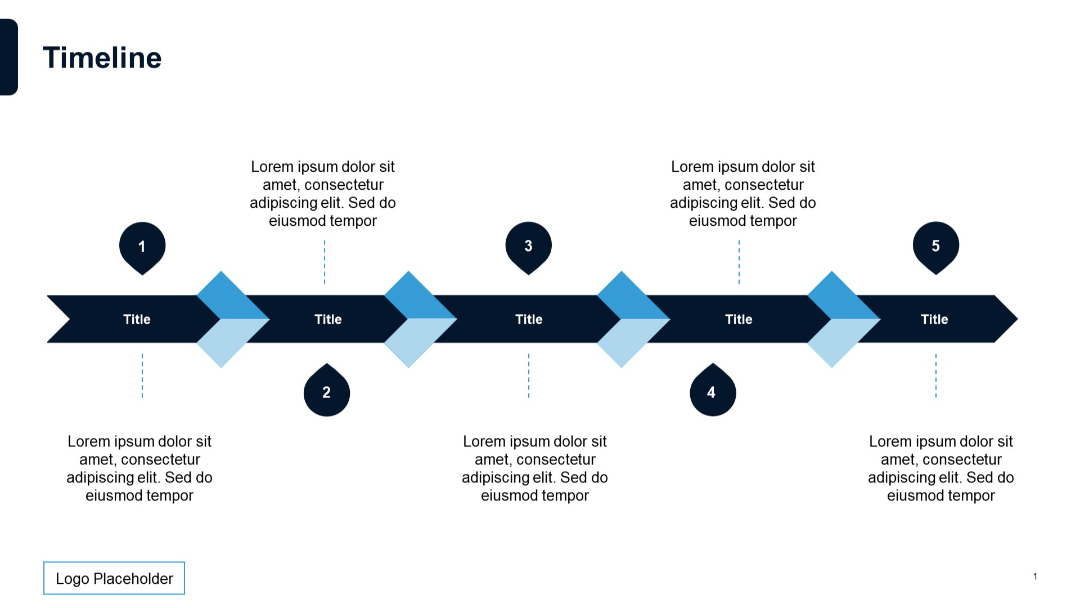
Horizontal arrow timeline with five marked steps, alternating text positions above and below.
PRO
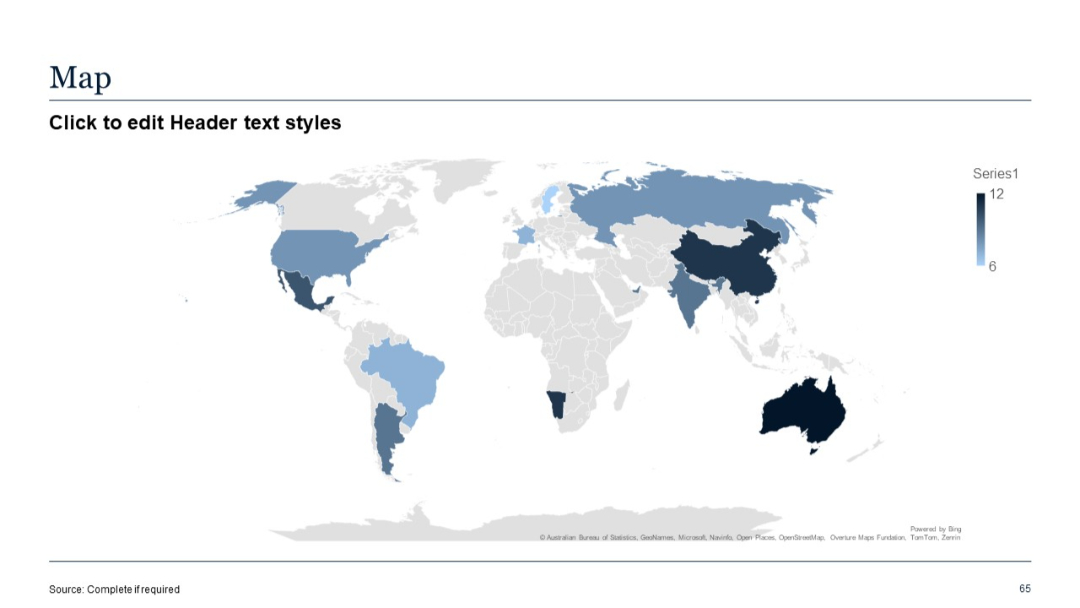
Choropleth world map shaded by data intensity; color gradient legend shown on the right.
PRO
Four-column data matrix with rows under each header; consistent color schemes and organized row structures with placeholders.
PRO
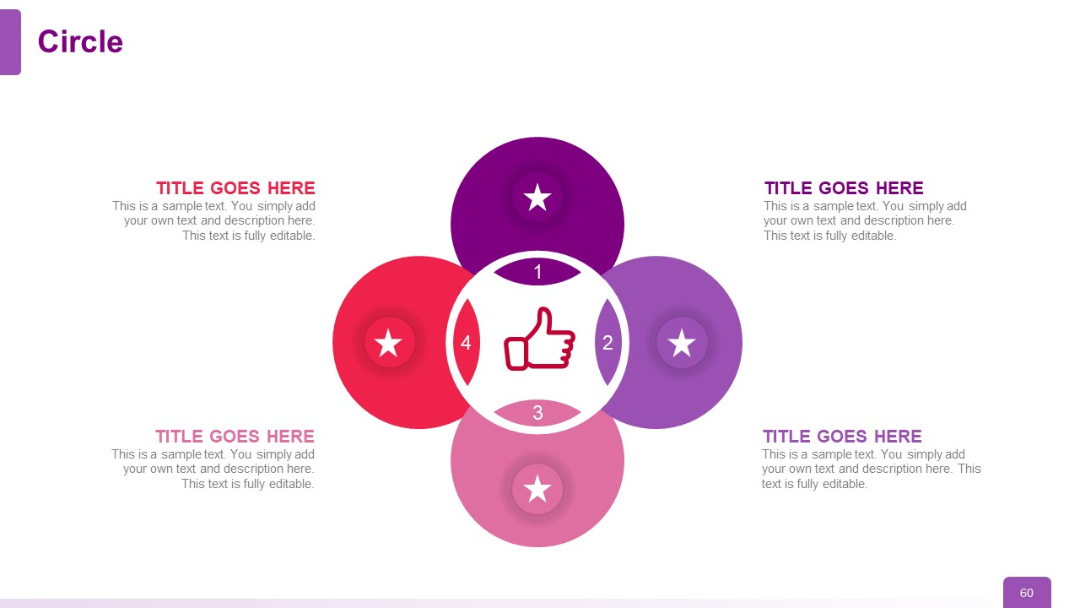
Central circle with a thumbs-up icon surrounded by four outer circles (01–04). Each has a star icon and editable title/description.
PRO
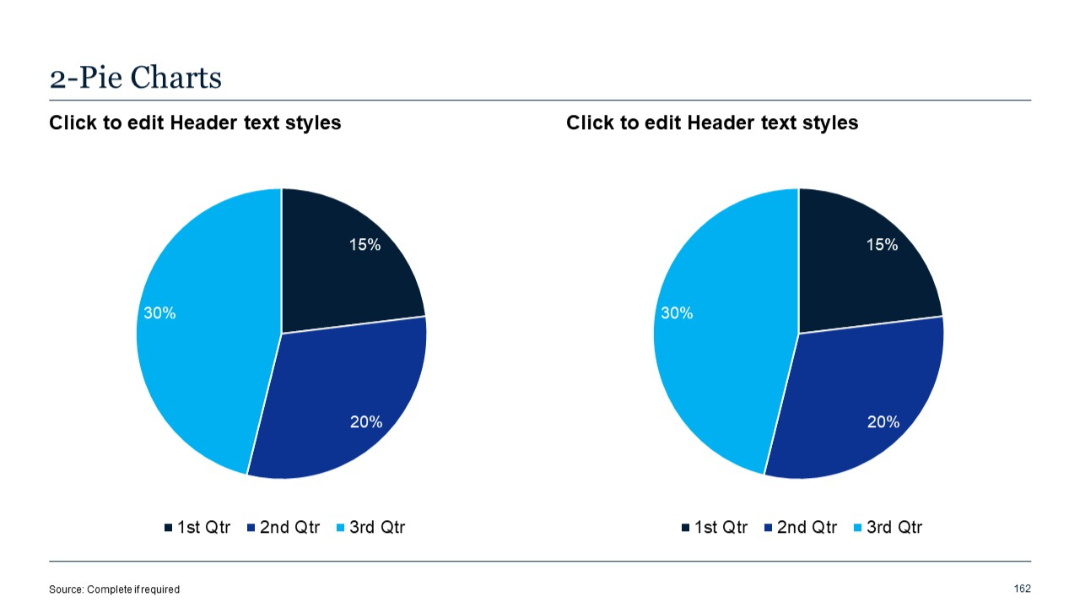
Two simple pie charts side by side, each divided into 3 segments with percentage labels and color legend.
PRO
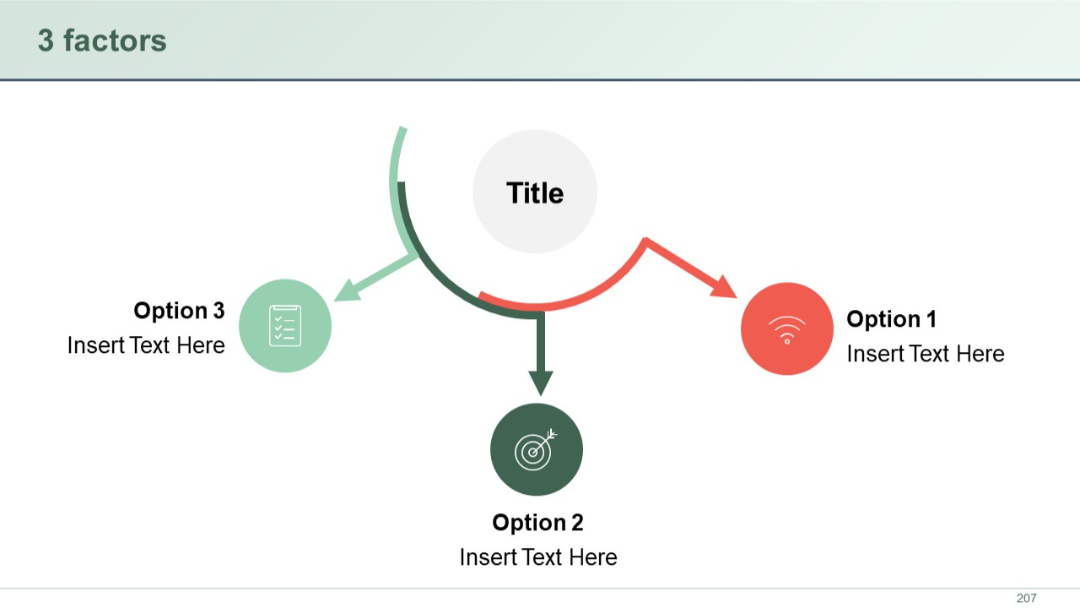
Three circular icons in a triangular arrangement with arrows pointing toward a central circle. Each factor is labeled as an option.
PRO
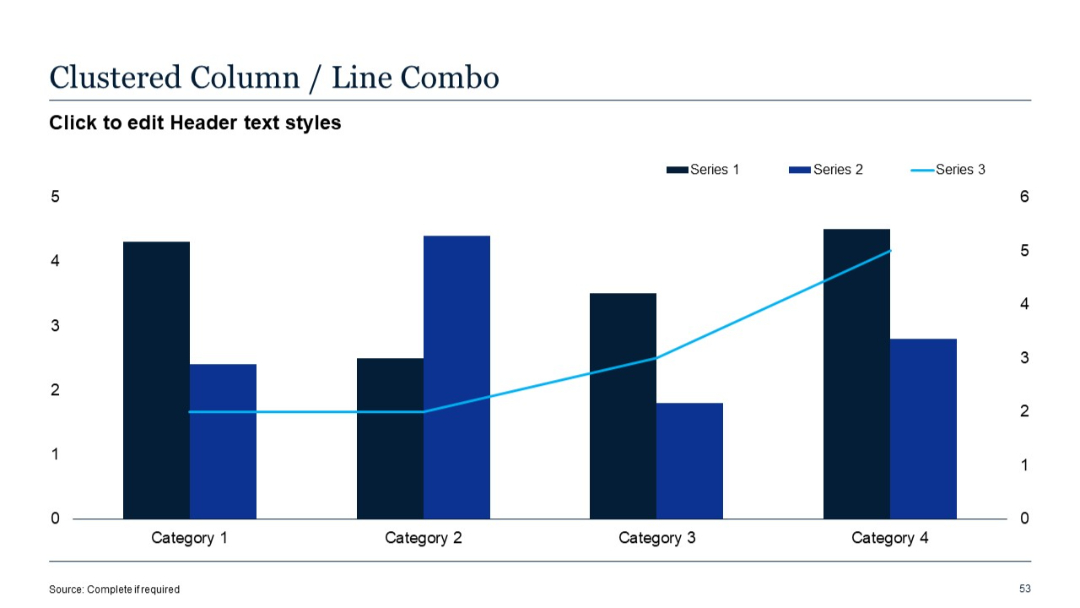
Combination chart with vertical clustered columns for Series 1 & 2 and a line graph for Series 3.
PRO
Mekko (marimekko) chart showing categories with varying width and height; numerical labels inside bars

PRO
Minimalist transition slide with large “03” in orange and text “Quantitative Slides” underneath, on a beige background with a horizontal line.

PRO
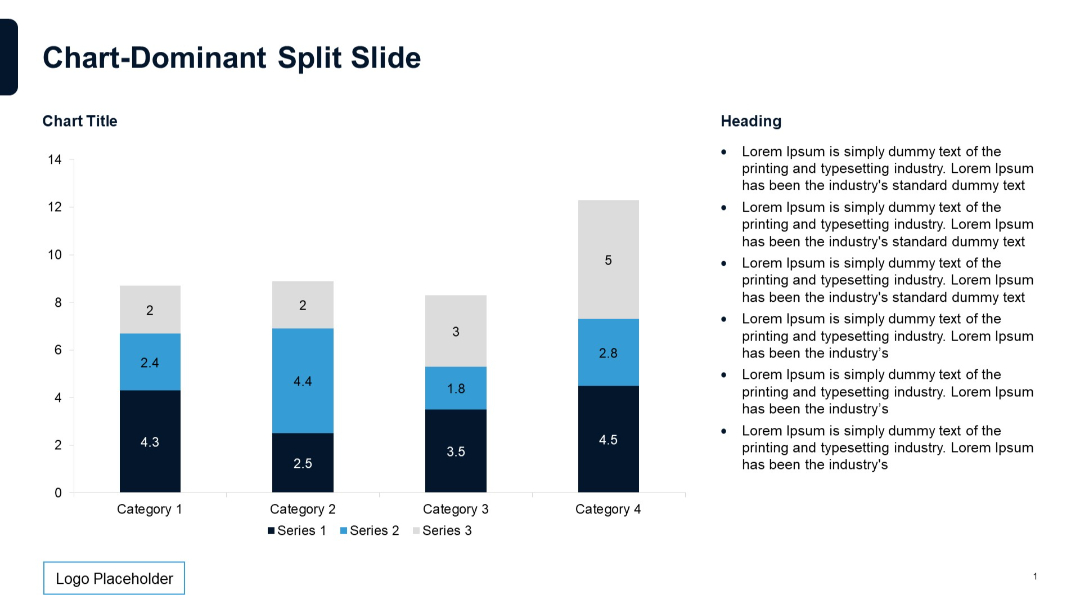
Stacked vertical bar chart; values stacked by series; list of bullets on the right side.