PRO
Two-column layout on a white background with four numbered sections and brief descriptions, logo at bottom left.
PRO
Left-aligned background image with circular progress-style graphics for 30, 60, and 90-day milestones.

PRO
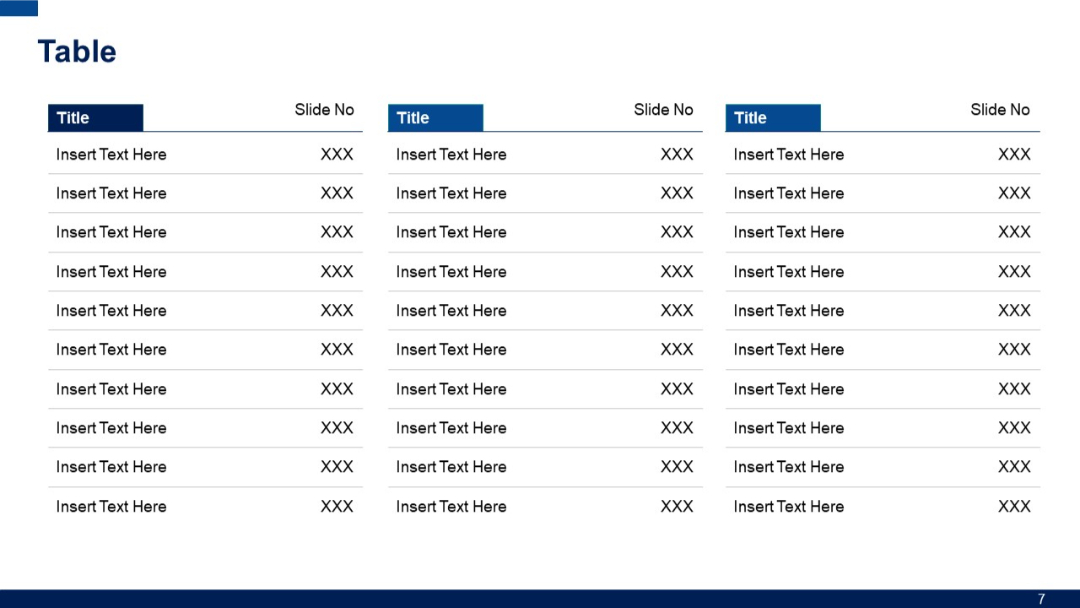
Three columns with headers "Title" and "Slide No" repeated across; suitable for large indexes or content reference lists.
PRO
Title slide with a modern diagonal design split between a white bottom half and a deep blue top half; includes a placeholder for the title.

PRO
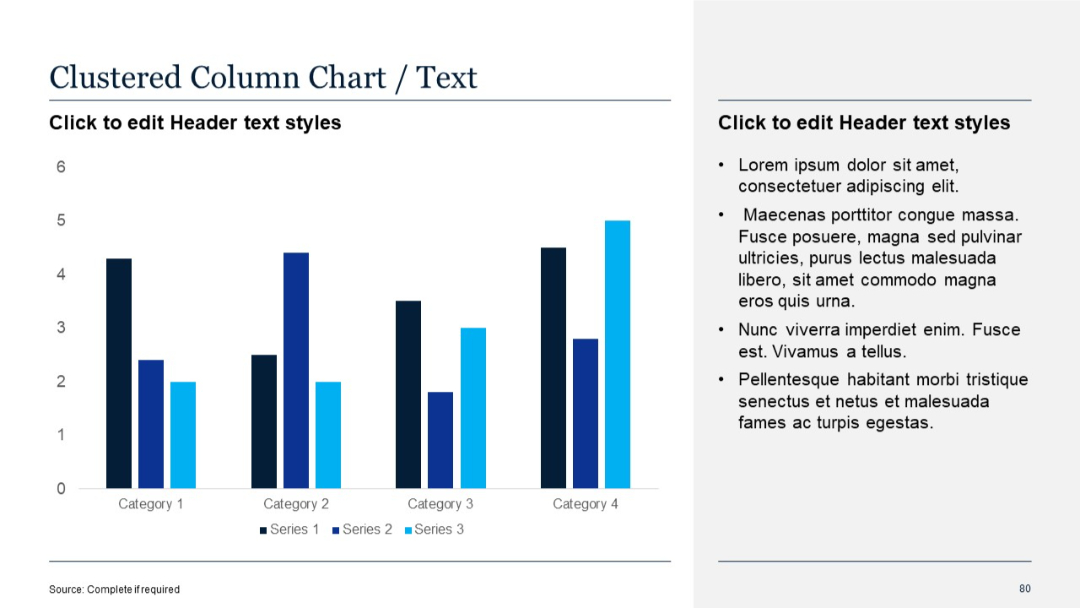
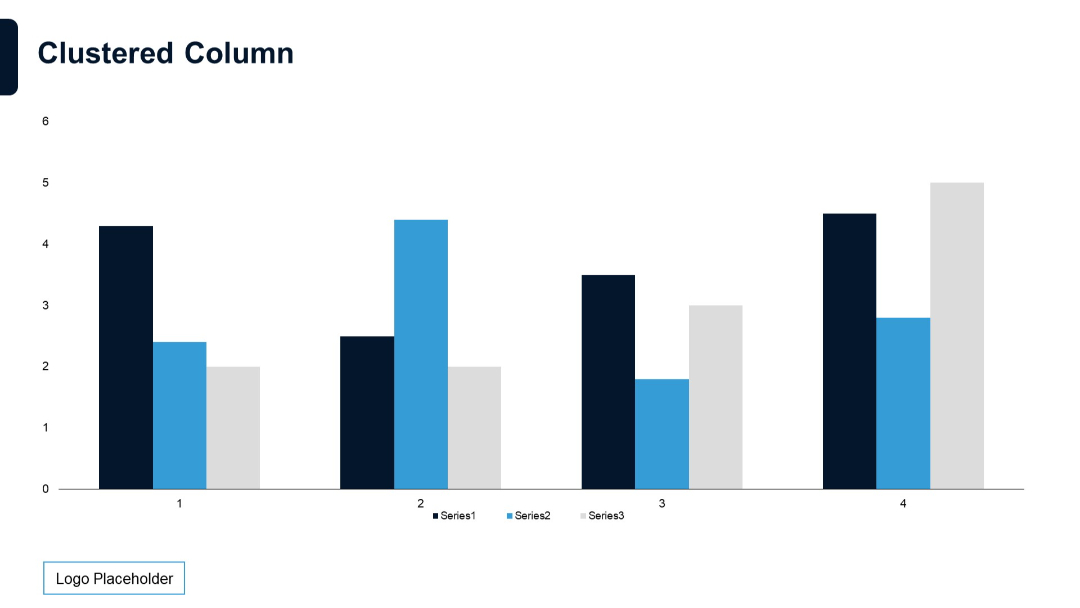
Clustered vertical column chart showing side-by-side comparison of three series per category. Color-coded per series.
PRO
Basic clustered column layout with three series. No annotations or text except axis numbers and legend.
PRO
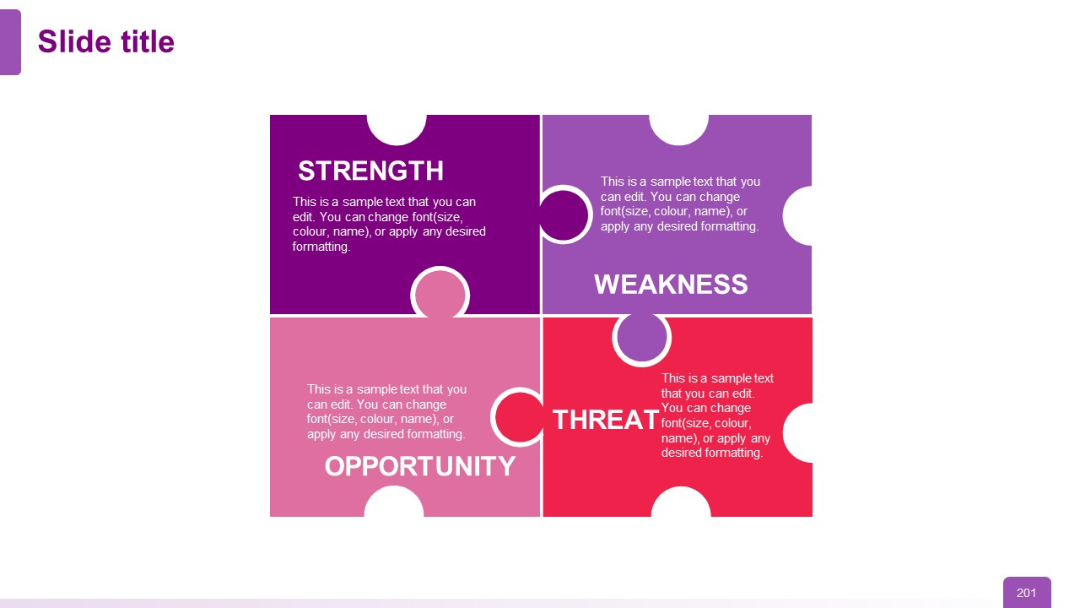
A 2x2 grid in puzzle piece format, each colored block represents SWOT elements: Strength (purple), Weakness (light purple), Opportunity (pink), Threat (red).
PRO
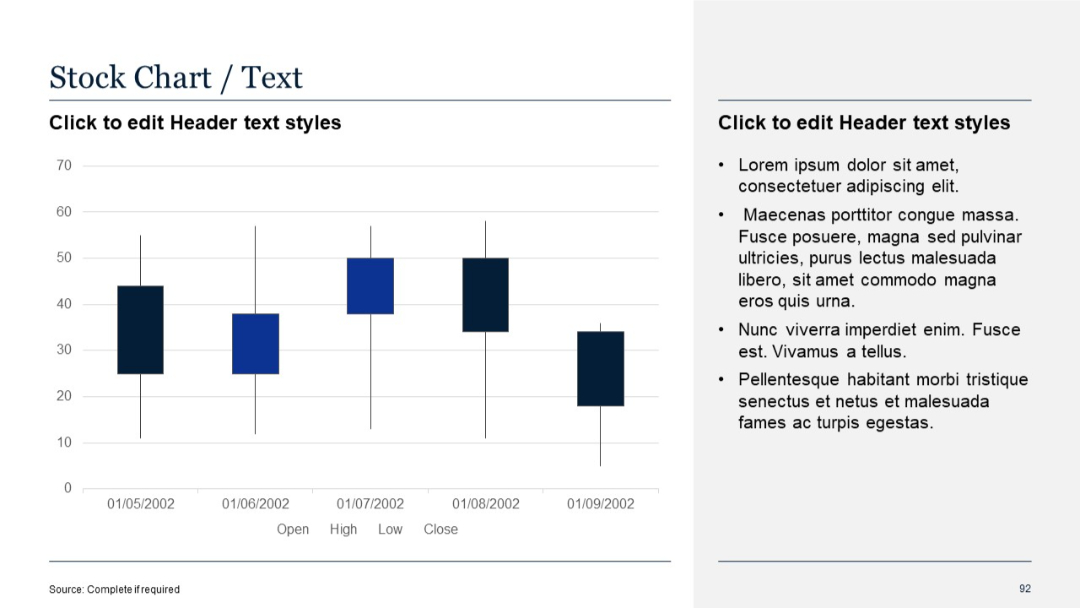
Candlestick-style stock chart on left; right side contains bulleted placeholder text.
PRO
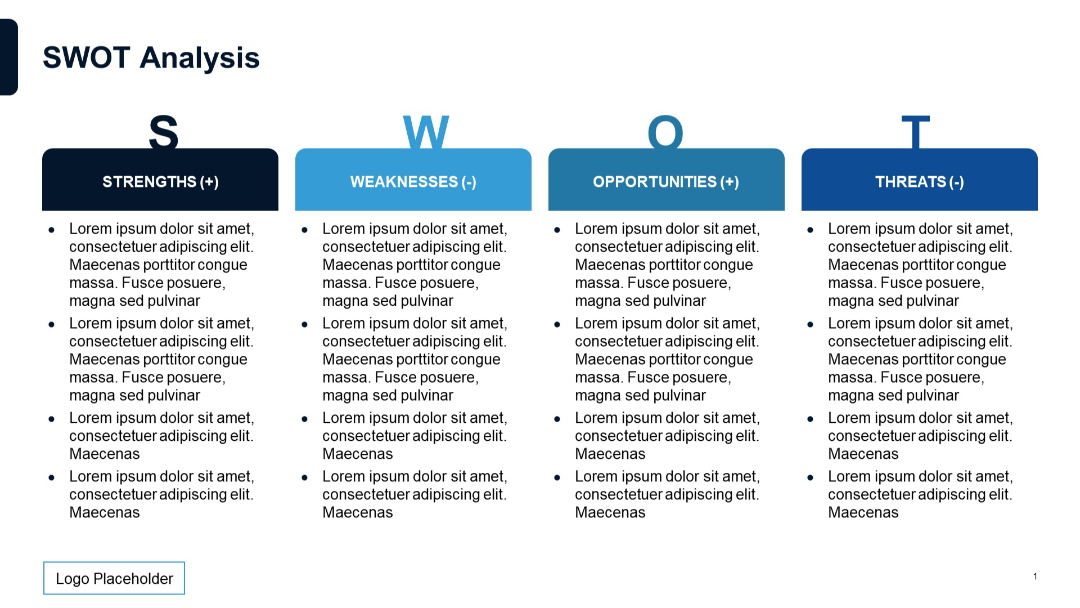
A horizontal four-column SWOT layout with bold headers and bulleted text under each section.
PRO
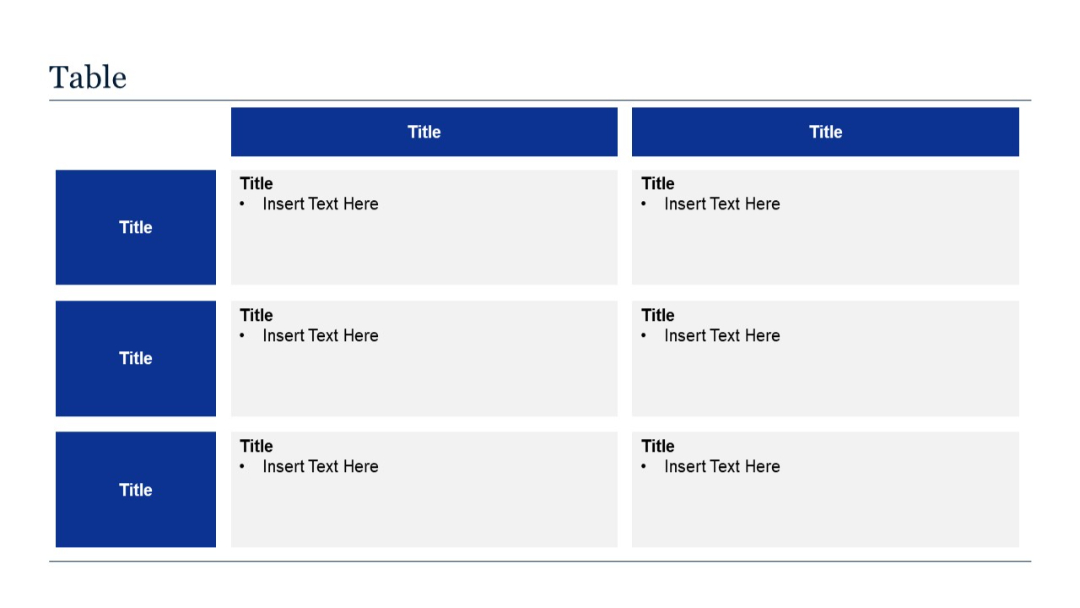
Grid-based layout with two major columns and multiple rows; each row uses left-aligned blue cells with corresponding content blocks to the right.
PRO
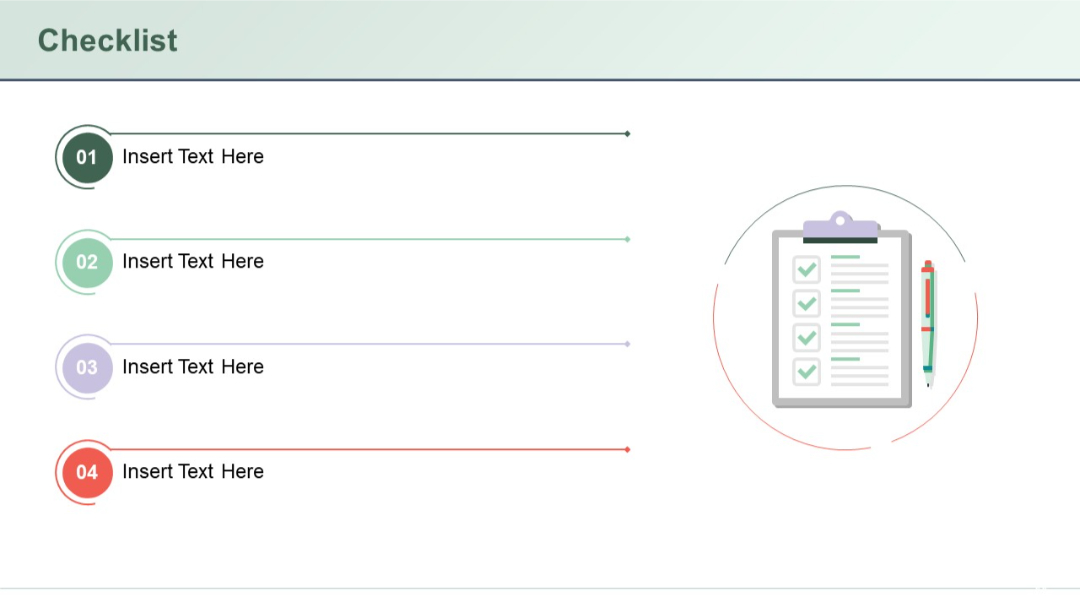
Similar to Slide 108, but adds a visual graphic of a clipboard and pen on the right side; each step has a colored icon with number and directional line.
PRO
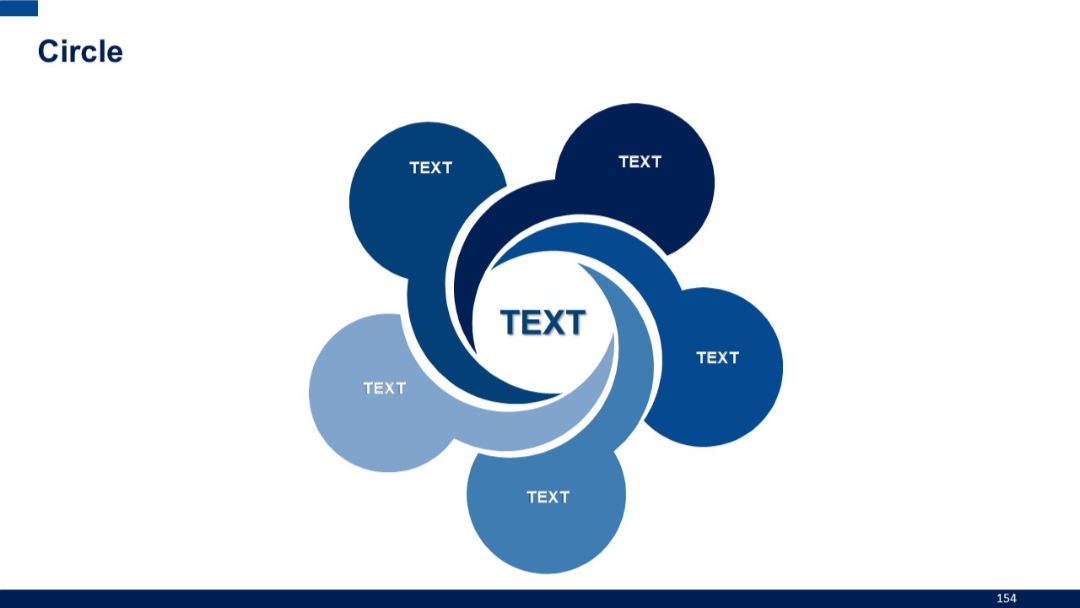
Five interconnected swirls with circular nodes, all revolving around a large central circle labeled “TEXT.” Abstract and flowing layout.
PRO
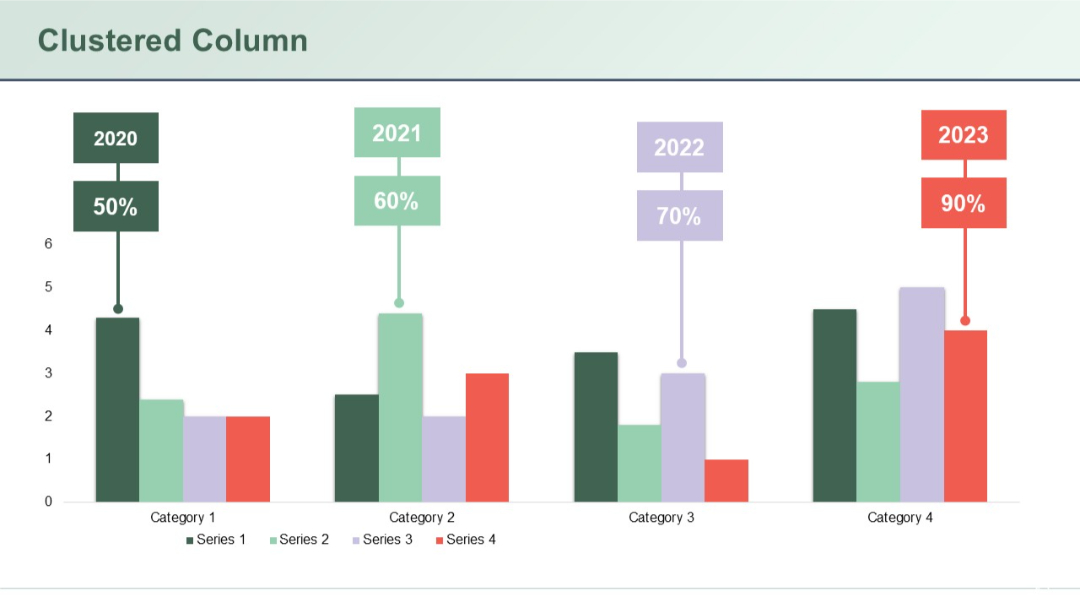
Grouped column chart comparing four categories across four series. Color-coded data points with percentages and year tags above each group.
PRO
A semi-circle with 6 evenly spaced segments containing icons and text placeholders. Gradient color scheme transitioning from purple to grey.

PRO
Process-style table with arrows indicating flow; three horizontal columns with input boxes and descriptive bullet text below each; two vertical boxes on the left.
PRO
Classic 2x2 SWOT layout with "S", "W", "O", and "T" blocks in color, each with a key element and description beside it.
PRO
Dark background with minimal text. Single line extending from "More Charts" text to a circular node, ending in arrow dot graphics.

PRO
Numbered list layout with colored blocks for numbers on the left and horizontal bars stretching across with text on a white background.

PRO
Two-row, two-column layout with left-aligned colored side tabs (numbered and titled) and adjacent text boxes. Stylized rectangular segments.
PRO
Four rectangular vertical boxes for SWOT, each with a header and body space for text entry.
PRO
Column chart comparing multiple data segments across a timeline. Each bar has stacked segments representing different values.
PRO
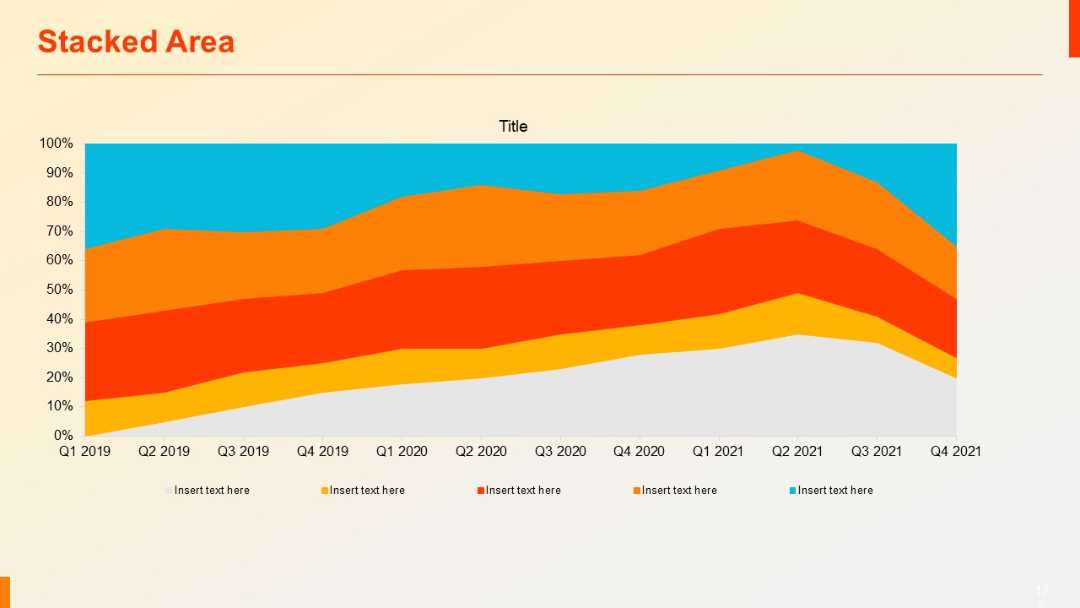
Stacked area chart with six color layers representing different series over time (Q1 2019 to Q4 2021). Clean and data-focused design.
PRO
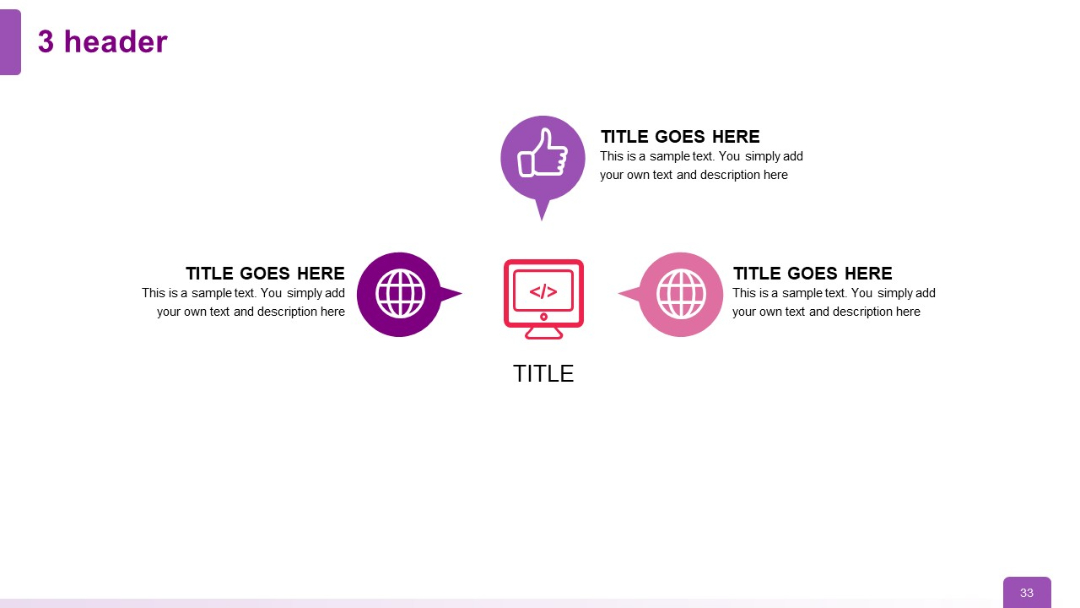
Linear and slightly vertical layout with one top icon and two side-by-side bottom headers; central icon emphasizes connectivity or code.
PRO
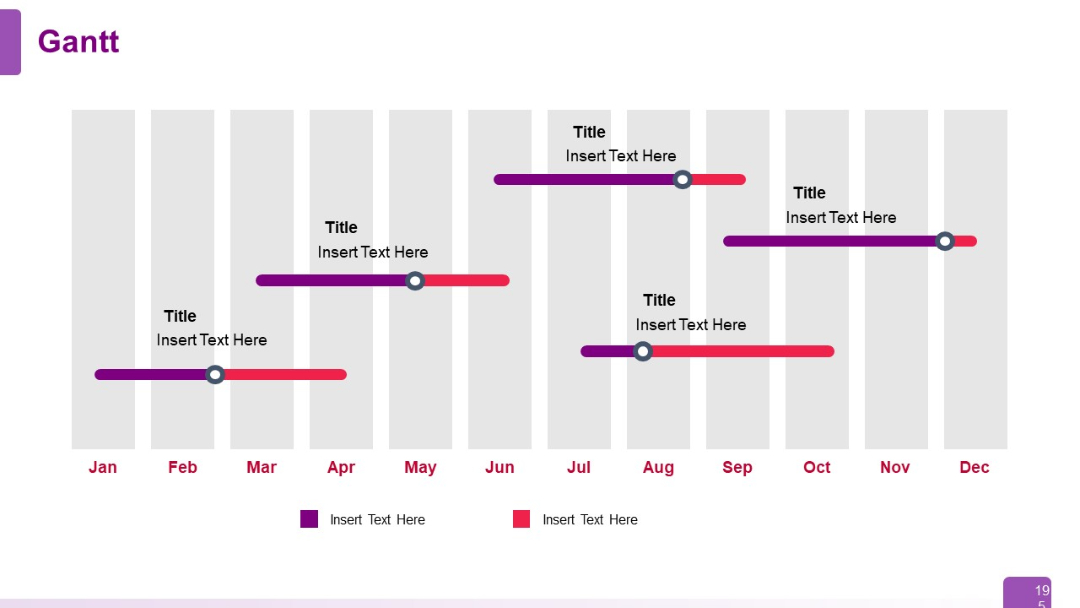
Calendar-based Gantt chart with vertical month divisions and horizontal task bars; markers for milestones.
PRO
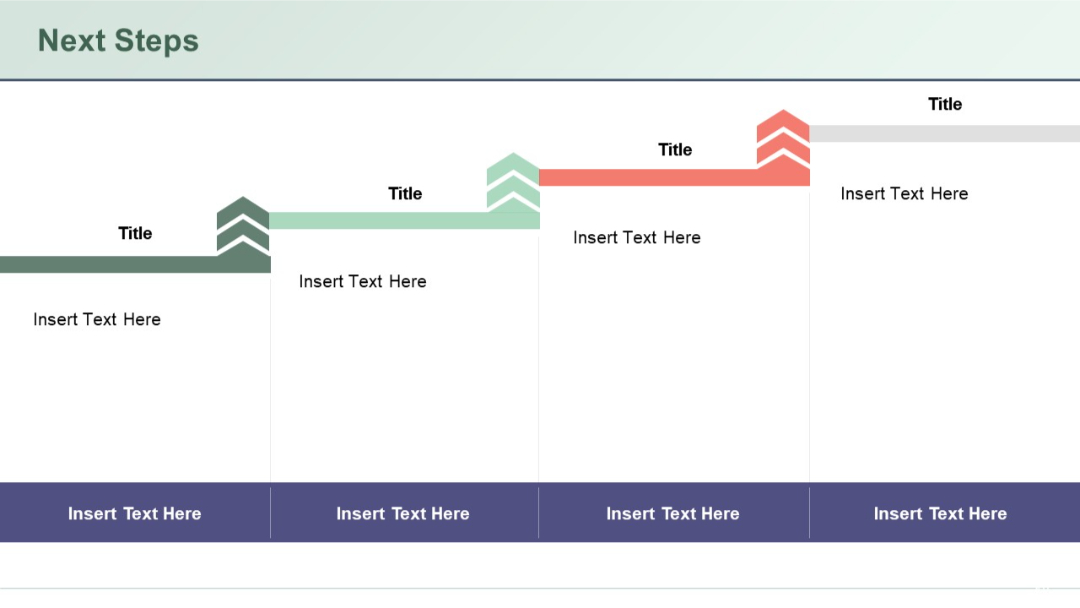
Flat layout with four vertical chevrons indicating direction across equal sections, each with a title and content area.
PRO
Top row of icons linked by a line, with matching arrow-tipped horizontal text blocks below. Four-stage process visualization.

PRO
Four-quadrant layout with title headers and images representing different business areas. Icons and short descriptions accompany each section.

PRO
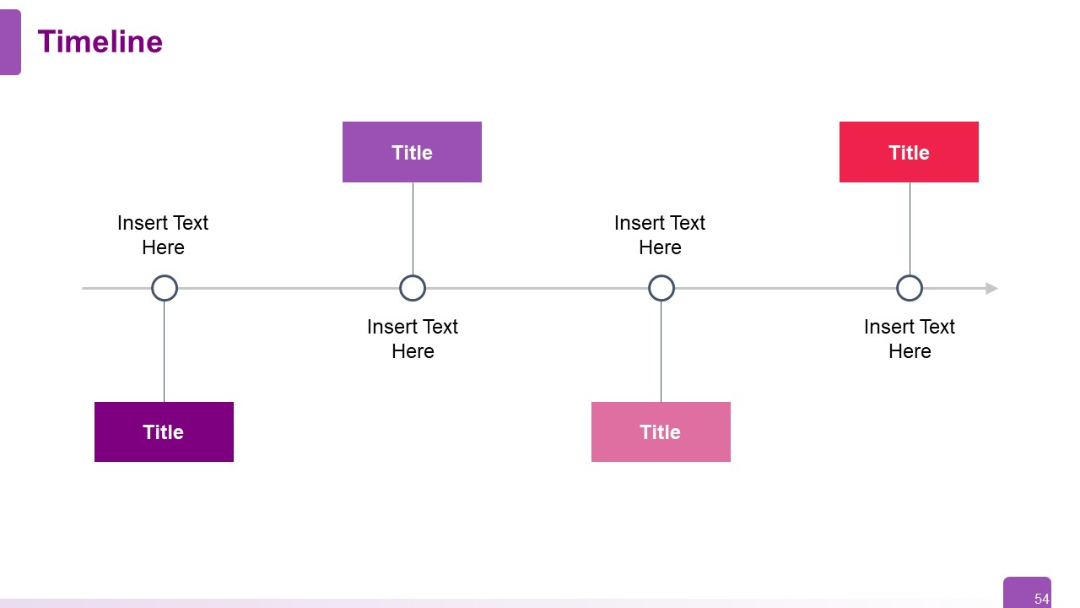
Horizontal timeline with circular markers and alternating vertical connectors pointing to rectangular text boxes labeled "Title".
PRO
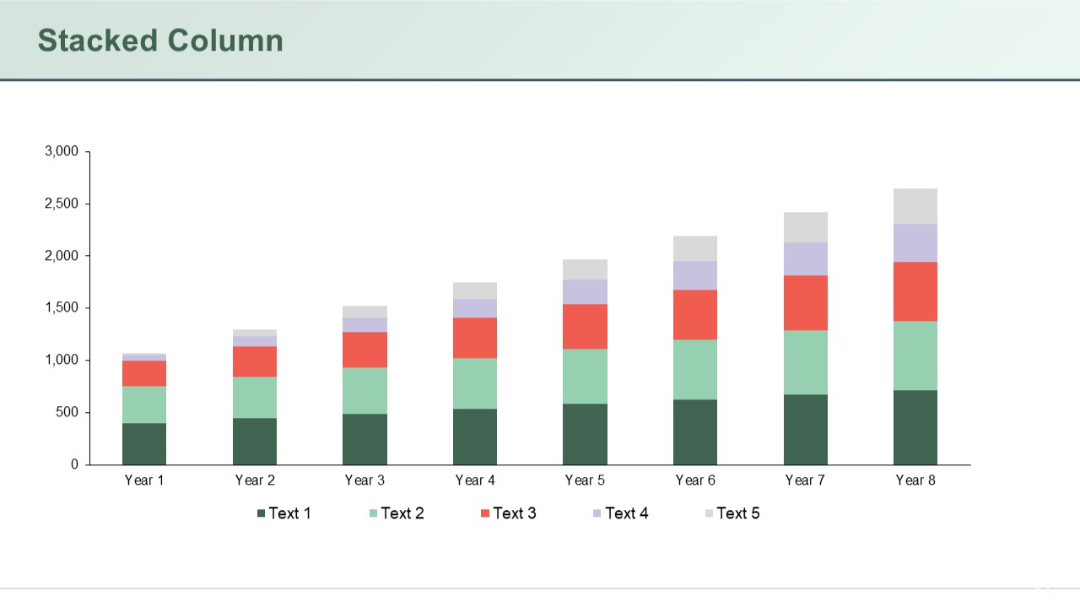
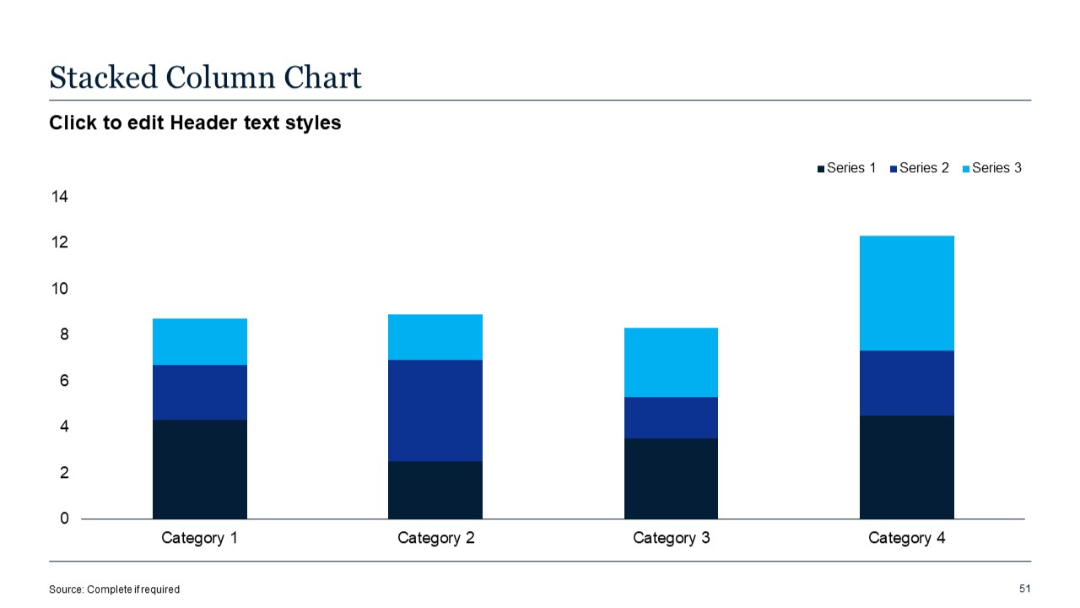
Standard vertical stacked column chart; 3 data series per category; simple grid layout on white background.
PRO
Left-aligned timeline with vertical blocks of time and arrow icons pointing to content boxes.