PRO
Stacked area chart spanning multiple quarters from Q1 2019 to Q4 2021; multiple color-coded series; placeholder text for legends and title.

PRO
Horizontal arrow-based layout split into Q1, Q2, and Q3 sections. Each quarter has a title and placeholder text.

PRO
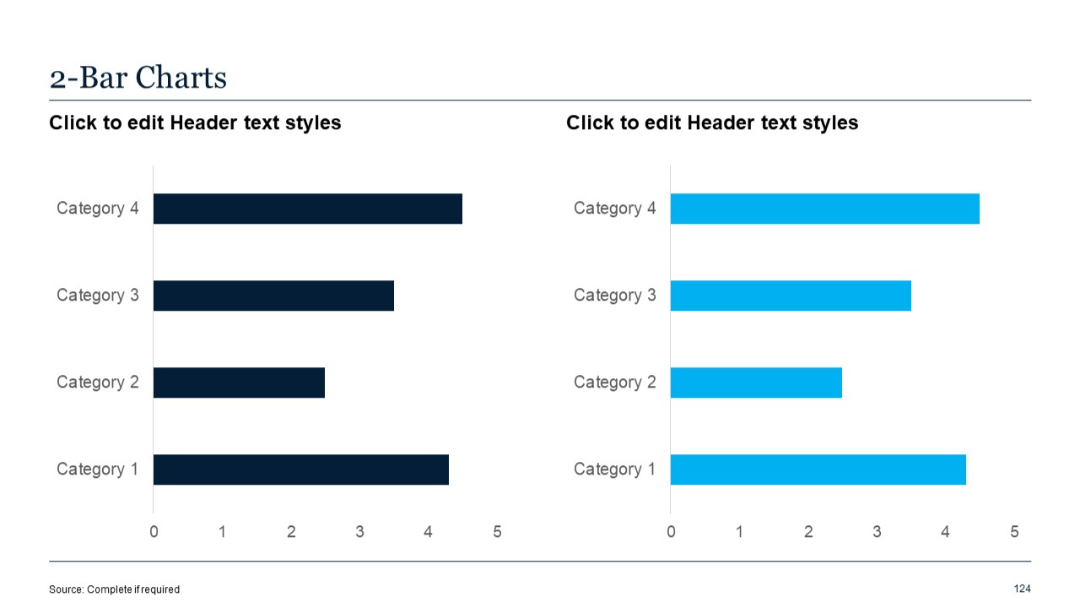
Two horizontal bar charts side-by-side with single-color bars. Left is navy, right is cyan.
PRO
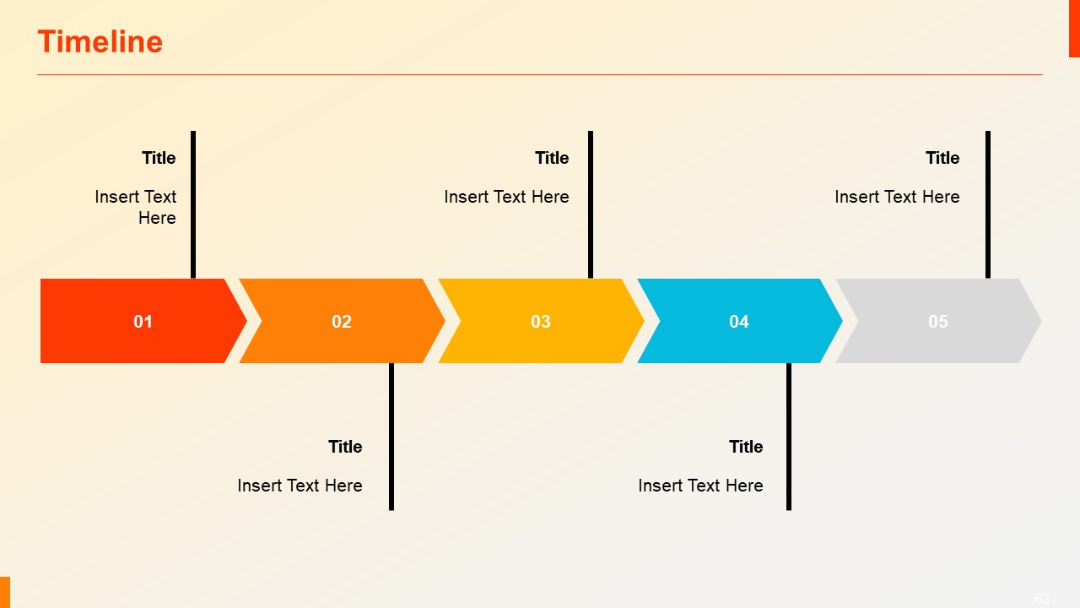
Horizontal arrow-shaped segments connected in sequence, with vertical lines linking to text areas.
PRO
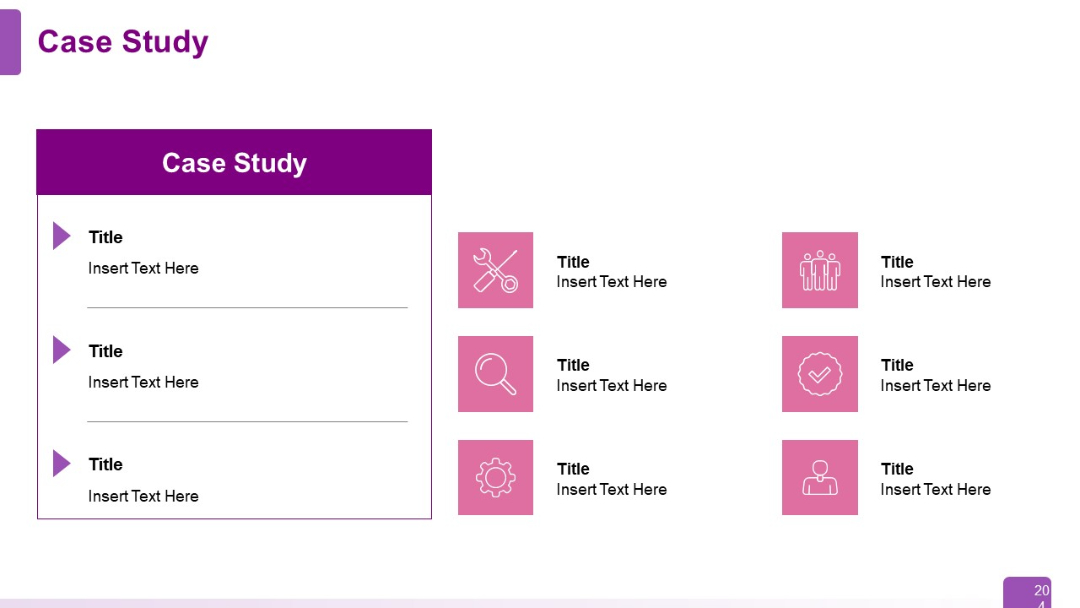
Left section features three bullet-point blocks under a purple header; right section shows six square icon blocks with titles. Balanced text-icon layout.
PRO
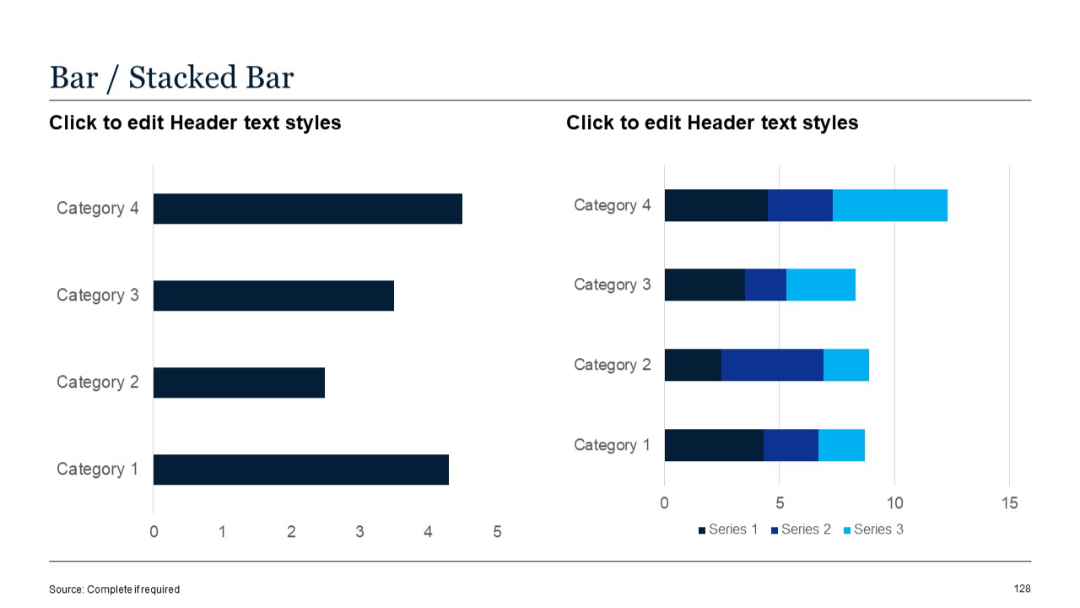
Left: standard horizontal bar chart; Right: stacked horizontal bar chart.
PRO
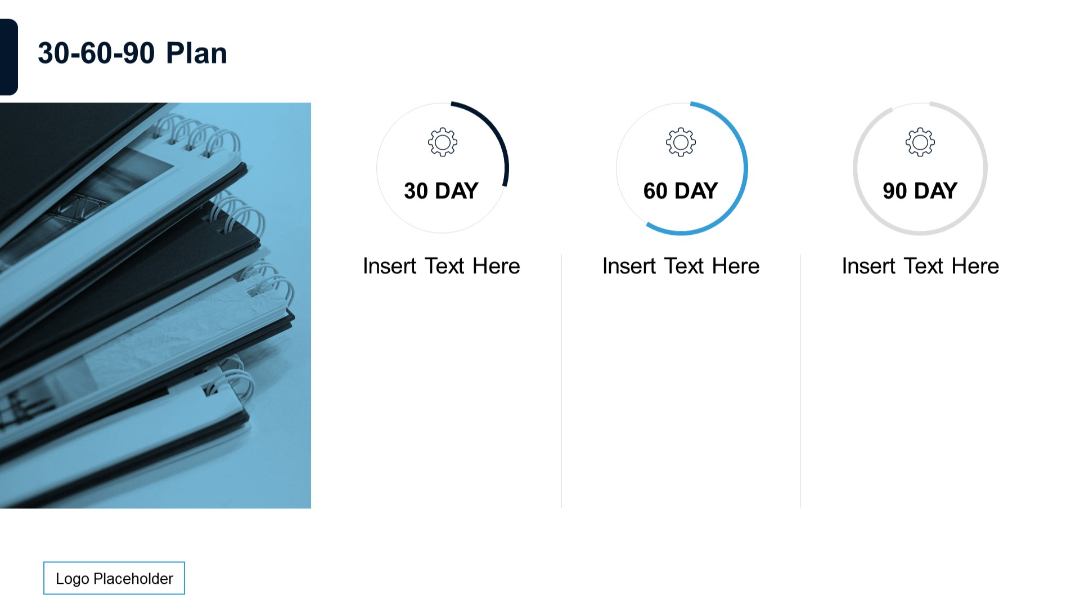
Visual layout with circular progress indicators for 30, 60, and 90 days, plus a photo of stacked notebooks.
PRO
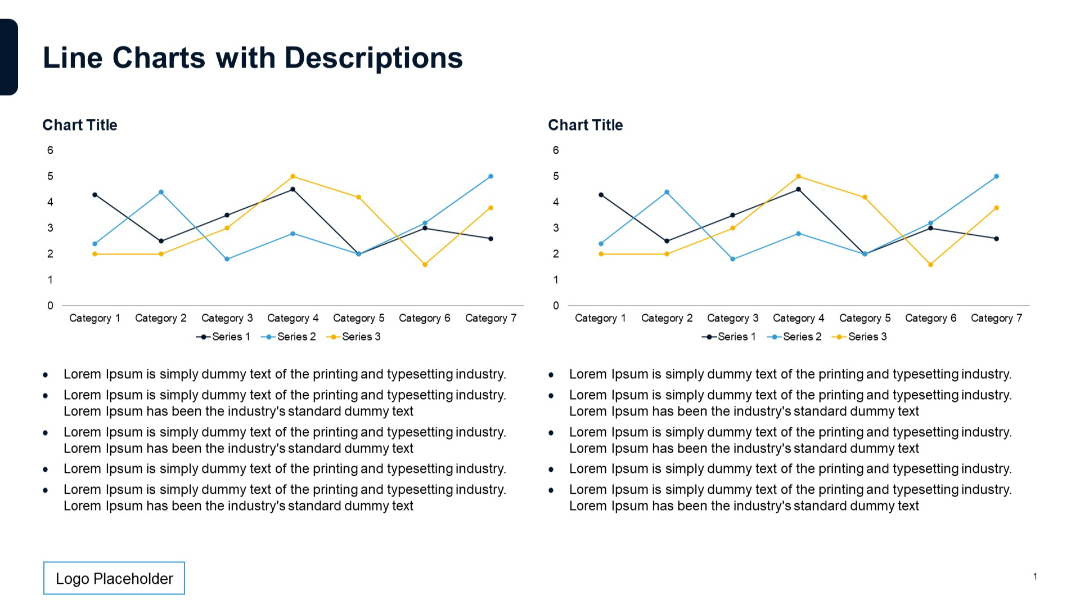
Dual line charts at the top with two sets of legend and axis labels. Bottom has bullet points in two columns for descriptive text.
PRO
Single large speech bubble with quotation marks and placeholder text.
PRO
Section divider slide with bold “03” and “Quantitative Slides” on a purple gradient banner; minimalistic and clean.

PRO
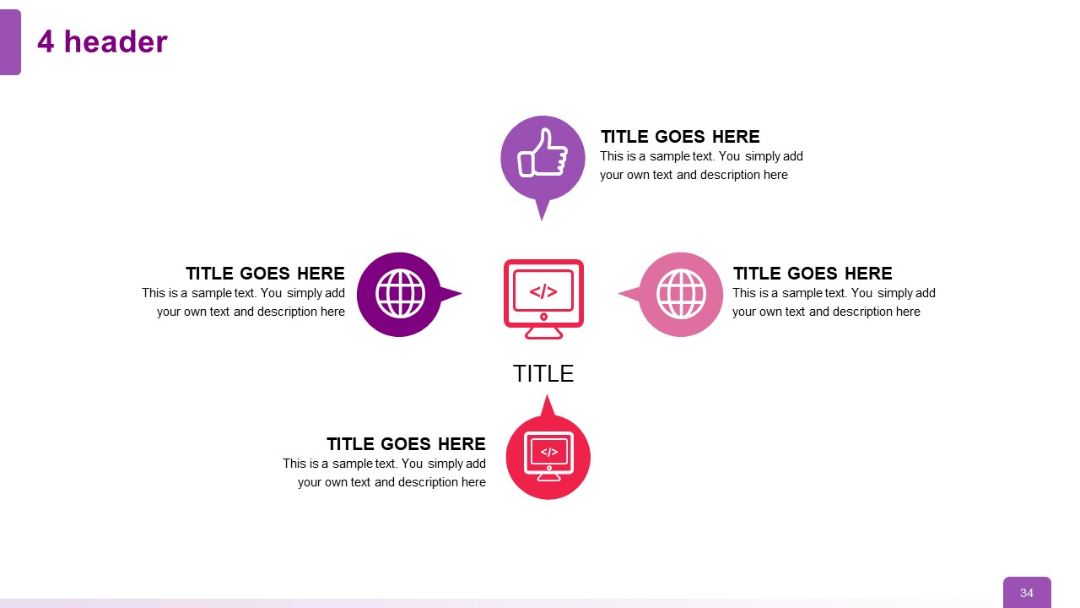
Central icon surrounded by four equally spaced icons/text blocks in a cross layout; structured and clear alignment.
PRO
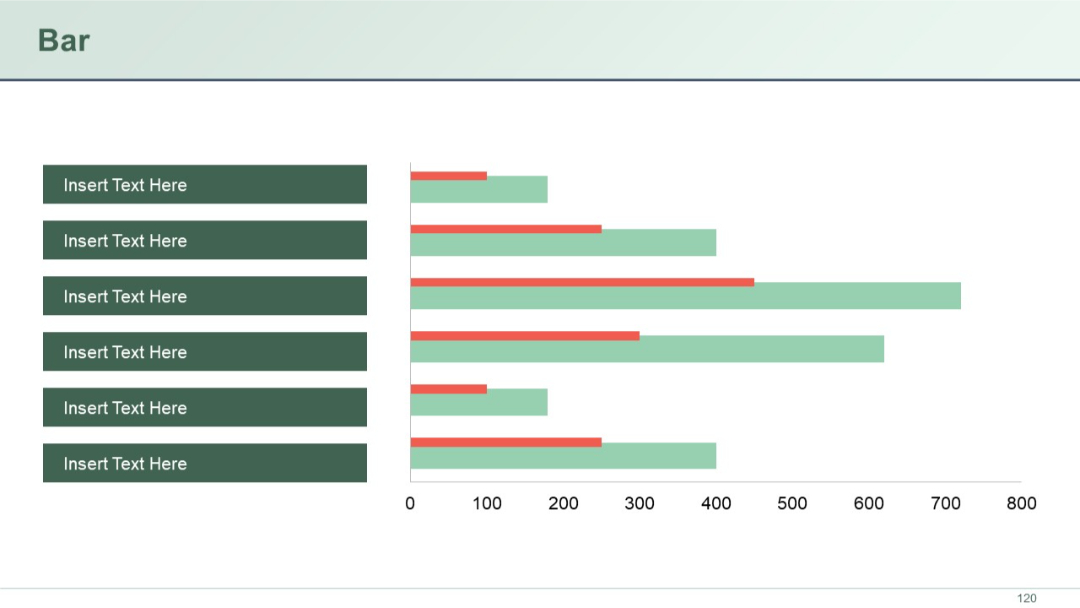
Horizontal bar chart comparing two values per item across six categories, each with labels. Uses green and red bars.
PRO
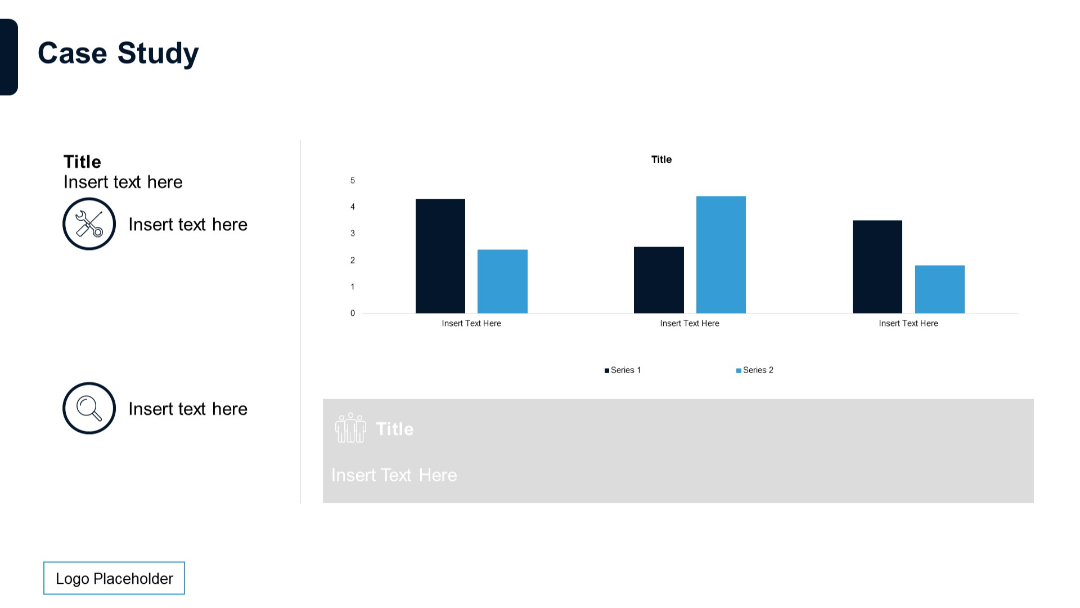
Bar chart with two data series and text blocks with icons on the left. Layout includes placeholders for titles and explanations.
PRO
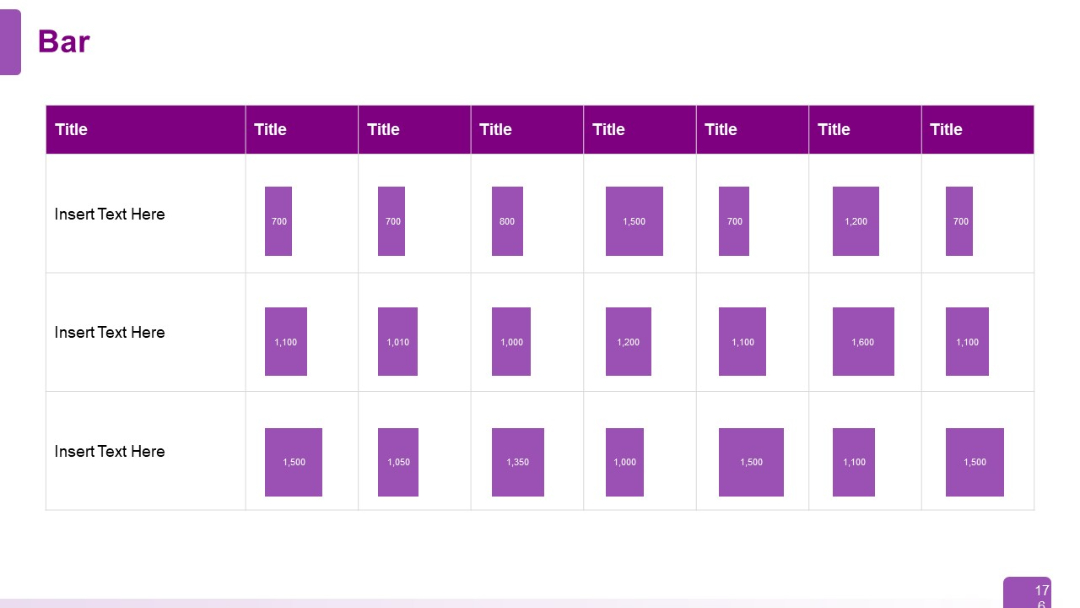
Grid layout combining a matrix-style table with miniature bar charts and data labels (e.g., 700, 1100, 1500). Titles and placeholders for text in each column and row.
PRO
Three-column layout with colored headers (purple, lavender, pink), white background, and top red title bar.
PRO
Dark navy background with a central white line ending in a circle; bold section title at bottom left with logo.

PRO
Full dark background slide with a white horizontal line ending in a circle, with minimal text and graphic arrows at the bottom right.

PRO
Four large numbered circles in a horizontal row with surrounding text; each circle has distinct color coding and central focus.
PRO
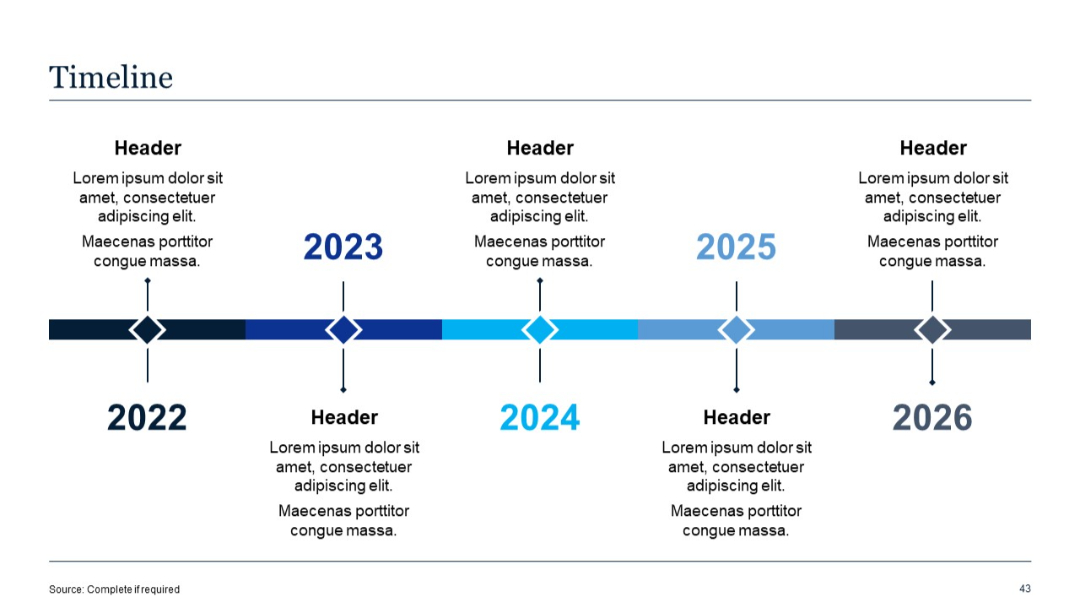
Horizontal timeline spanning 2022–2026, with alternating text boxes above and below a segmented line. Each year marked by a diamond shape.
PRO
Grid of four quote boxes with quote marks and clean borders. Minimalist design with placeholder text.
PRO
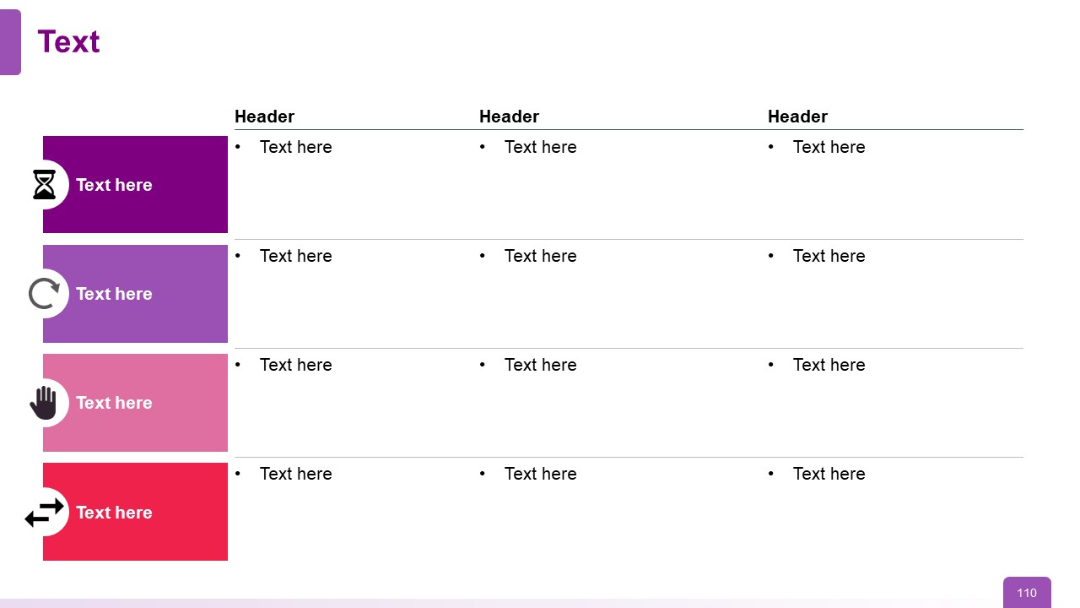
Three-column table format with icon-labeled side blocks and bulleted text in all columns. Each row uses the same icon-colored block on the left.
PRO
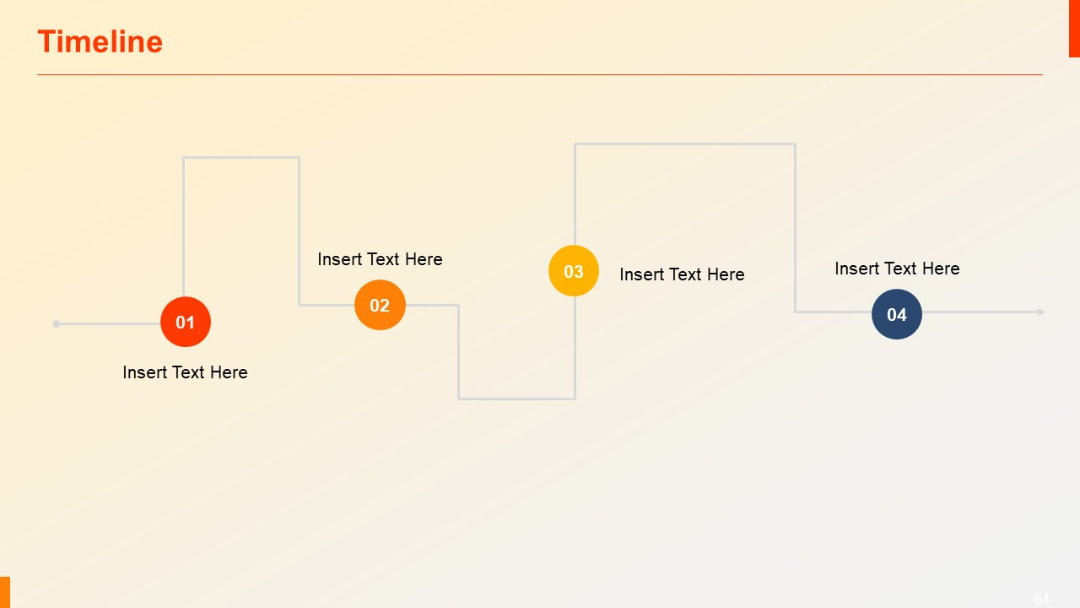
Zigzag timeline with circular steps connected by vertical and horizontal lines and text next to each step.
PRO
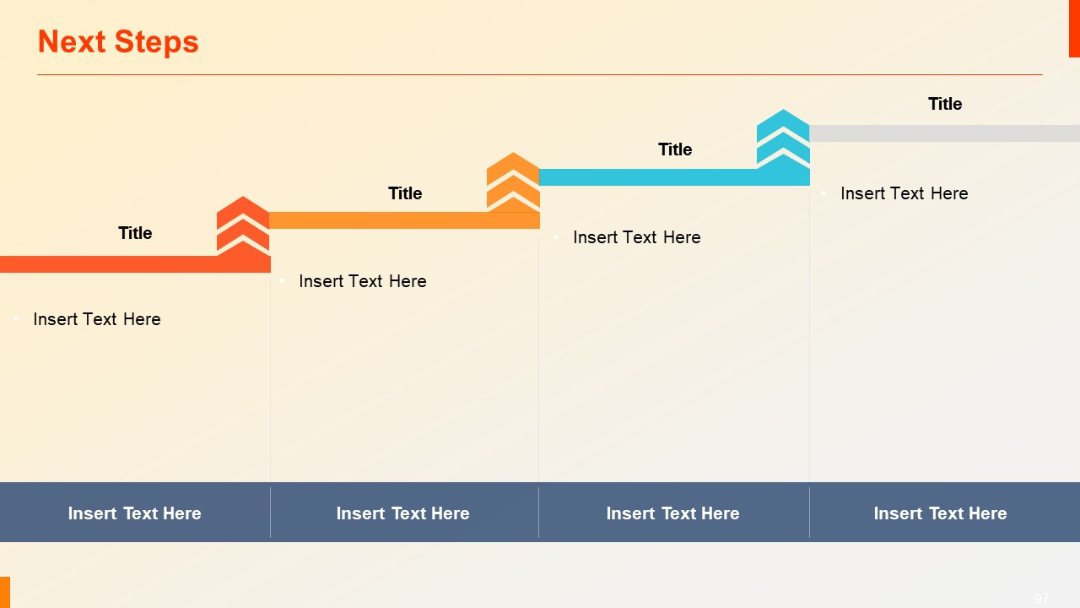
Horizontal path divided into four sections with upward arrows, each block featuring editable title and body text along a progression path.
PRO
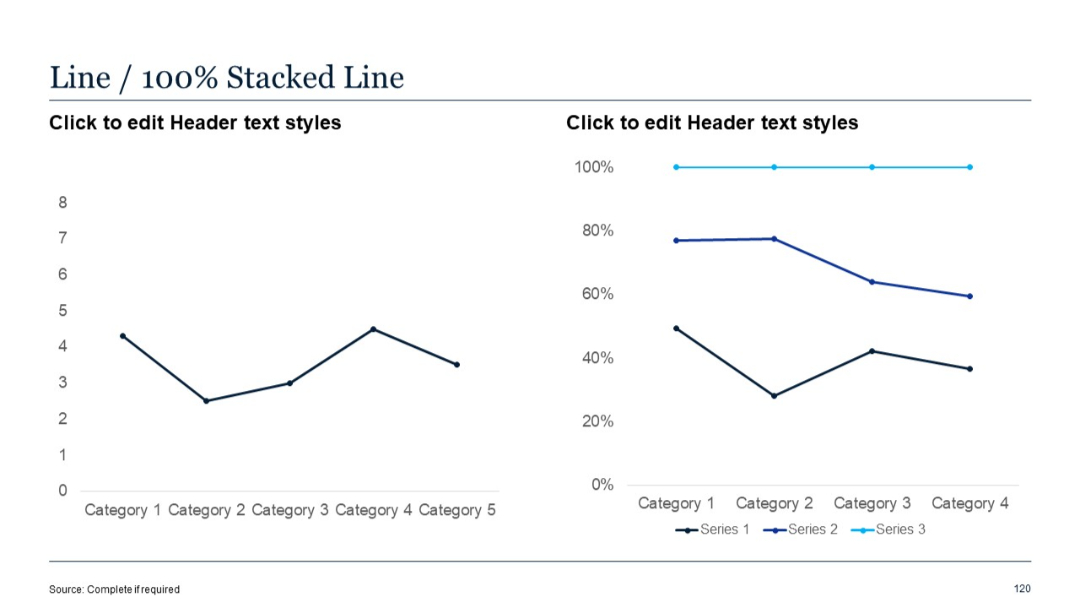
Two-panel layout: one line chart, one 100% stacked line chart; used to compare absolute and percentage trends.
PRO
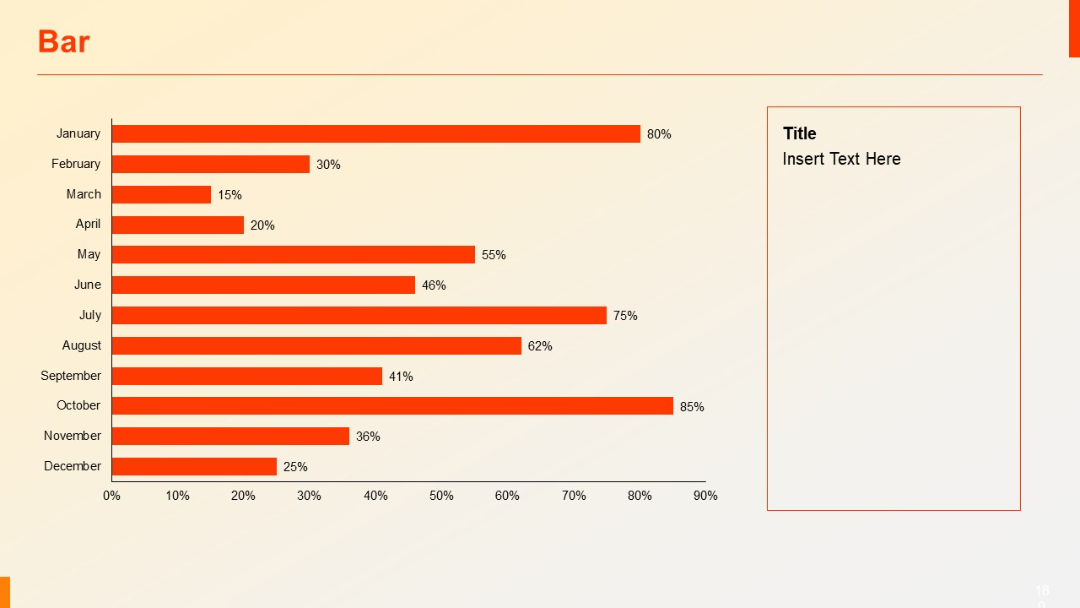
Horizontal bar chart showing months (January to December) on Y-axis, with orange bars and percentages. Text placeholder box on the right.
PRO
Single large quote section with a headline block in red. Quotation area framed with icons and large text field.

PRO
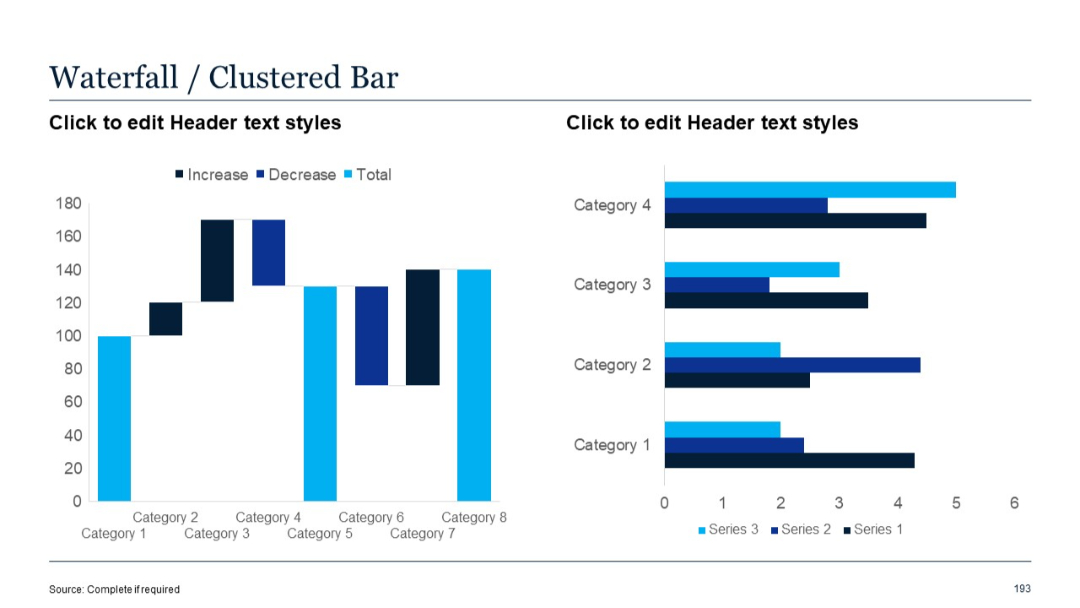
Left: waterfall chart; Right: clustered (side-by-side) bar chart for each category. Simple color-coded format.
PRO
Vertical timeline on left with colored circular bullets and matching icons, aligned with text blocks indicating time slots and session titles.

PRO
Dark-themed version of Slide 21 with vertical bullet point timeline on the left and detailed text on right.

PRO
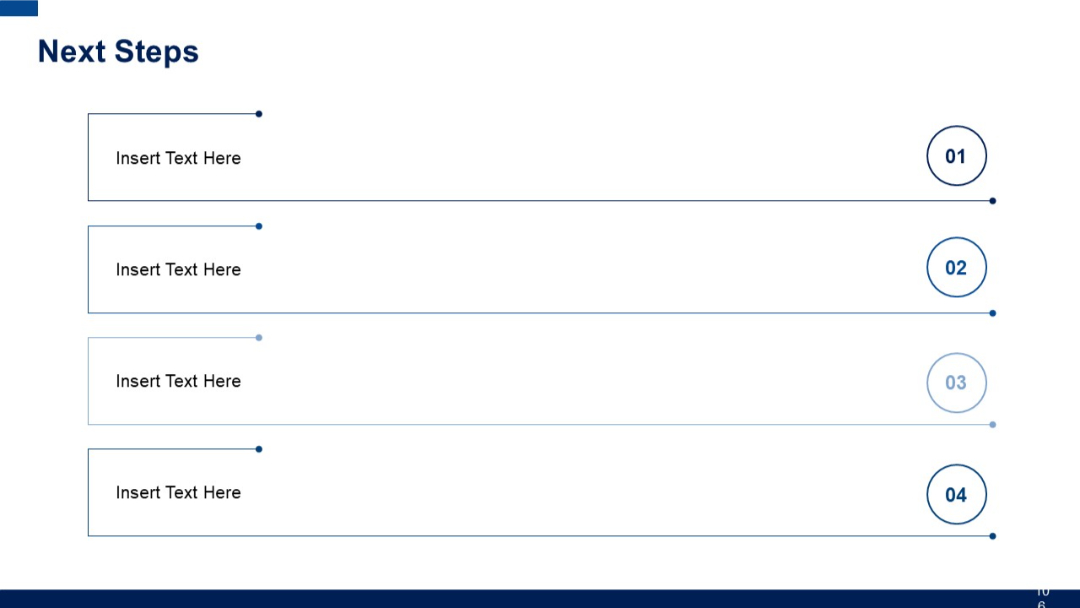
Four horizontally aligned minimalist blocks with circles on the right numbered 01–04 and text lines extending from the left.