PRO
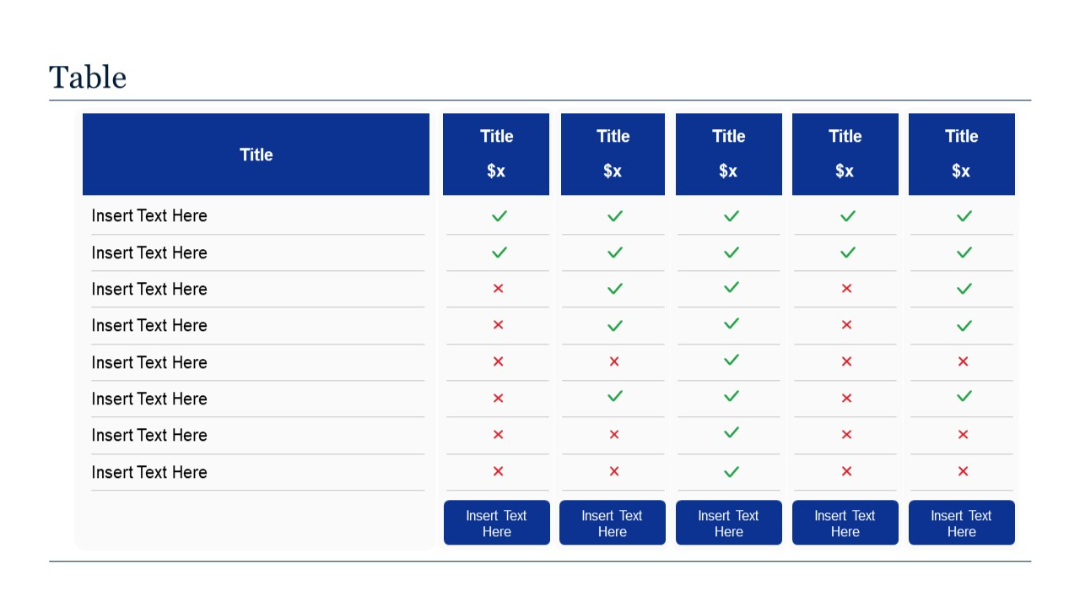
A 6-column comparison table showing feature lists and checkmark/x-mark evaluations across five different offerings.
PRO
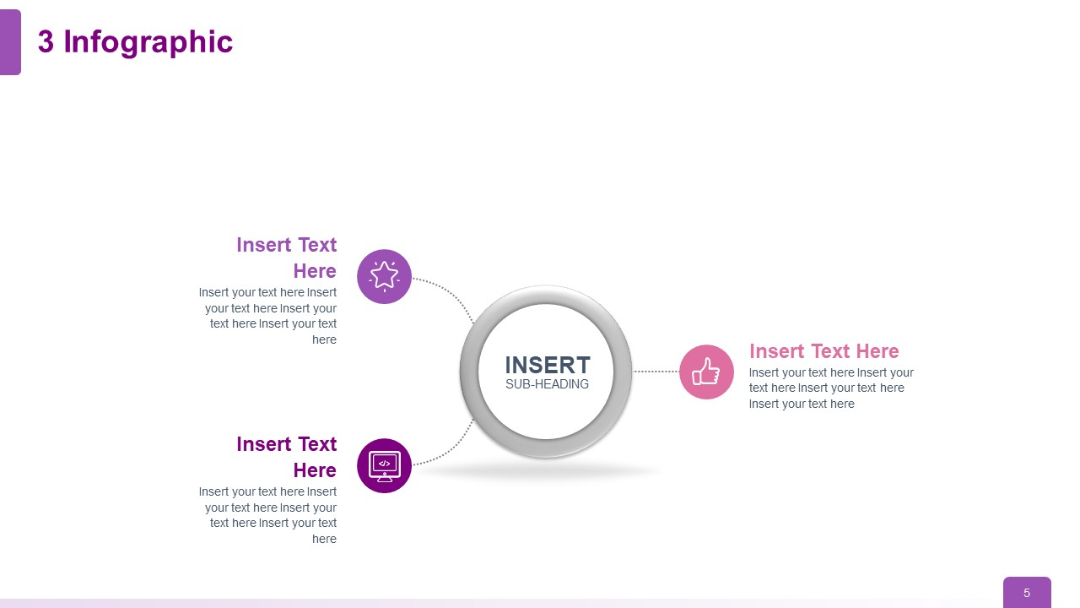
A three-branch infographic layout with icons and placeholder text extending from a central circle.
PRO
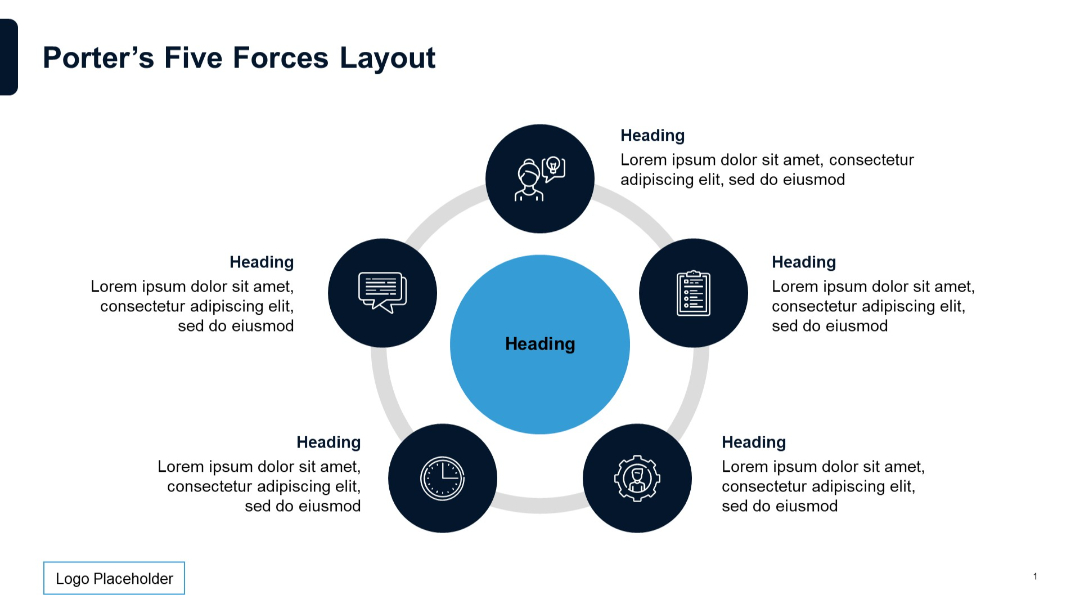
Circular diagram with five dark blue icons around a central circle, connected by a ring.
PRO
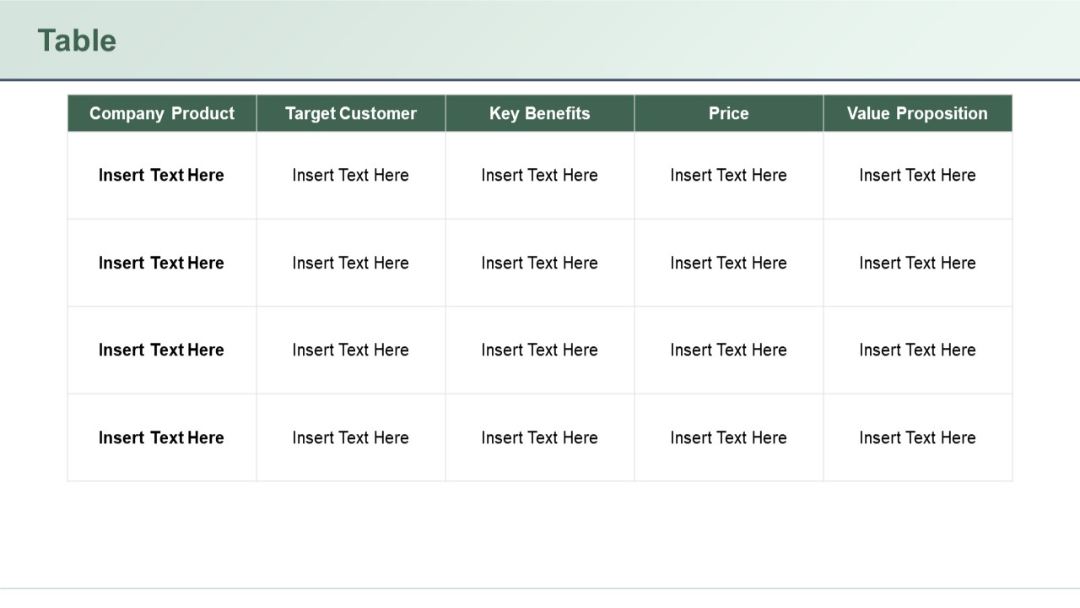
Extended version of the previous slide (93), with 4 rows and 5 columns. Repeated layout with identical formatting.
PRO
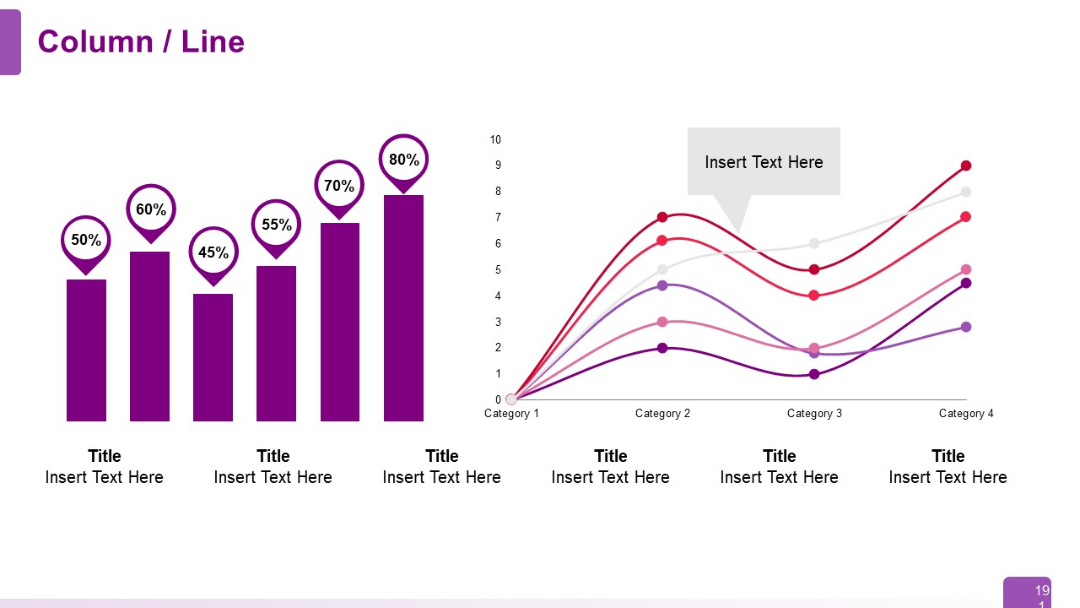
Split layout with vertical column chart (left) and a multi-line graph (right); modern, flat design.
PRO
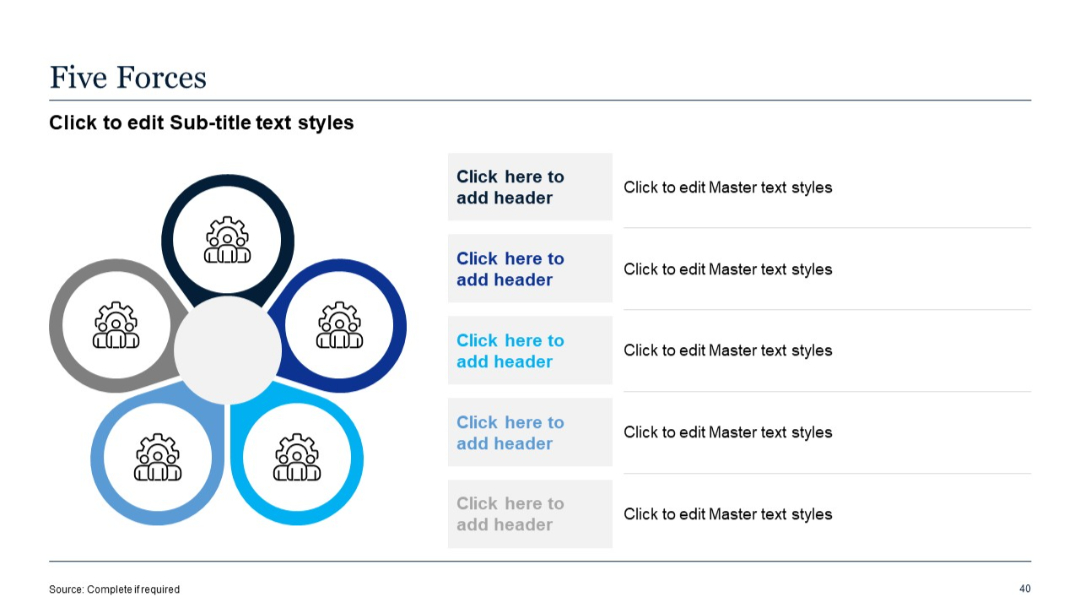
Diagram in flower/gear shape with five segments, each linking to editable headers and descriptions. Right side lists content aligned with each segment.
PRO
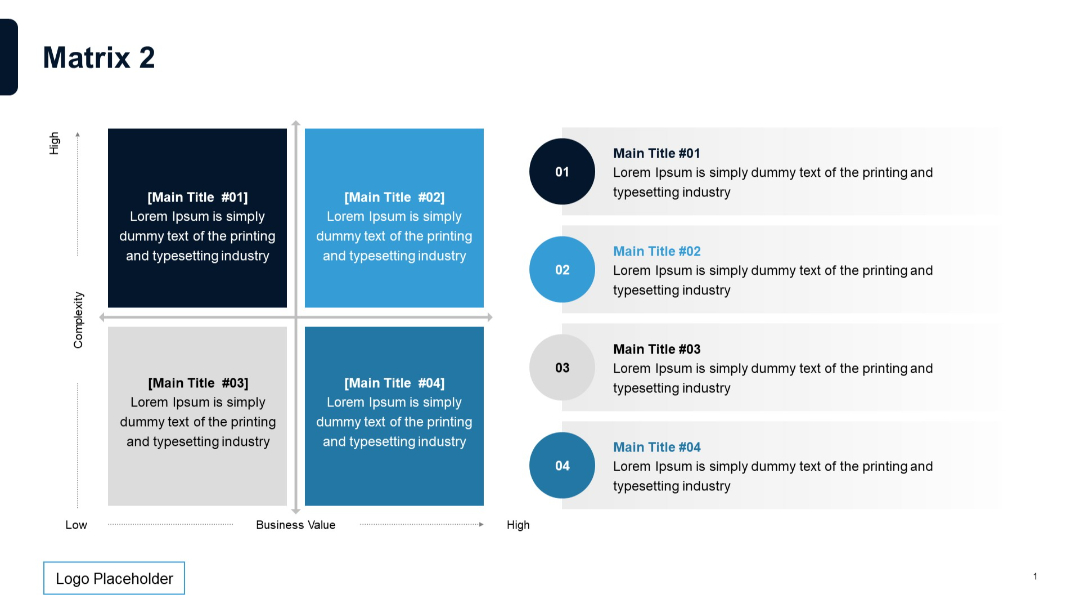
2x2 matrix on left with matching numbered descriptions on the right; enhanced visualization with vertical alignment for clarity.
PRO
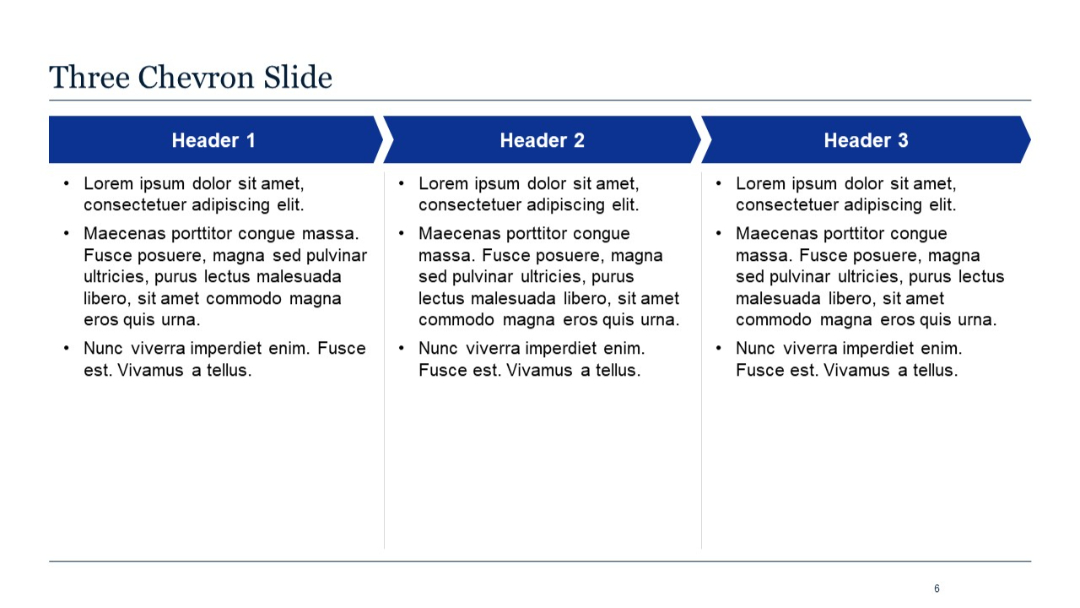
Horizontal chevron icons with text blocks below each; sectioned into 3 parts.
PRO
Text-heavy layout with a bold heading above a bullet-pointed list, occupying a single column across the page.

PRO
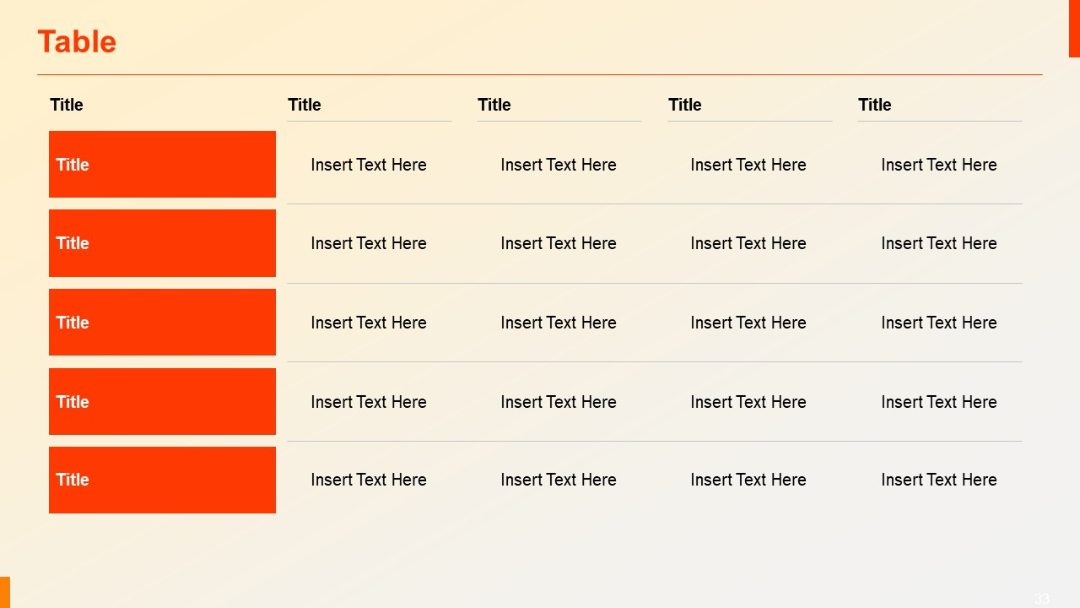
Expanded to 5 rows; consistent layout with red left column blocks and 4 accompanying data columns with placeholders.
PRO
A sldie with consistent icon placement and textual formatting.
PRO
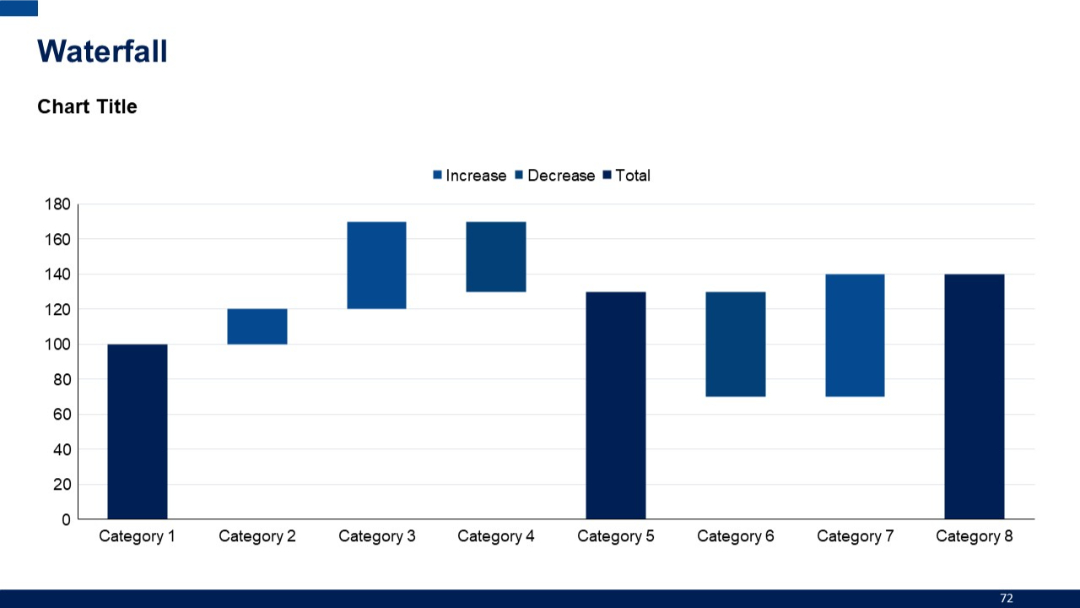
Waterfall chart with multiple bars indicating increases and decreases across categories. Minimalistic layout with chart title on top left.
PRO
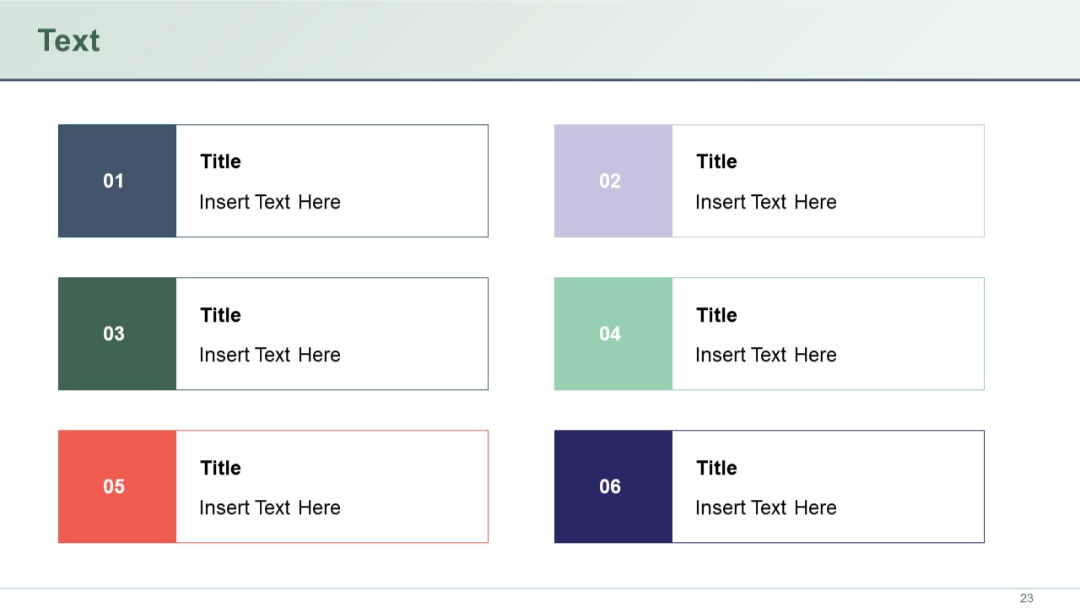
Three rows with two boxes each; every box has a colored number block, title, and placeholder text. Uses a variety of soft colors for segmentation.
PRO
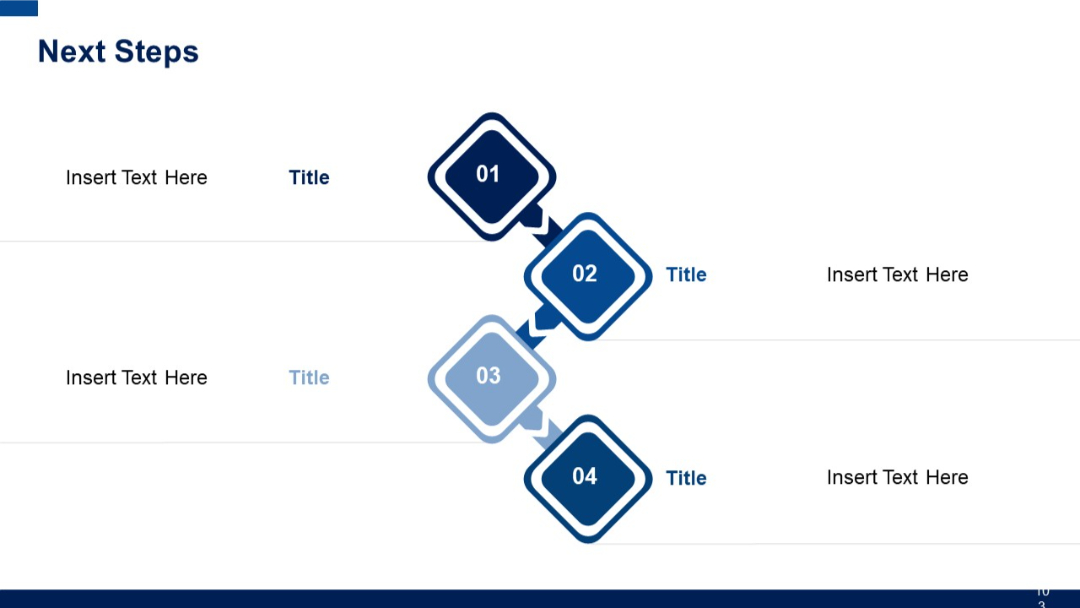
Four diamond-shaped connected blocks numbered 01–04, alternating between left and right side, each with title and placeholder text areas.
PRO
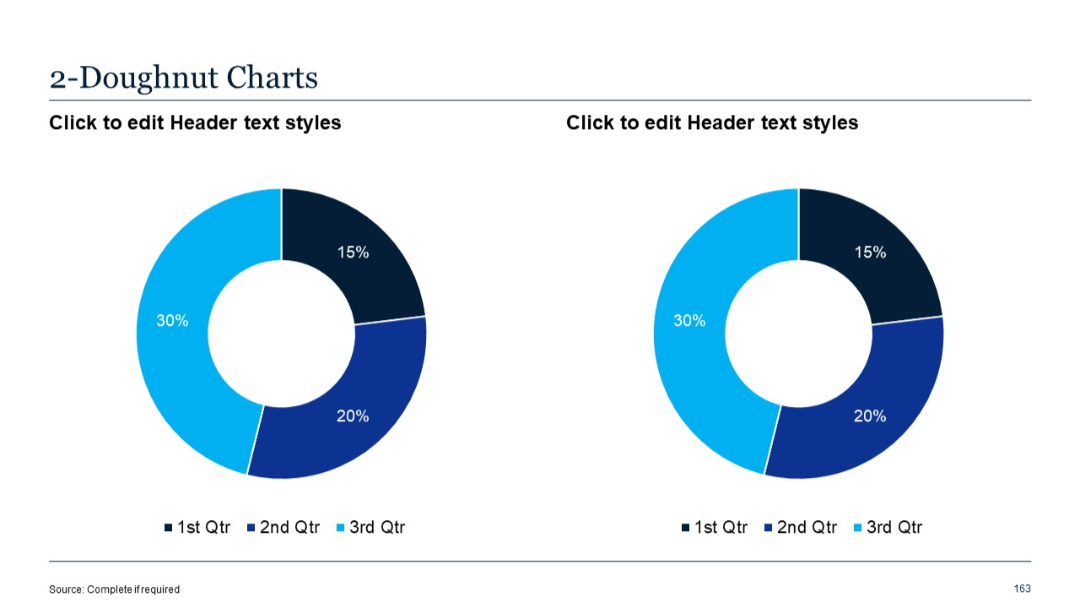
Two doughnut charts placed side by side, each divided into three labeled and color-coded segments.
PRO
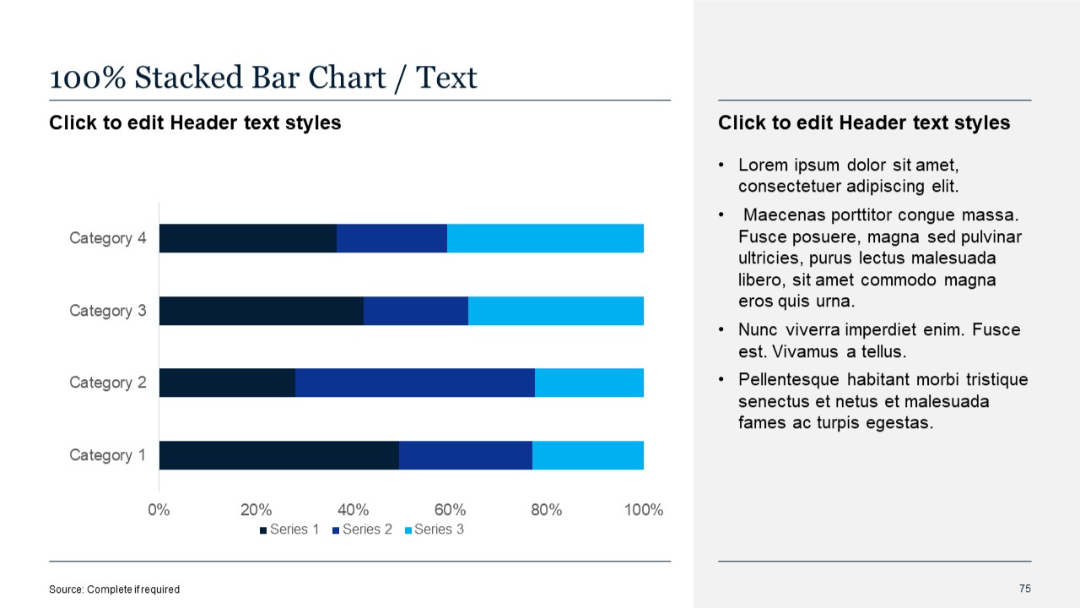
100% stacked horizontal bar chart with proportions clearly marked. Uses consistent color scheme across series.
PRO
Four text boxes arranged around a central puzzle-piece graphic in a circular format, each piece in a different pastel shade with quote icons.

PRO
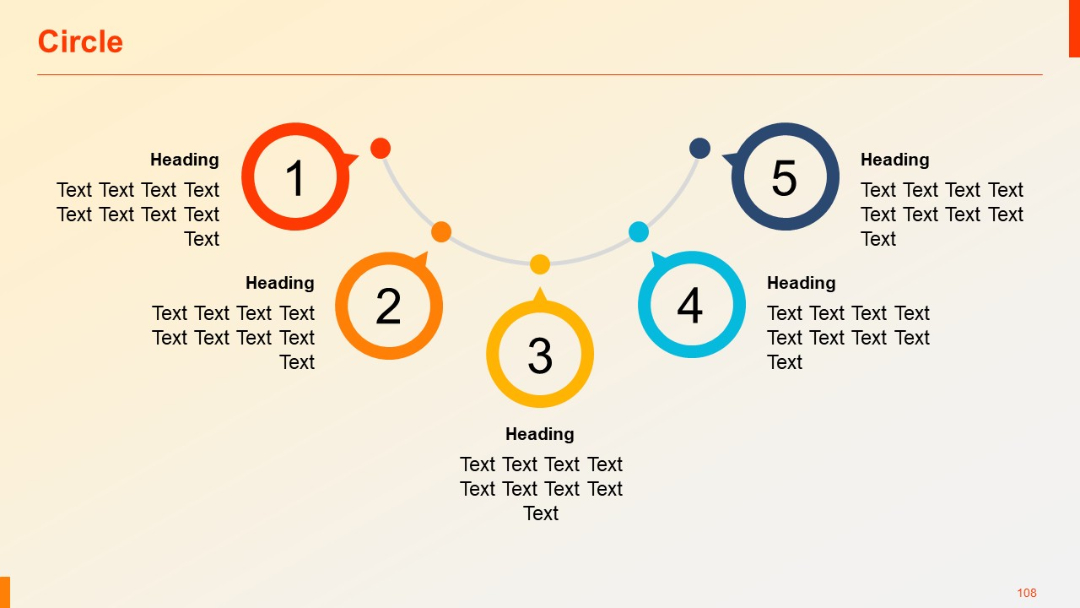
Five-step circular process with arrows linking numbered icons in an upward curve; corresponding headings and text per item.
PRO
Dotted circular path with six icon-based steps, alternating color and direction for each segment.
PRO
Two-column layout with a grey schedule panel and numbered circular icons for session entries.
PRO
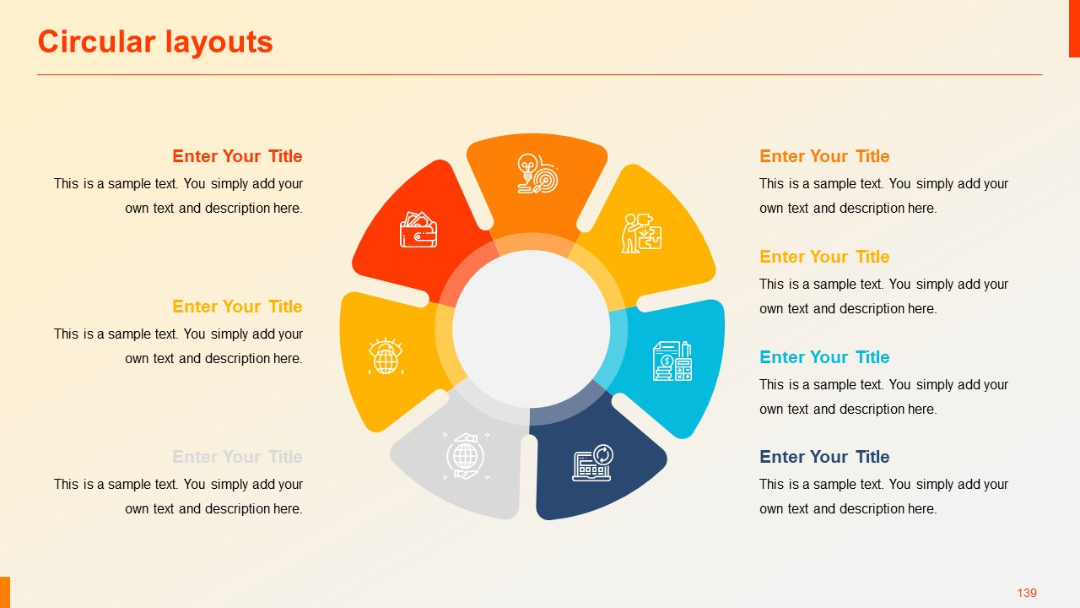
Circular diagram with 7 connected segments and corresponding outer labels in circular text boxes. Consistent dark blue palette.

PRO
Left side features an area chart with two series shaded in purple gradients. Right side includes two donut charts for 2023 and 2024 with percent values, each above text boxes.

PRO
Curved timeline with four shield-shaped callouts and circular numbered markers below each point.
PRO
Dark background version with boxed portraits and compact bios; horizontal layout.

PRO
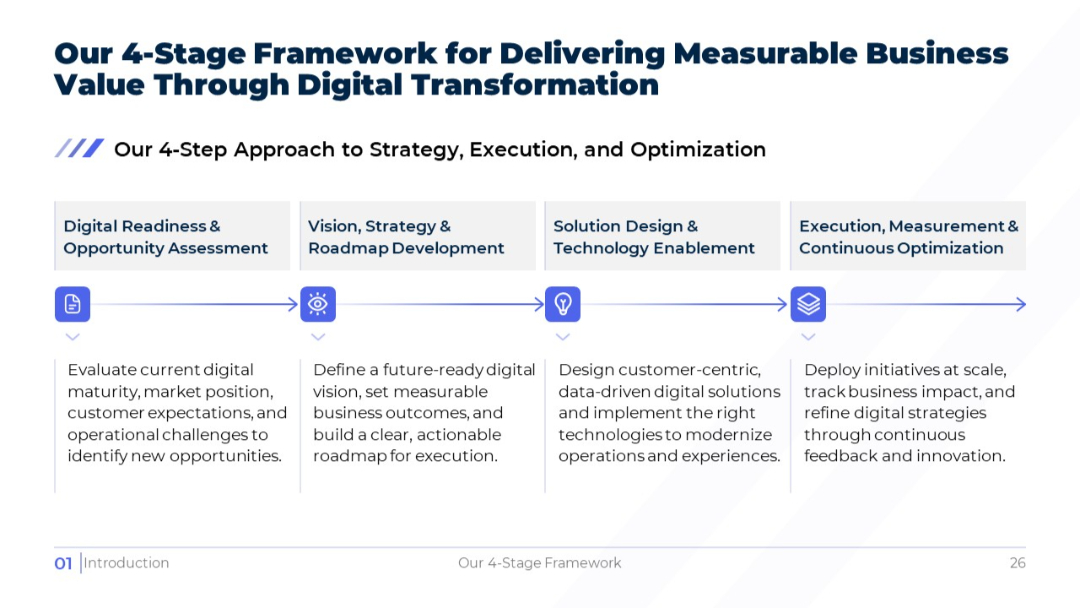
Light version of the prior slide with four horizontal stages, each with icon and description beneath.
PRO
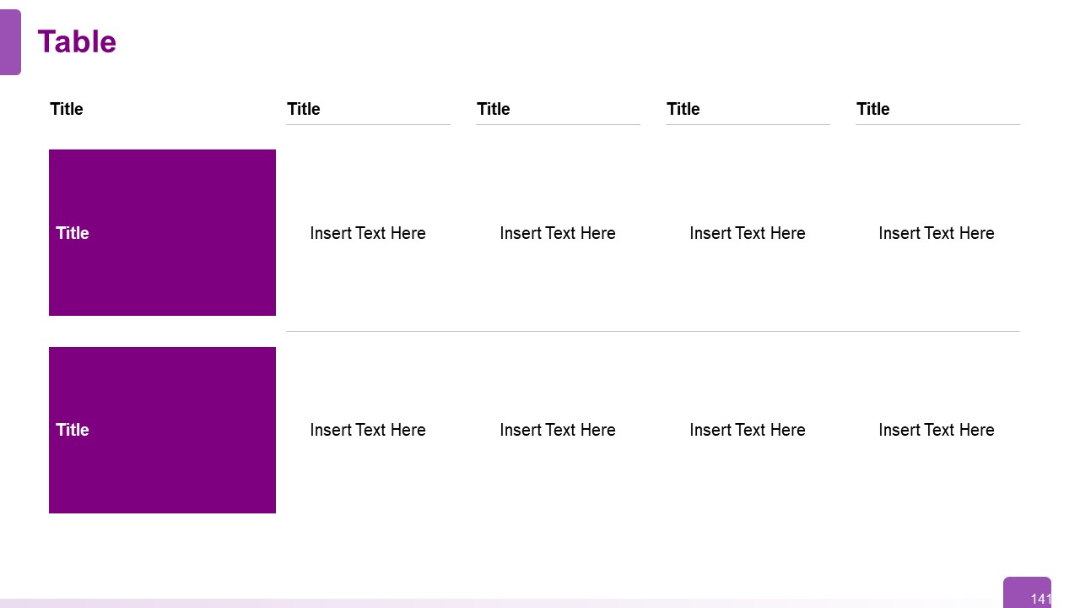
Two-row, five-column table; first column has bold purple boxes for row titles; other columns are text fields. Clean, structured layout.
PRO
Three-card layout with folded corner design; each card has a number, title, and placeholder text. Distinct color shades for visual segmentation.
PRO
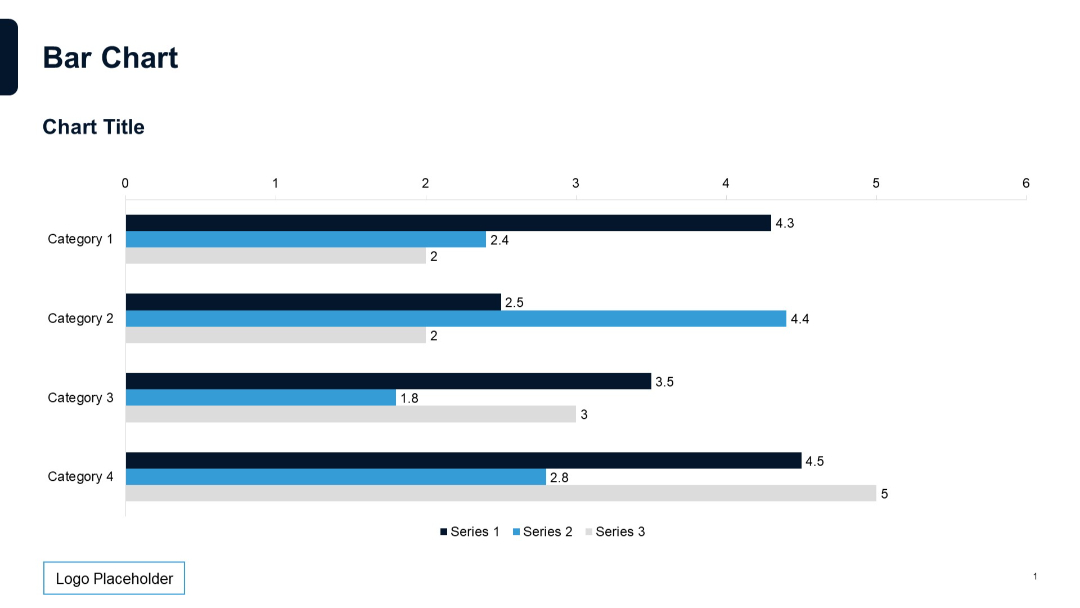
Horizontal bar chart with three series per category, data labels on bars, and categories listed on the y-axis.
PRO
Four vertical segments in different colors with timeline-style dots and editable areas under title blocks.

PRO
Arrow-style segmented process in circular arrangement with six steps labeled and text placeholders.


