PRO
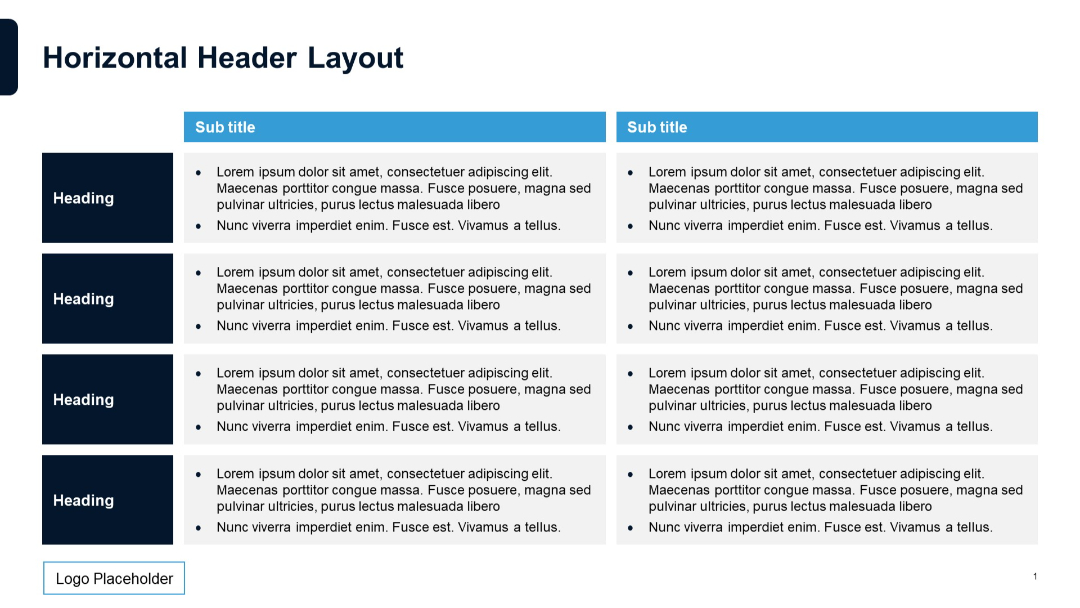
Alternating light and dark sections. Left column contains headers; right two columns contain bulleted text under sub titles. A grid layout with a light blue subtitle banner.
PRO
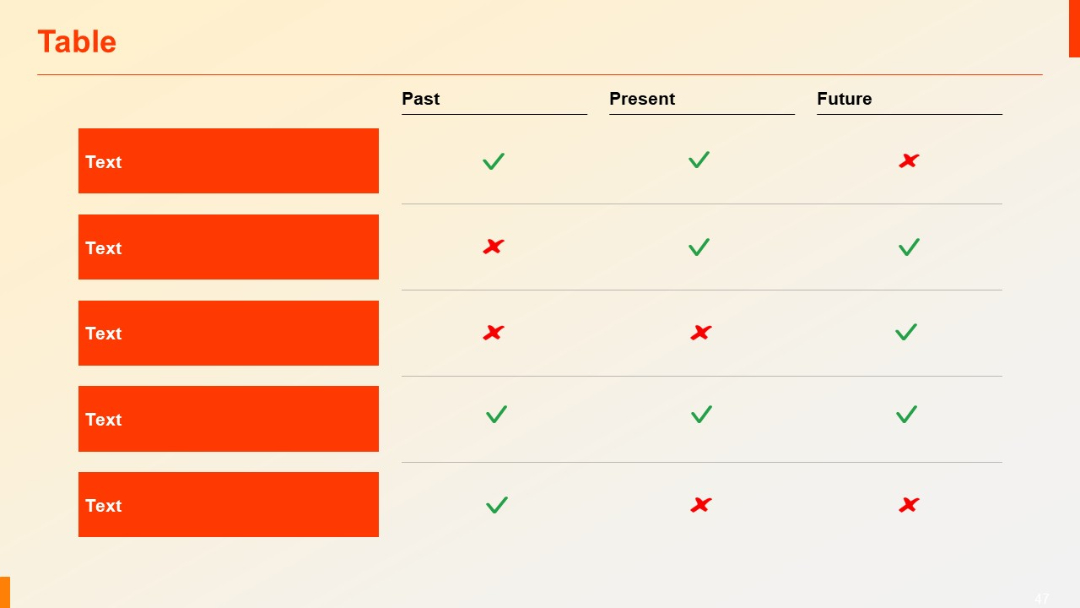
3-column layout showing time-based comparison (Past, Present, Future). Rows on left contain bold text categories.
PRO
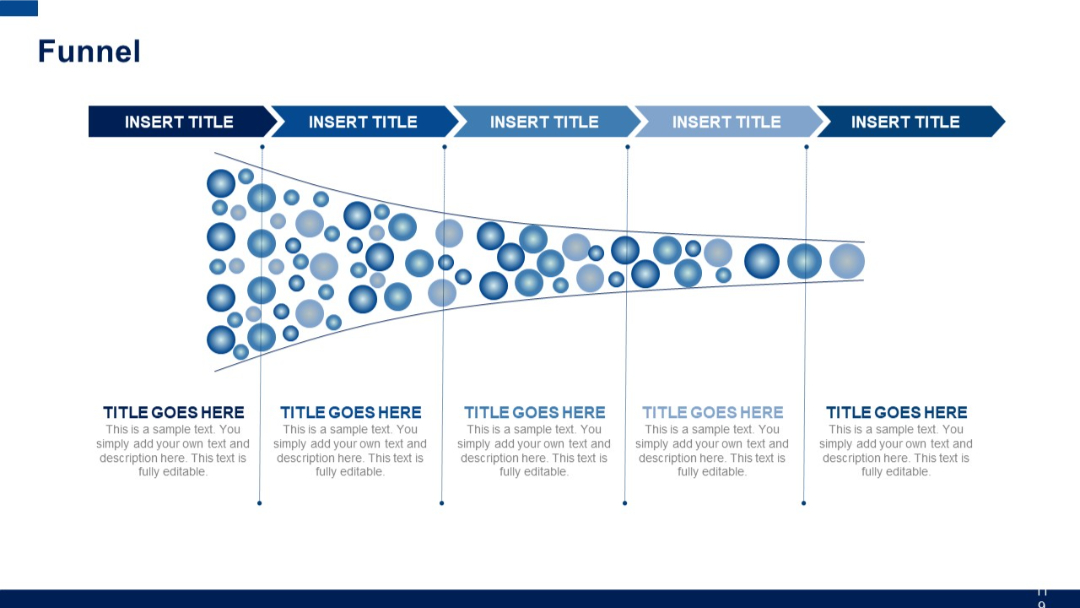
Horizontal funnel filled with floating bubbles, tapering from left to right. Five stages with title and description at the bottom.
PRO
Rectangular top-level boxes with circular lower nodes arranged horizontally beneath each, creating a three-division structure.
PRO
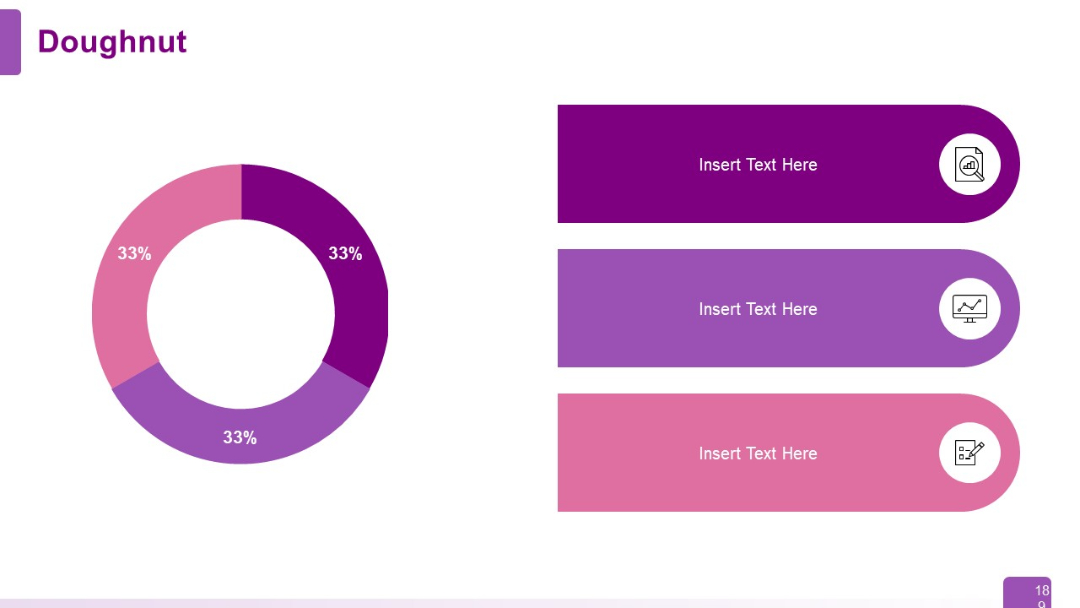
Left-aligned doughnut chart with equal segments. Right side includes three rounded rectangles for text with icons.
PRO
Three-column layout with subtitle headers, evenly spaced across the slide; empty placeholders for future input.
PRO
Four rectangular quote boxes arranged in a 2x2 grid. Each box contains placeholder text, a silhouette of a person, and stylized quotation marks. The layout is minimal, with a monochrome color scheme and a modern, clean design.
PRO
Vertical list of four rectangular blocks with large numbered tags (01–04) in bold colored tabs on the left. Each block has placeholder text.
PRO
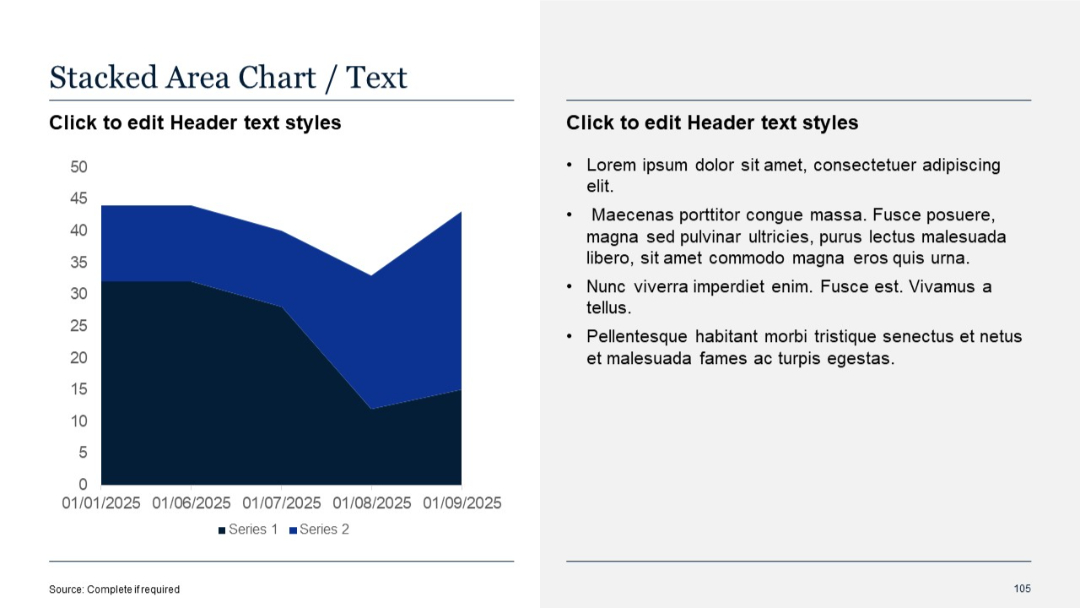
Similar layout with a stacked area chart (larger scale); right panel includes bullet point text.
PRO
Three-column layout with purple headers and large vertical sections for text. Visual emphasis on column-wise comparison.
PRO
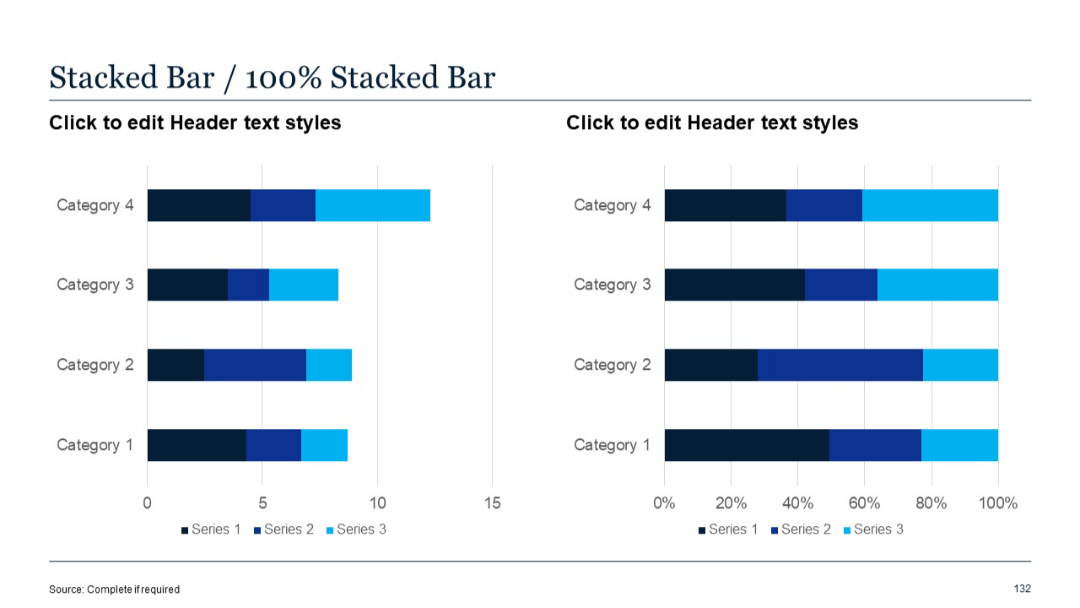
Two horizontally aligned bar charts. Left is a regular stacked bar chart, right is 100% stacked bar showing percentage contributions across categories.
PRO
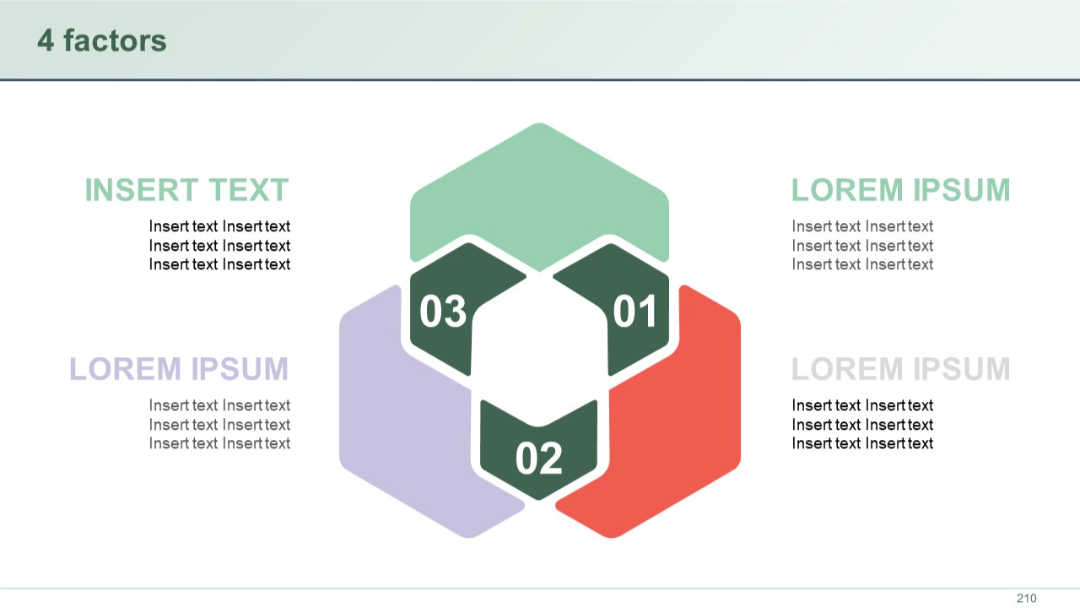
Four interlocked pentagon segments forming a cube-like shape with numbered centers and supporting text outside.
PRO
Time-block format with AM/PM slots on the left, circular icons, and triangle pointers toward session details.

PRO
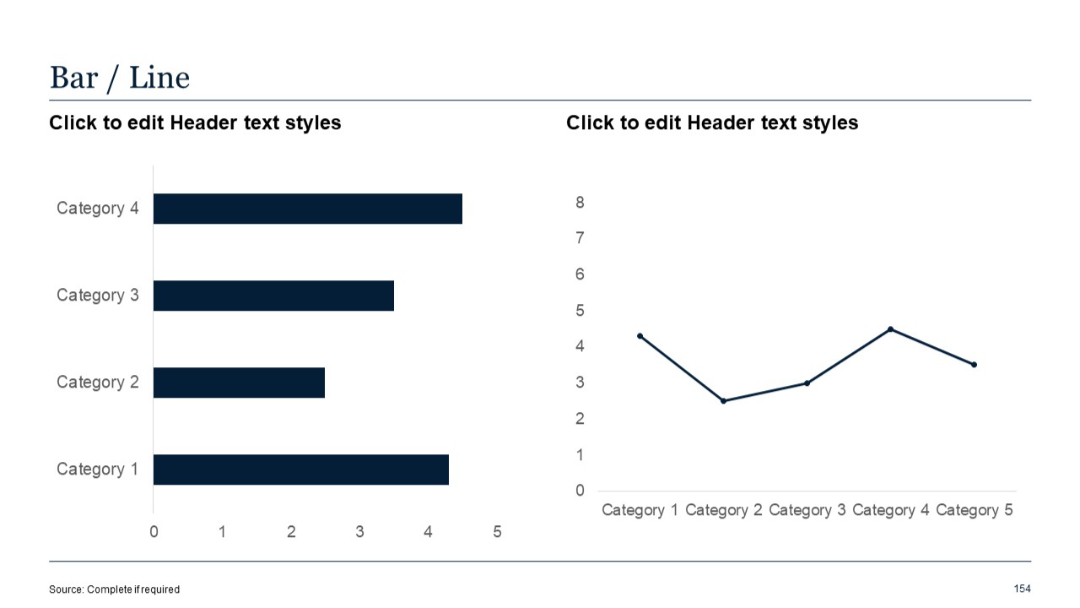
Left chart shows horizontal bars; right chart displays a line graph. Uses basic design with dark blue bars and line.
PRO
Dark-themed layout with horizontal bar chart (performance improvement by digital maturity level) and descriptive text panel.

PRO
Simple grid layout with six identical rows, each with a number and placeholder text. Minimal design with consistent spacing and alignment.
PRO
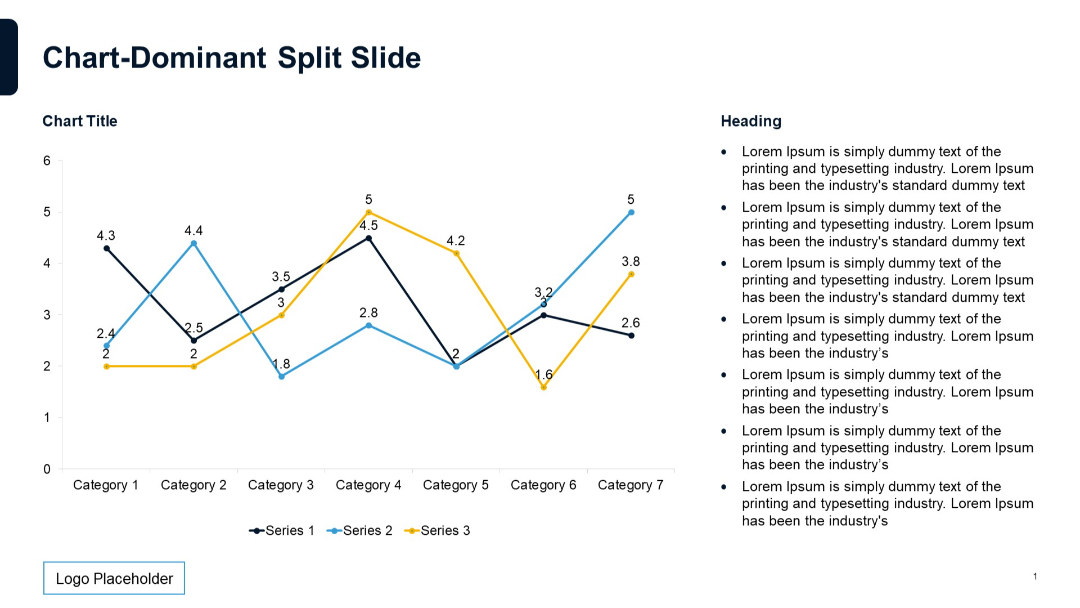
Split slide with a line chart on the left and bulleted text on the right; three series plotted across categories, clean and balanced layout.
PRO
Left: doughnut chart with three equal segments (33%). Right: three rounded rectangular blocks with icons and text placeholders.
PRO
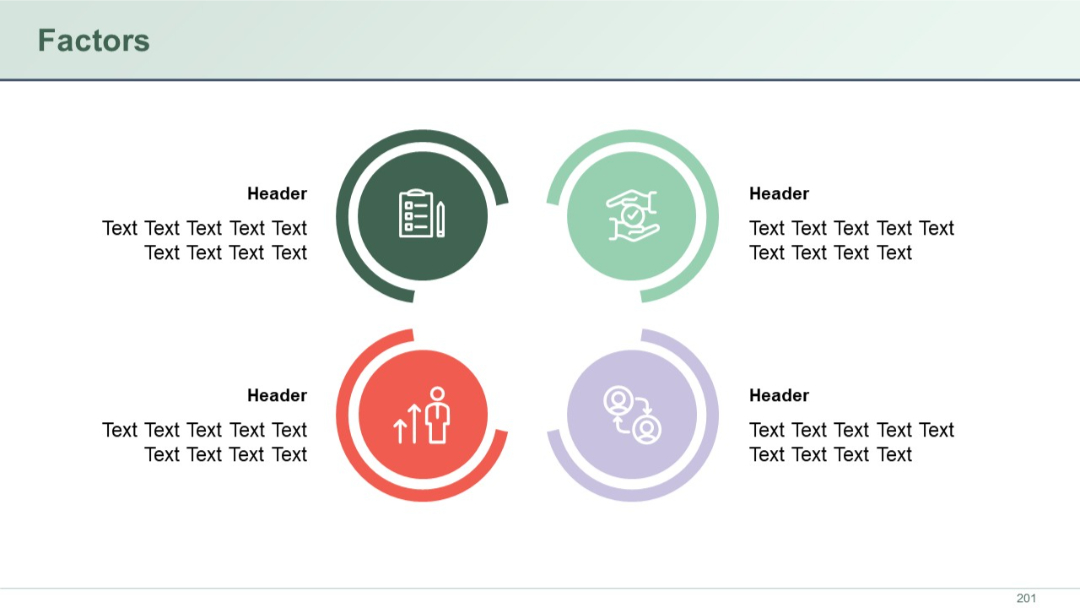
Four circular icons arranged in a 2x2 grid, each with a colored ring and header text beside it. Clean layout with balanced white space.
PRO
Two-segment donut-style circle with a hole in the center, split vertically, and labeled "Insert text" on either side.
PRO
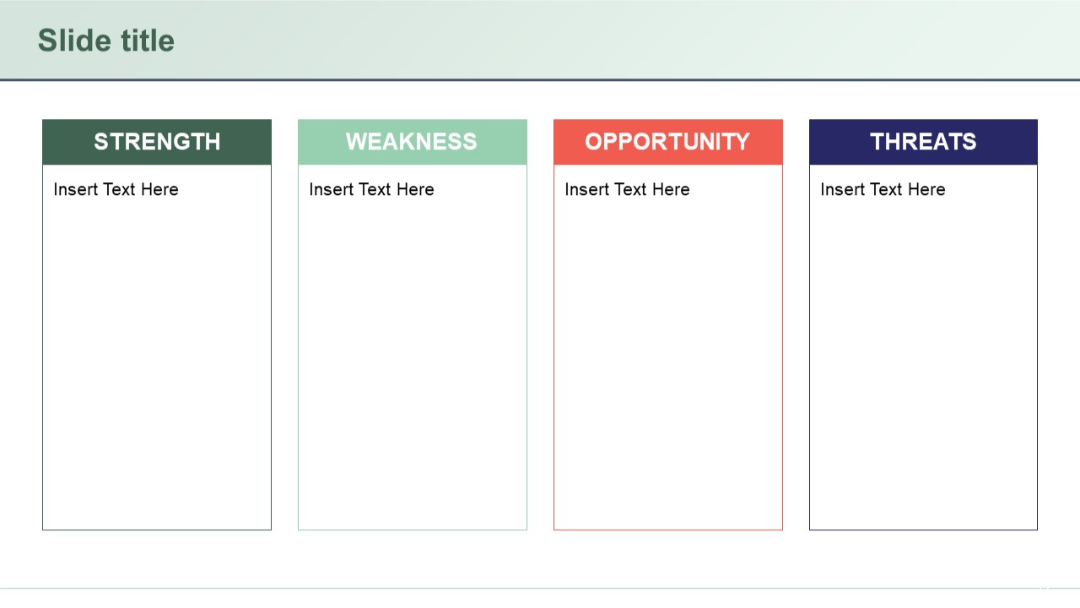
Four-column layout with bold colored headers for each SWOT component (Strength, Weakness, Opportunity, Threat). Minimalist white background.
PRO
Vertical list with 5 horizontal green rounded boxes, each preceded by a circle on the left, aligned along a central timeline line.
PRO
Split-screen layout with “YES” in red and “NO” in yellow sections flanking a central human figure; text boxes under each side for explanation.
PRO
Curved path with five pinpoints along the path, each connected to a speech-bubble-style text box. Numbered sequentially.
PRO
Vertical process flow with three circular icons (rocket, code, bulb) on the left connected by dotted line; text box with bullets on the right.
PRO
Vertical bar chart; categories on X-axis; bullet text on right; series comparison.

PRO
Horizontal arrow-based timeline with four key points marked with colored arrows and vertical text callouts; clean with a modern gradient.
PRO
Star-shaped central element with five icons and matching headers placed at each point. Balanced and symmetrical design.

PRO
Two-row, five-column table with wide first column (purple block titles), followed by plain text columns. Balanced spacing.

PRO
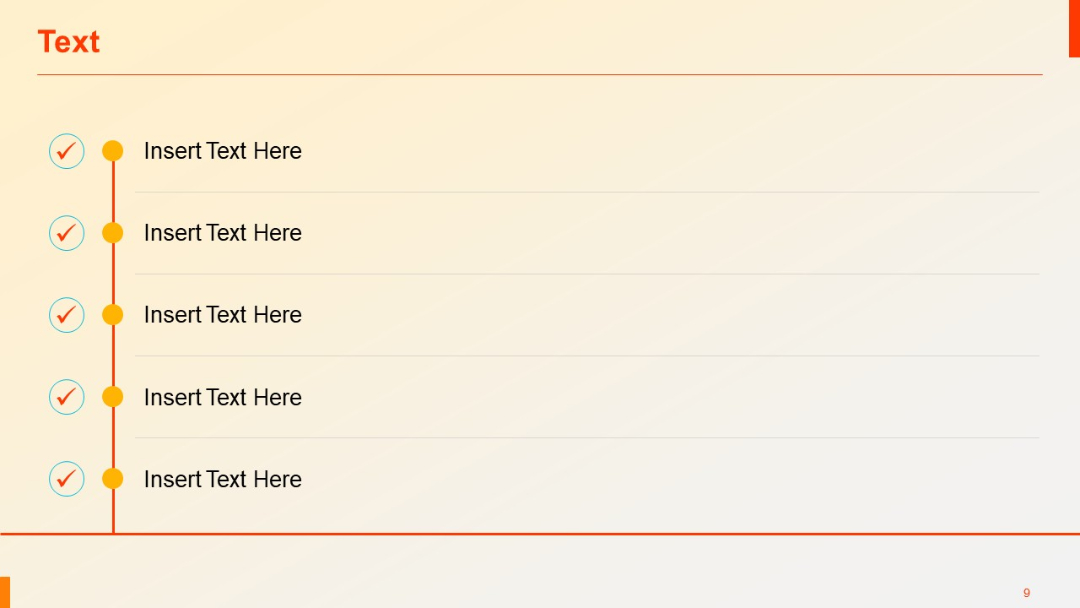
Vertical list with checkmark icons and circle bullets aligned to the left, with line dividers.