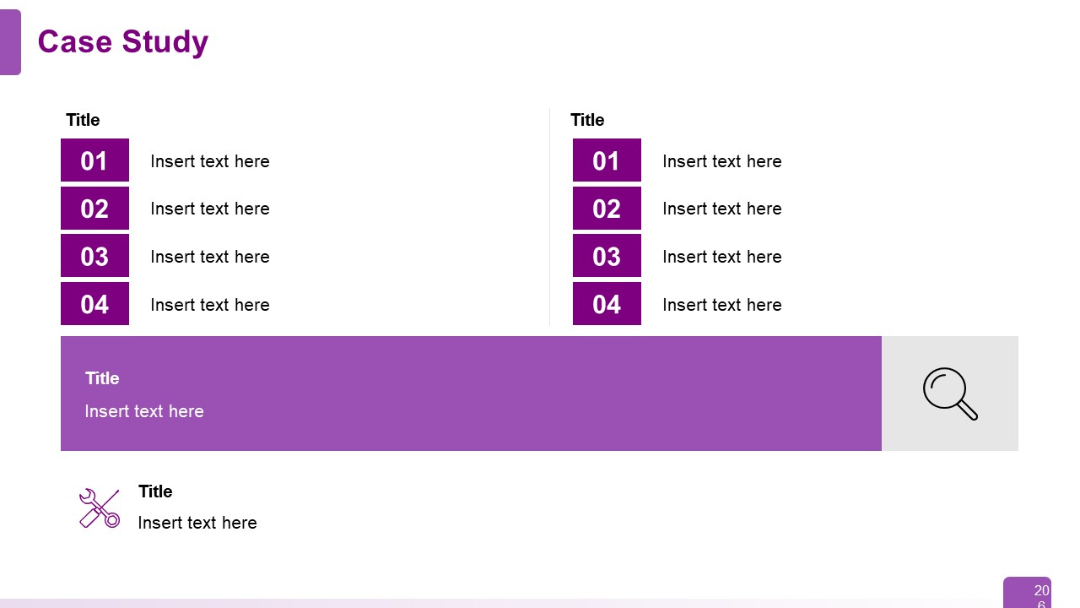
PRO
Combination layout with numbered lists (left and center) and a large purple bar at the bottom containing text and a search icon. Clean segmentation.
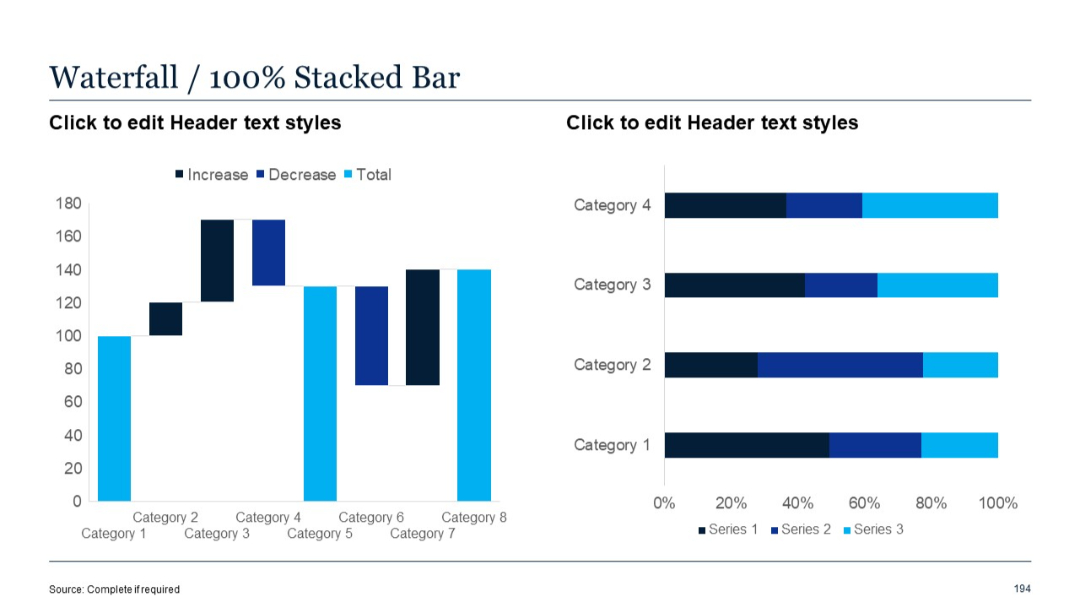
PRO
Left side: waterfall; Right side: 100% stacked bar chart with uniform length, showing proportions.
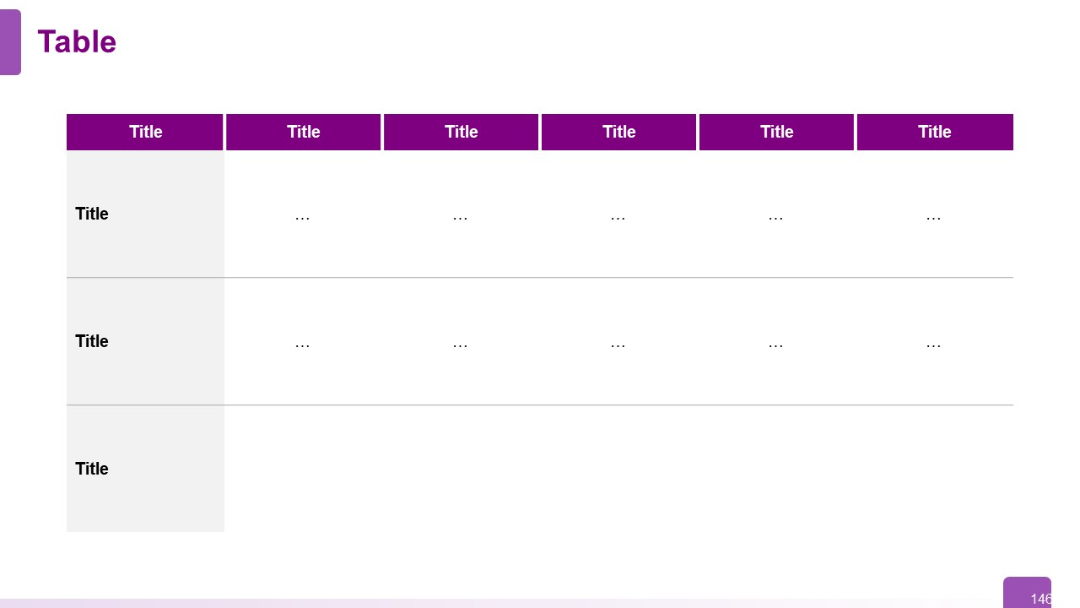
PRO
Three-row, six-column table; purple header row and leftmost column. Clean, grid layout with muted tones and minimal text.
PRO
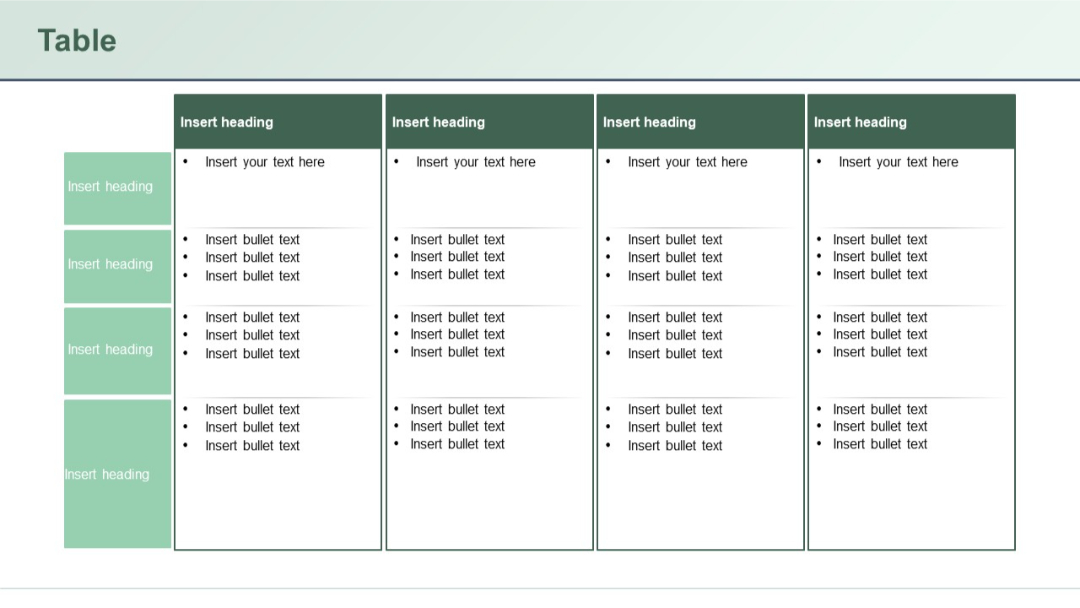
Multi-column table with side headers and top headers. Content areas have bullet lists, likely for detailed task breakdowns or role mapping.
PRO
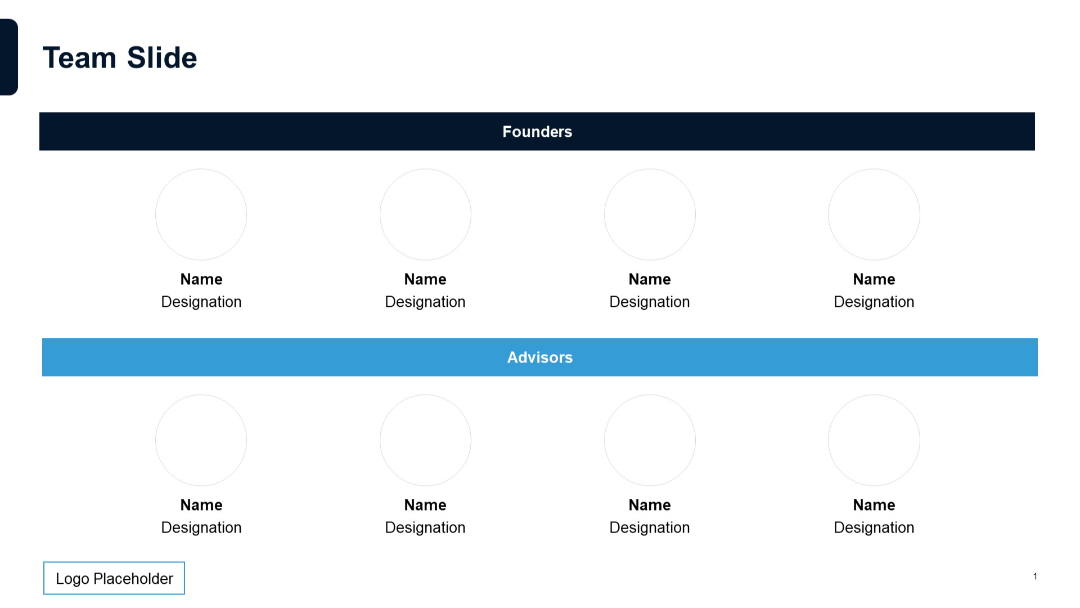
Two-section layout with circular photo placeholders under “Founders” (dark blue bar) and “Advisors” (light blue bar); minimalist and clean design.
PRO
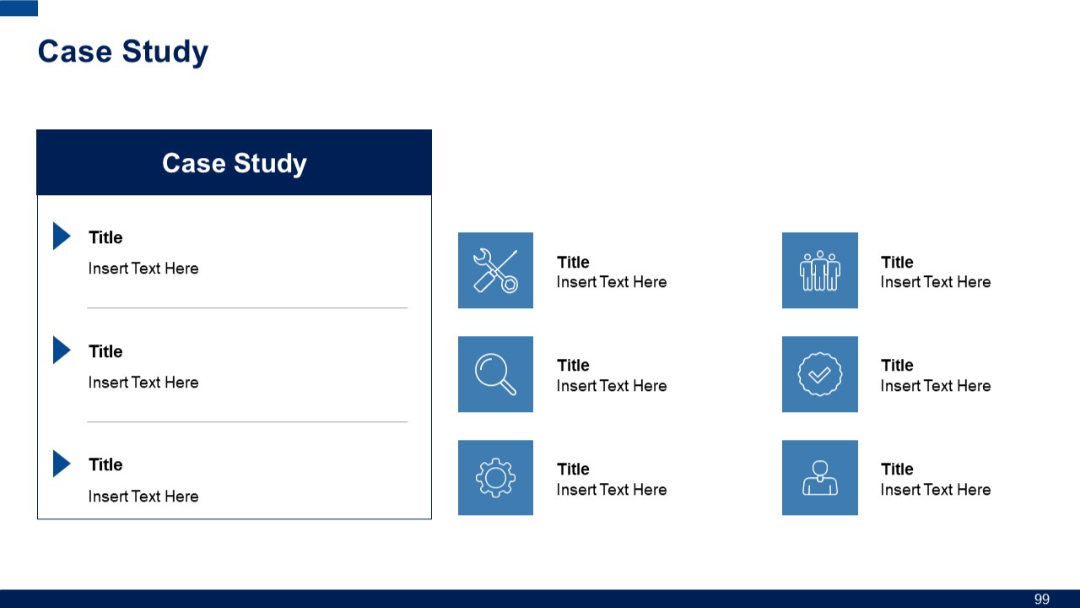
Slide divided into two parts: left side with vertical step list, right with six small icons and titles; uses contrasting blue tones for clarity.
PRO
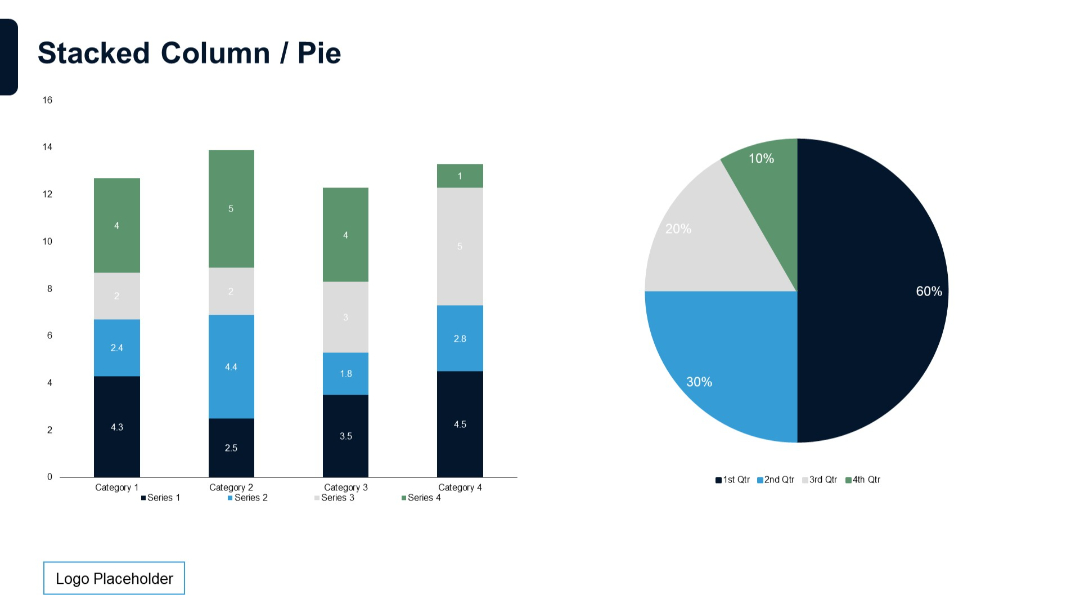
Left side features a multi-series stacked column chart; right side contains a matching pie chart.
PRO
Three horizontal rows with left-side colored circular labels (Items 1–3) and two-column text boxes
PRO
Vertical checklist layout with numbered steps (01–04); each step has a corresponding color-coded box and short text row beside it.
PRO
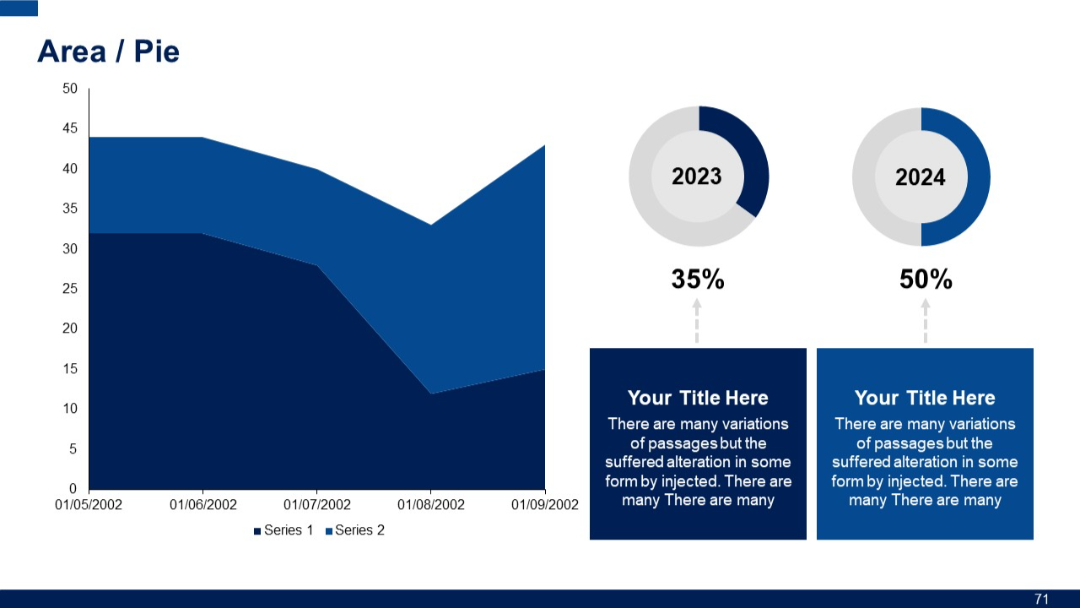
Split layout with an area chart on the left and two donut pie charts on the right. Includes captions below the charts with placeholder text.
PRO
Circular radial layout with 8 headers surrounding a central 8-point star; each header includes an icon and editable text section.
PRO
Two-column vertical timeline layout with circular red icons on either side of a central dividing line, each tied to time slots and placeholder text.

PRO
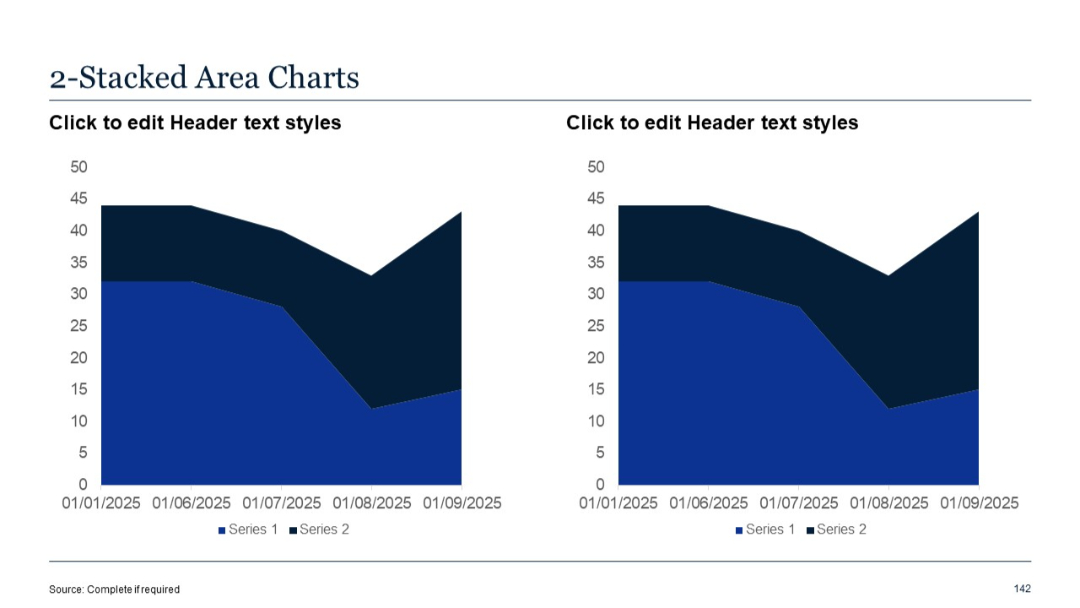
Two similar stacked area charts placed side-by-side. Clean layout with consistent date axes and legends for easy comparison.
PRO
3D pyramid-style staircase with 5 colored layers labeled Step 1 to Step 5, text lines to the left for each step.

PRO
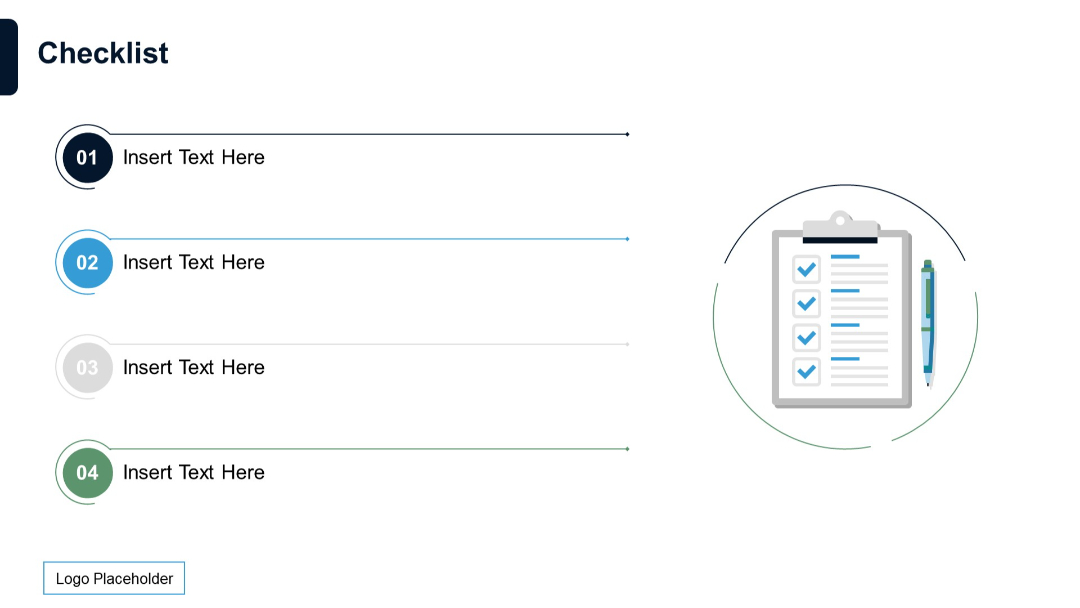
Horizontal checklist with four steps, each represented by a circle number and a colored path leading to a checklist icon. An illustration of a clipboard with a pen is on the right.
PRO
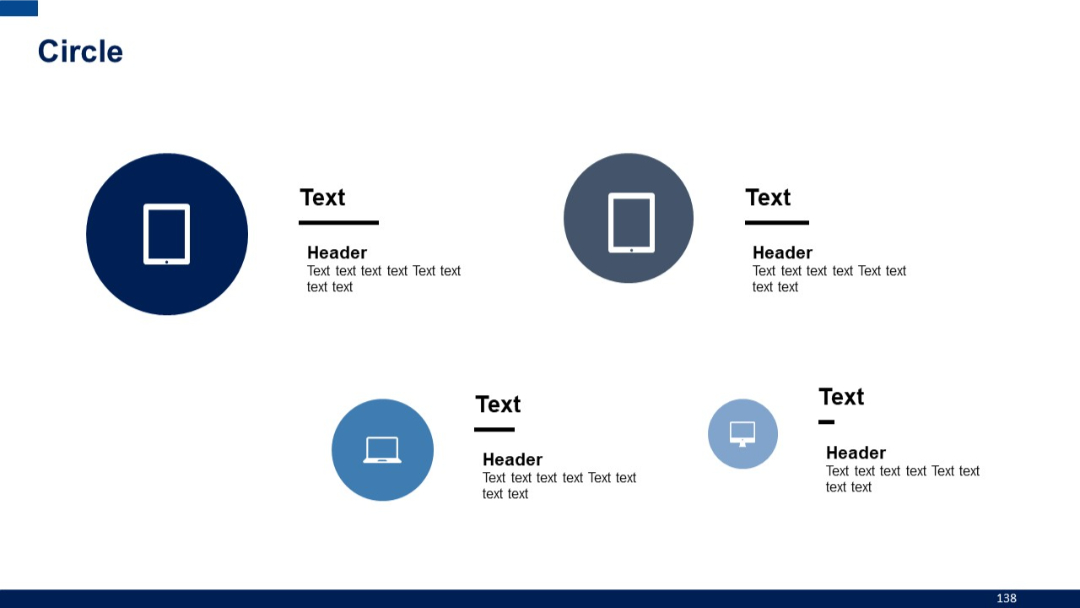
Scattered five-circle layout with icons inside each circle and accompanying short text and headers, asymmetrically placed.
PRO
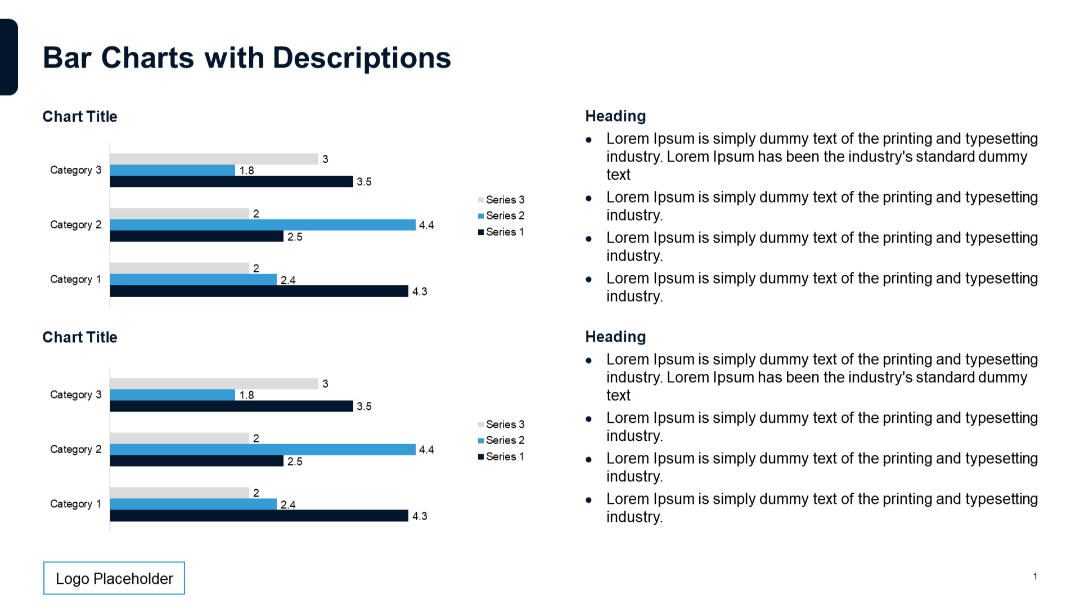
Two bar charts on left with horizontal bars representing three categories. Right side includes grouped bullet point text under section headings.
PRO
Image grid format on a dark background with text blocks and icons highlighting the same focus areas as the previous slide. Centralized description emphasizes visual storytelling of transformation initiatives.

PRO
Horizontal funnel graphic with two input sections (left) and one output section (right), connected via curved lines and icons. Clean, minimal layout.

PRO
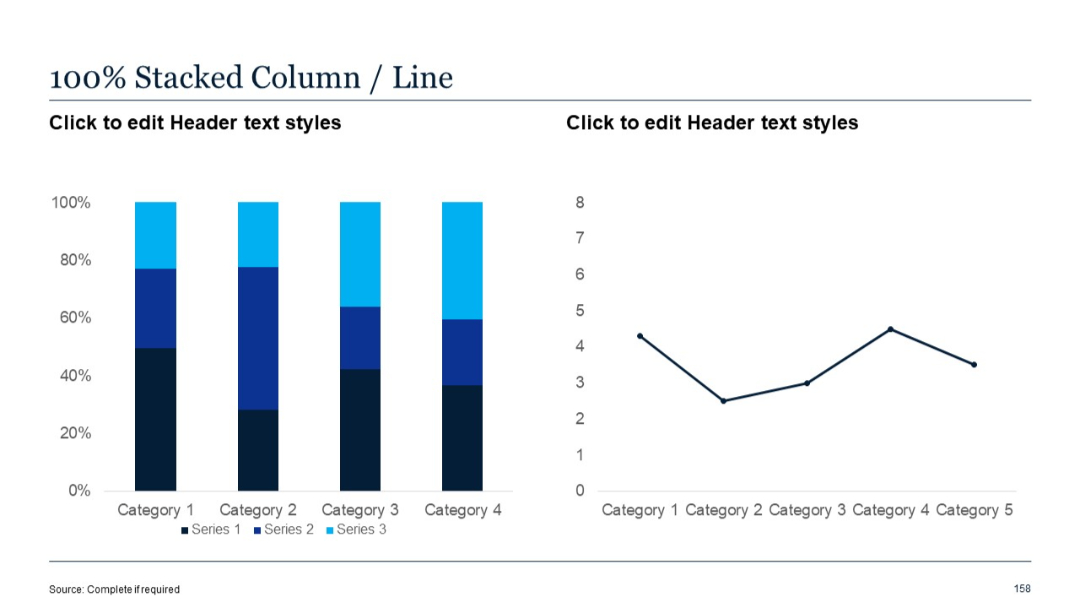
Vertical column chart with 100% stacking on the left and a line chart on the right. Left uses percentage scale.
PRO
Grid of line-style icons related to education, training, communication, evaluation, and teamwork.
PRO
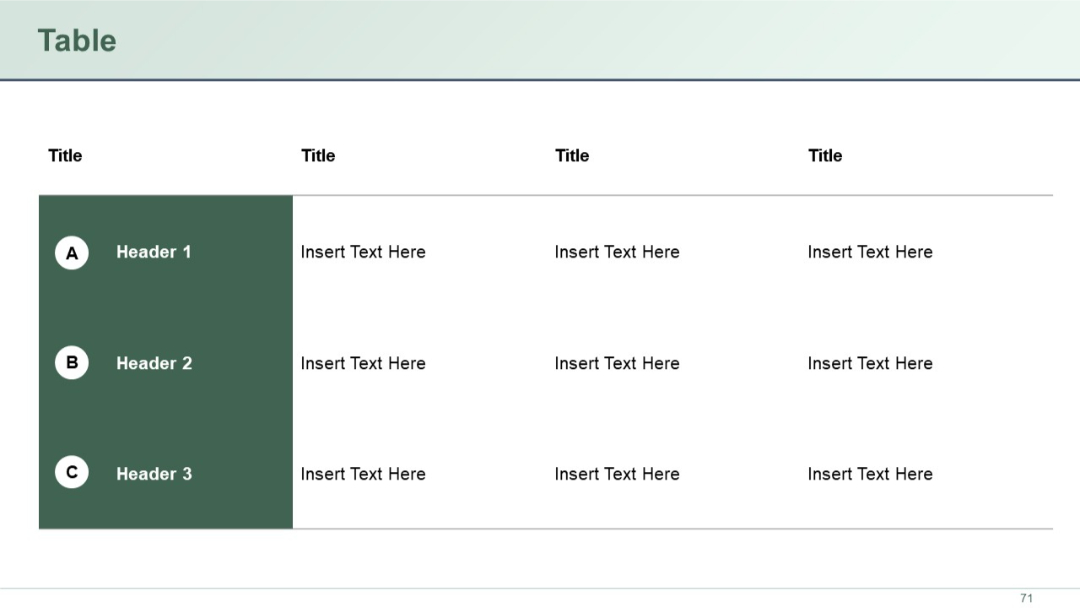
A clean 4-column by 4-row table with the first column highlighted in dark green and labeled with circular A, B, and C icons. Remaining columns have placeholder text.
PRO
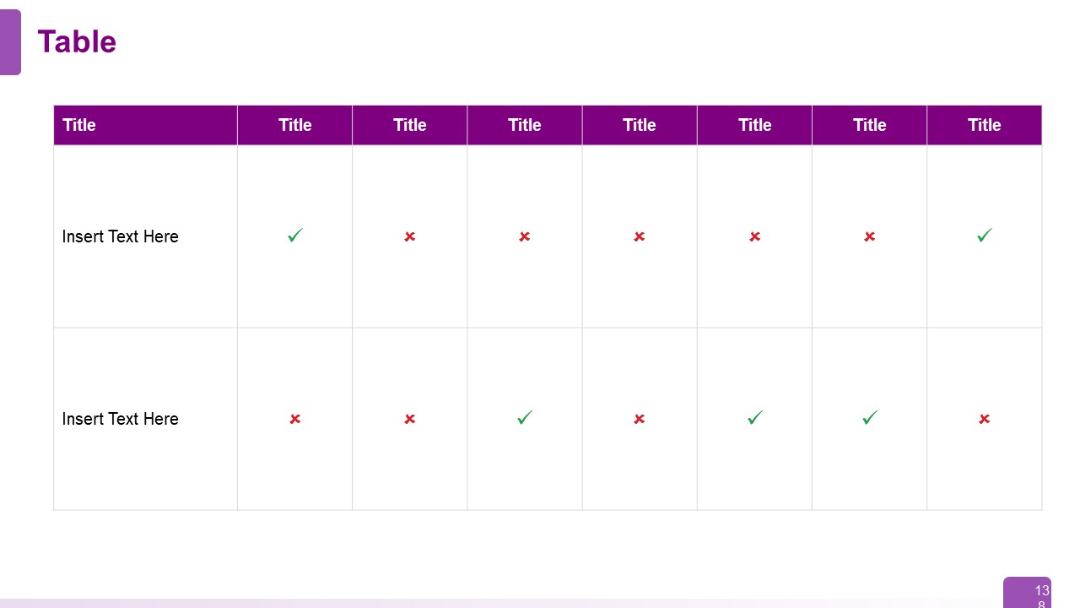
Horizontal table with checkmarks (green) and crosses (red) as indicators across columns. Designed for feature comparison or capability matrix.
PRO
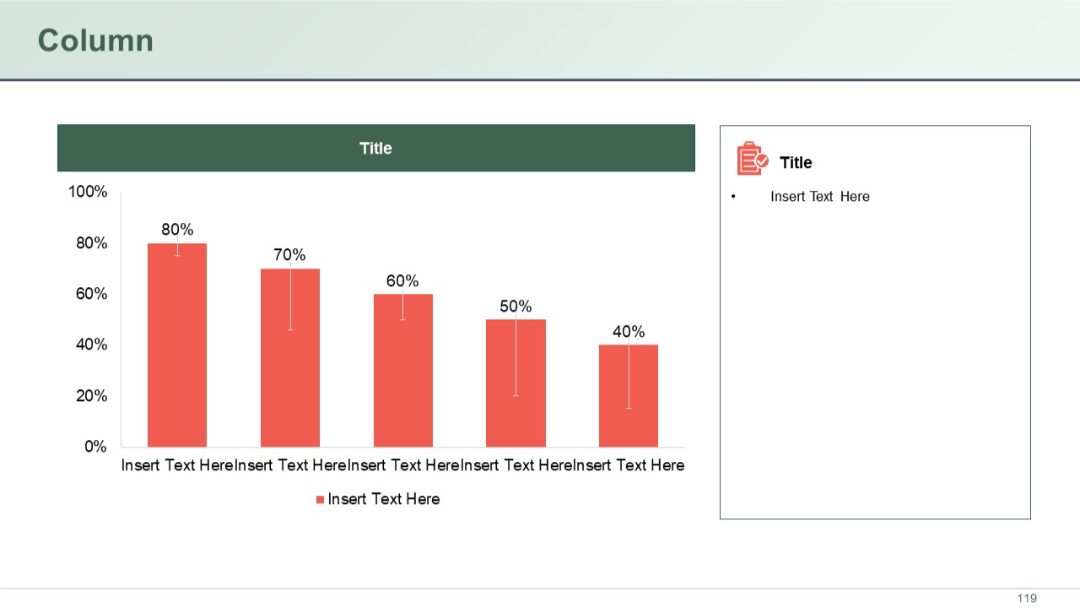
Five red vertical bars showing percentage values with error bars. A sidebar includes a section title and bullet text placeholder with an icon.
PRO
Simple title slide with large number "01" and text underneath, minimalistic and clean.

PRO
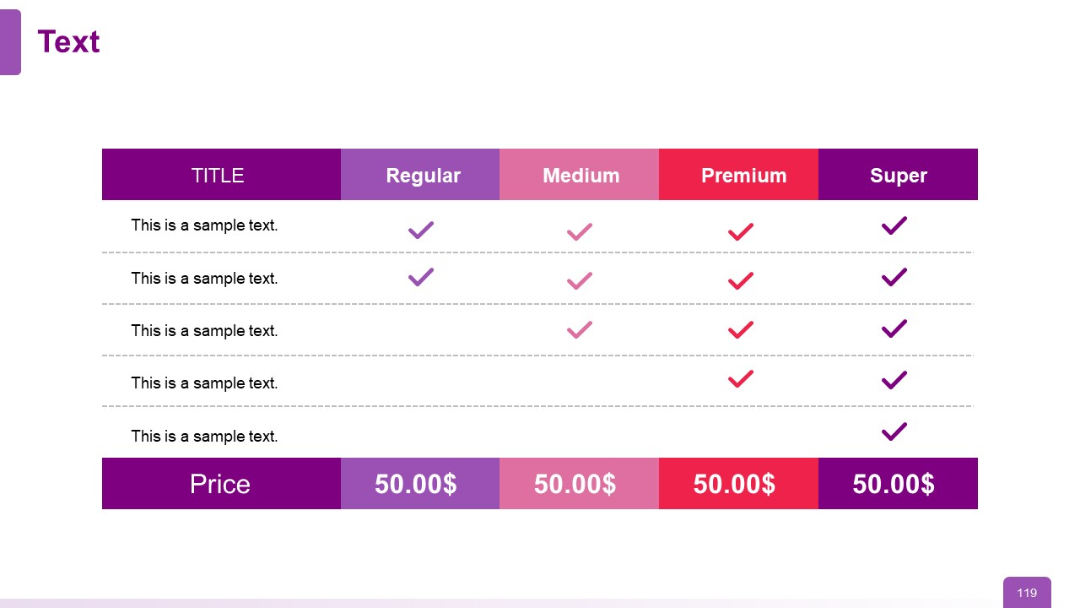
Pricing table comparing Regular, Medium, Premium, Super plans with checkmarks
PRO
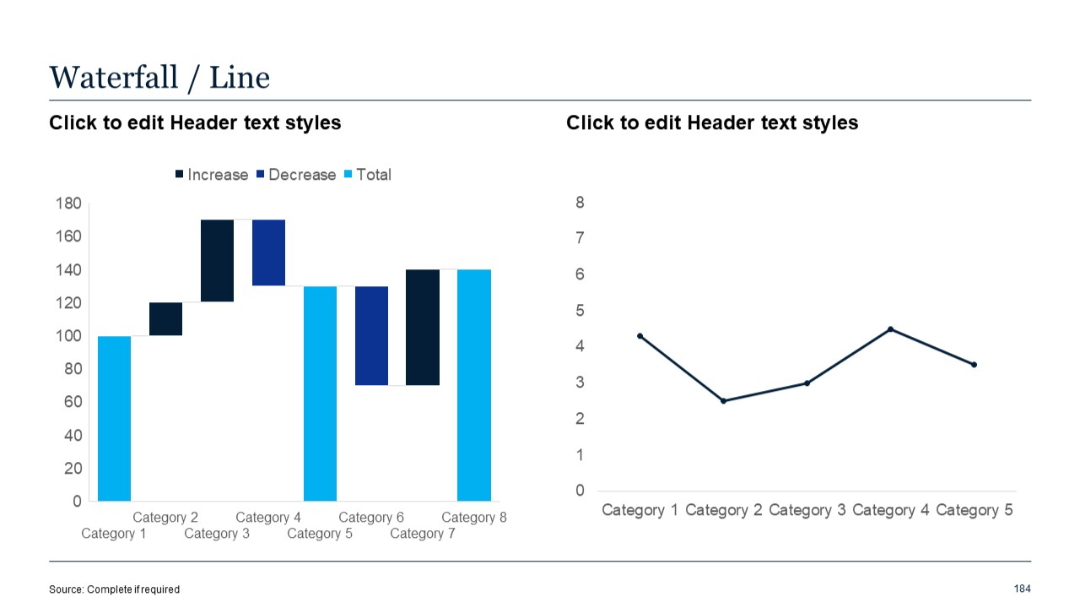
Dual chart format: waterfall chart (left) showing increase/decrease across categories, and single-line chart (right) plotting data trend across categories.
PRO
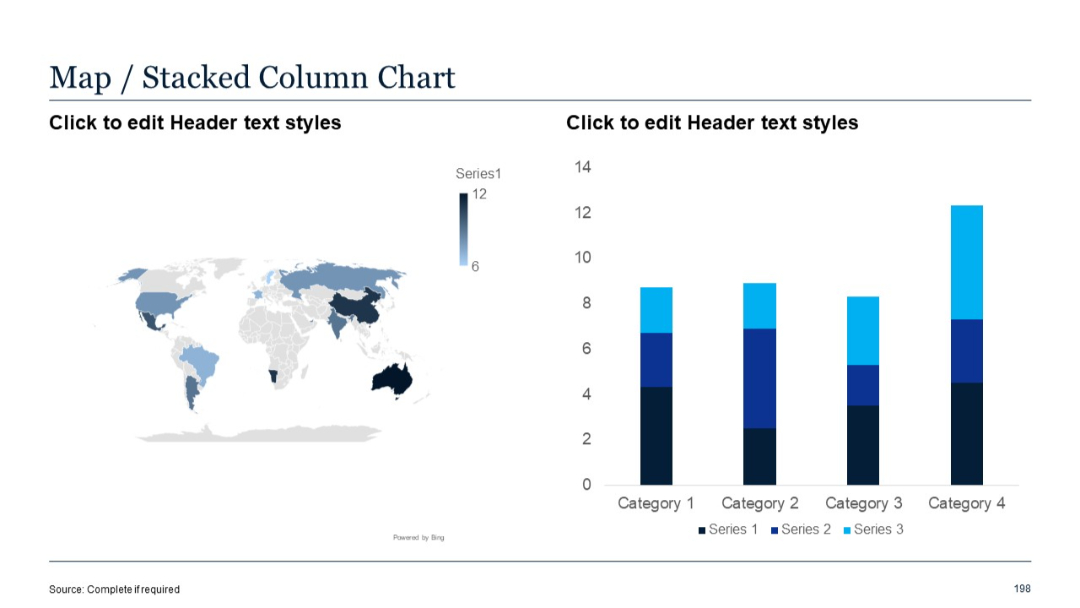
Left: world map; Right: stacked column chart with three series per category.
PRO
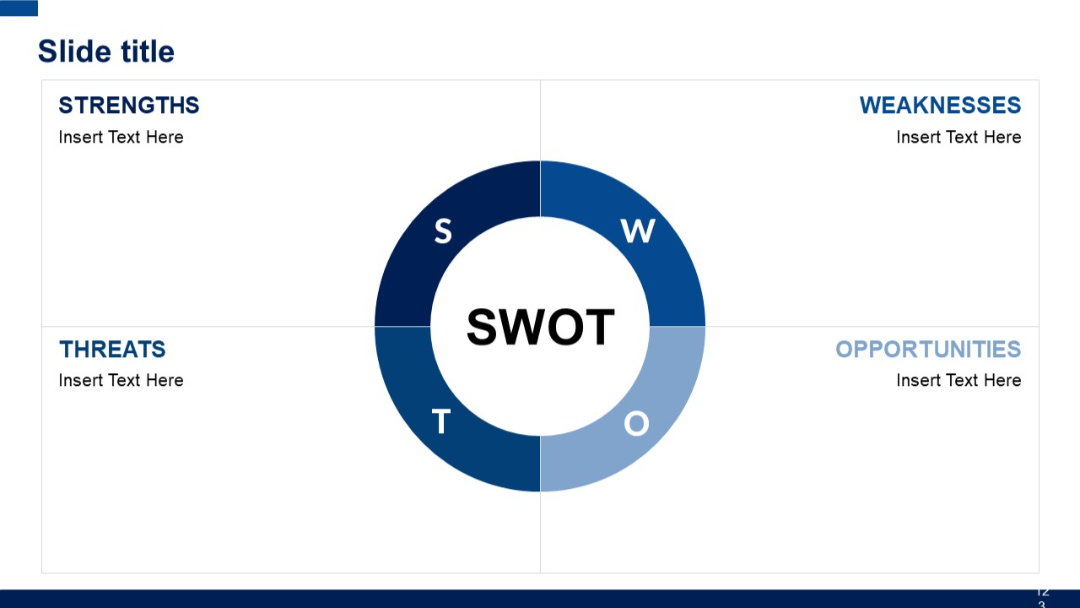
Circular segmented SWOT chart centered in slide with four quadrants labeled Strengths, Weaknesses, Opportunities, and Threats. Balanced layout.
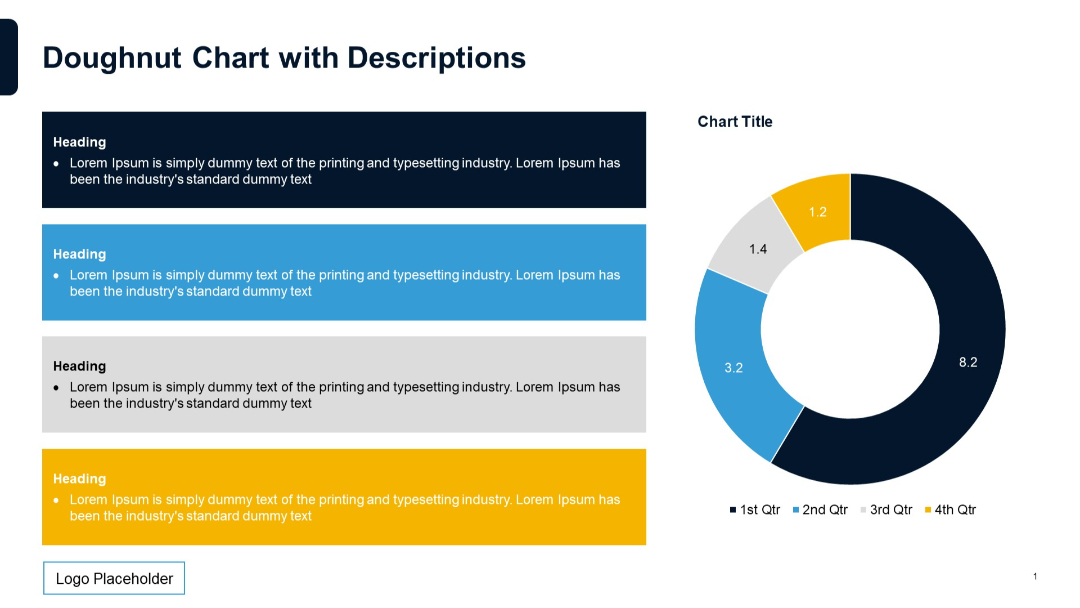
PRO
Left side contains four color-coded description boxes stacked vertically, each with a heading and text. Right side features a doughnut chart.