PRO
Four large gear icons arranged horizontally. Each gear is a different color and contains a header and description below.
PRO
3D segmented sphere (cross-section view) with four layered parts. Each layer corresponds to a labeled header and description outside the sphere.
PRO
A 2x2 grid of interlocking puzzle pieces in bold colors (red, orange, yellow, blue) representing SWOT components with sample text placeholders.

PRO
A spiral arrow graphic with four colored arrowheads and text areas connected along the path. Dynamic, horizontal flow layout.
PRO
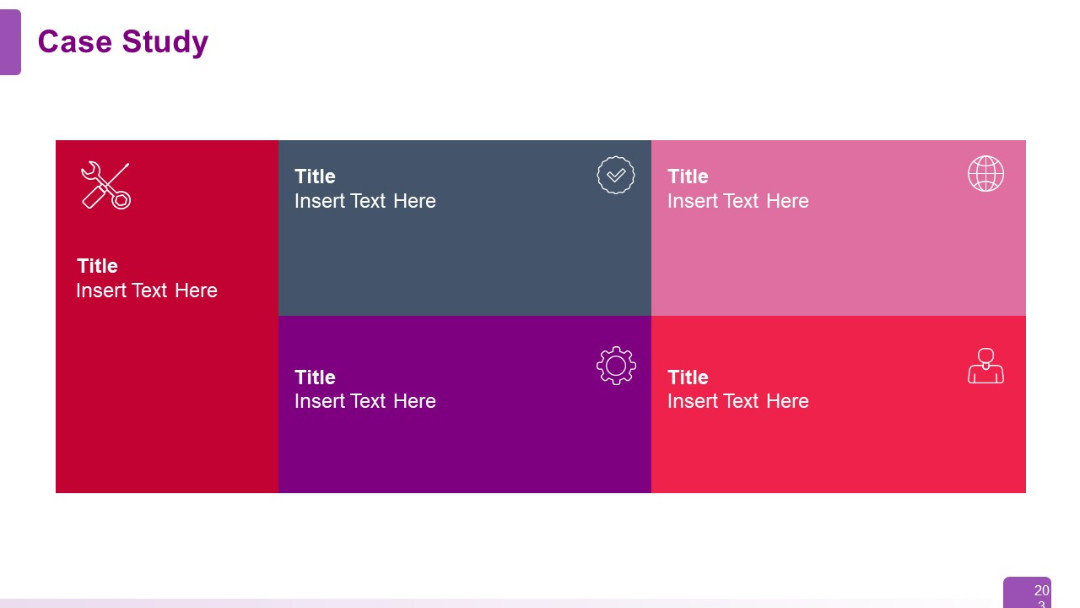
A 2x2 grid with colored blocks (red, dark blue, pink, purple) each containing a title, icon, and placeholder text, arranged in a colorful, modular layout.
PRO
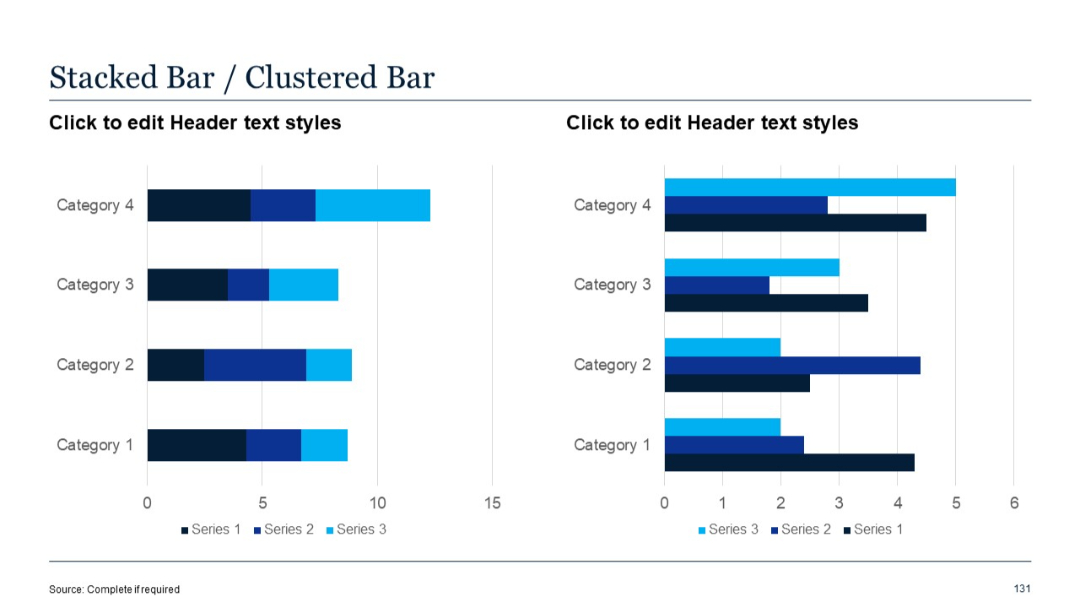
Two horizontally aligned bar charts side-by-side. Left shows stacked bars, right shows clustered bars, both segmented by category and series in blue tones.
PRO
All-white background with faint diagonal lines, no visible content except slide number.

PRO
Very minimalistic; two text blocks placed side by side on a blank white background, each with a subtitle and placeholder.
PRO
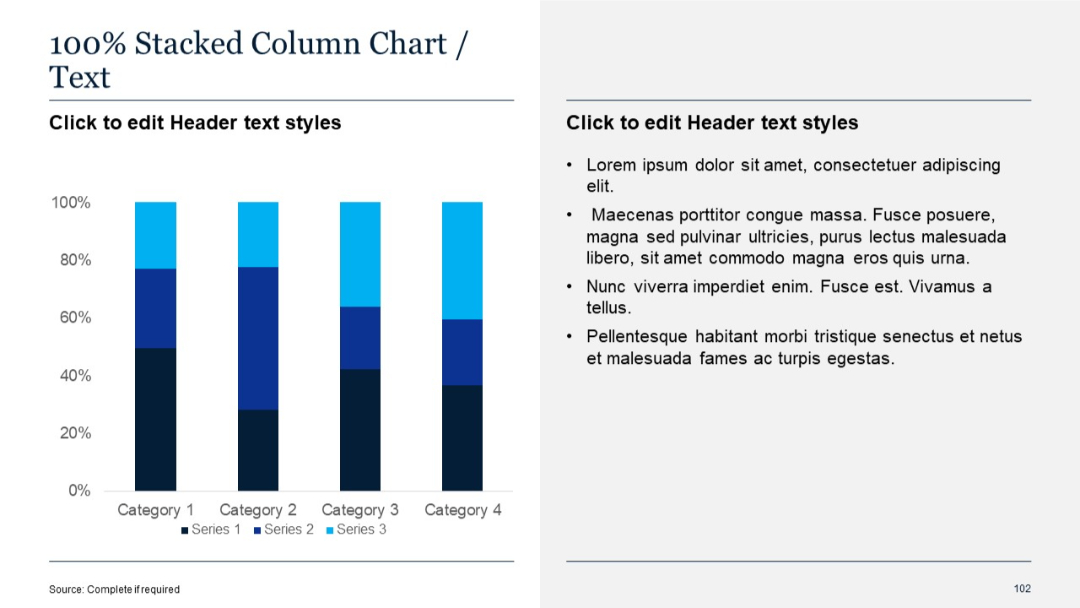
Two-column layout; left side has a 100% stacked column chart, right side contains bullet point text.
PRO
Four horizontal rounded-corner text blocks layered over a desk-themed background.
PRO
Two-column split layout with wide top headers and large text-entry areas below. Each section has a bold header, underlined subheading, and a central content space.

PRO
Four-layered pyramid layout, each section labeled “25%” with aligned text to the right. Clean, minimal design with flat colors.

PRO
Three-column layout with bold dark header bars; equal spacing; white background; subtitles and italic body text.
PRO
Three vertically aligned rectangular blocks with icons above each, containing headers and bullets. Balanced and icon-supported design.

PRO
Timeline format with large vertical left marker and five horizontal rows of text entries. Purple highlight accent.
PRO
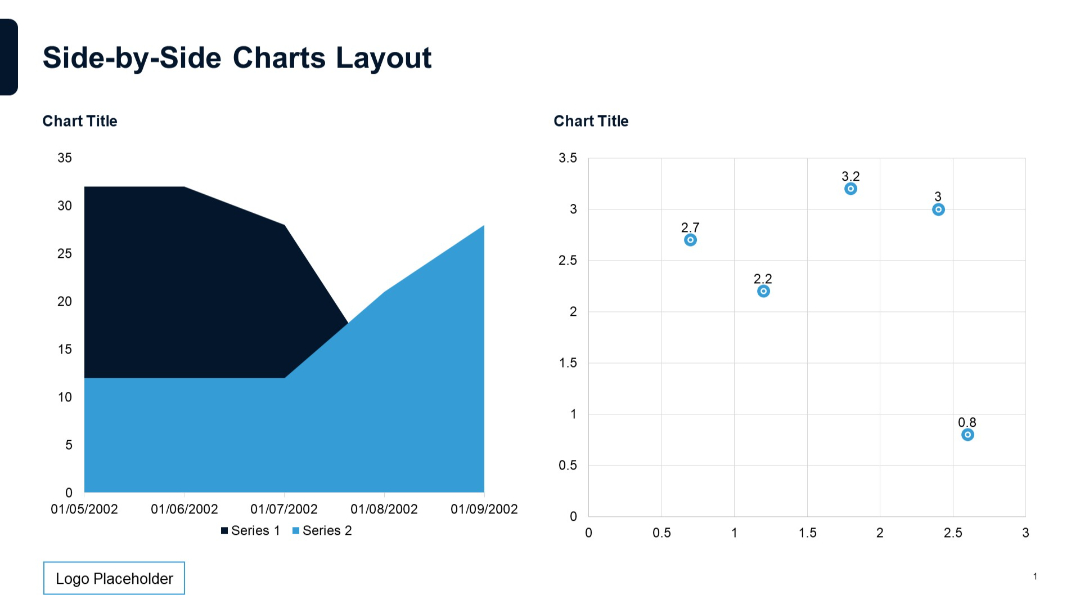
Area chart on the left, scatter plot on the right. Both charts utilize contrasting shapes and color fills for clarity.
PRO
Pie chart on the left, stacked vertical bar chart on the right.

PRO
Minimalist layout with bulleted text and a thick red progress bar on top.
PRO
Two-column vertical list with two headers titled "Title" and checklist items below, each accompanied by a checkmark icon.
PRO
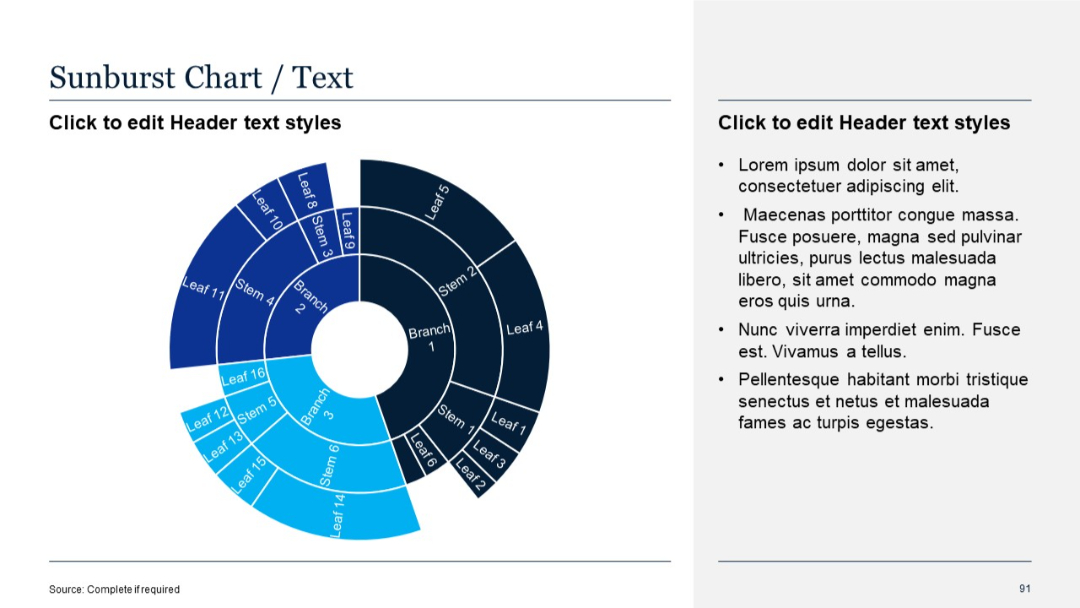
Left side features a multi-layered sunburst chart with branches, stems, and leaves. Right side has bullet text list.
PRO
Icons themed around global access and location (globes, pins, maps, airplane), displayed uniformly.

PRO
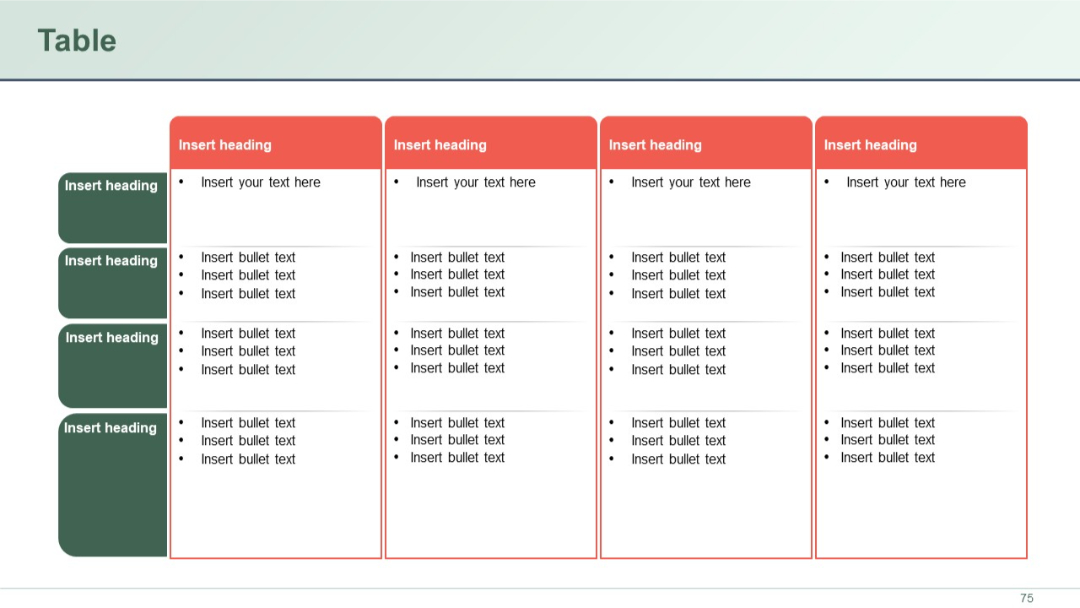
A multi-column and multi-row bullet table. The first column contains rounded headers on a green background; data columns have red borders and white backgrounds.
PRO
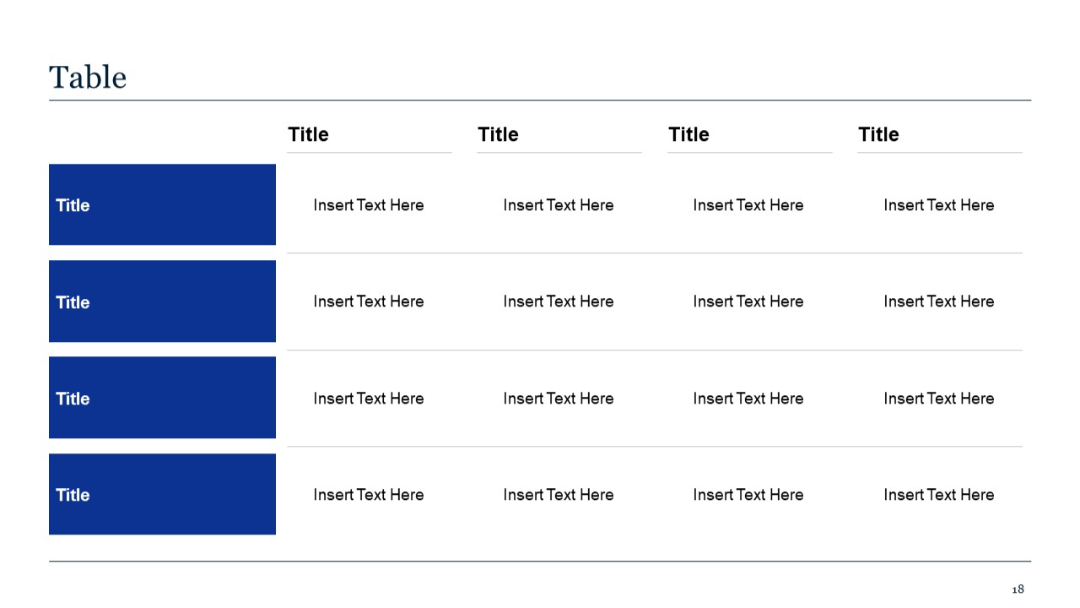
A further expanded version of the previous table layout. Now includes four rows and four columns.
PRO
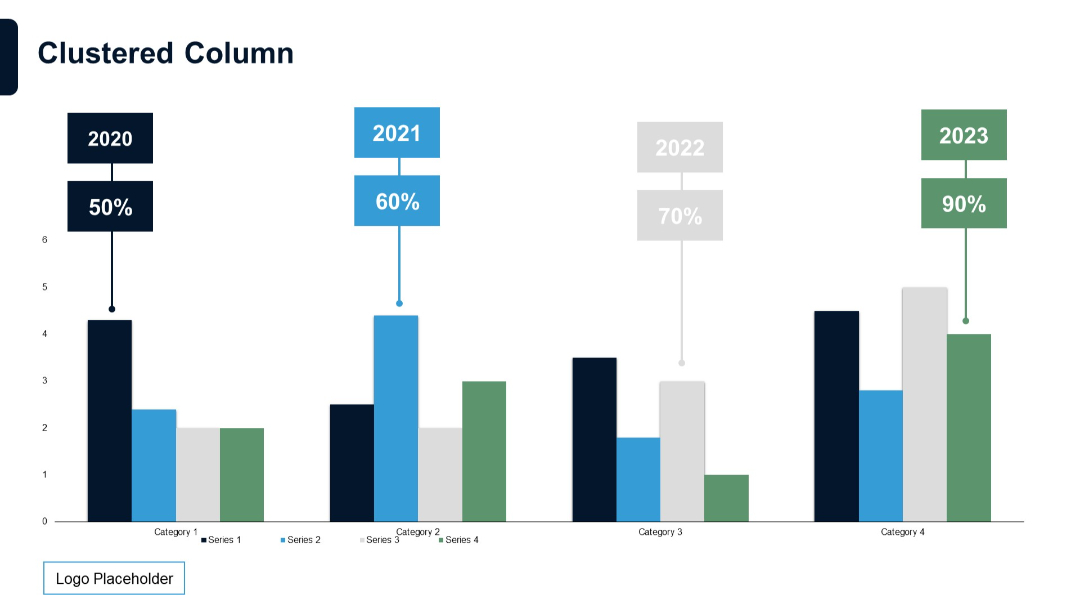
Clustered column chart with bold year and percentage labels above data points. Color-coded series including a fourth series.
PRO
Three-column layout with icons; white background, bold headings in dark blue; subtitle accent with slashes.

PRO
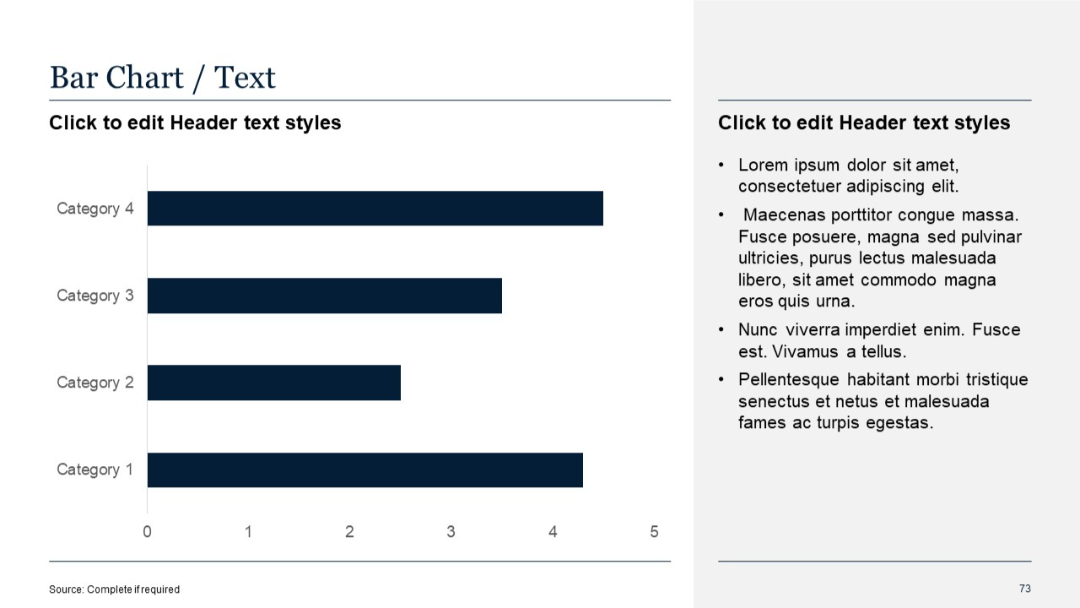
Horizontal bar chart with four categories on the left and a bullet text section on the right. Uniform color for all bars.
PRO
Two-column layout with space for subtitles and text. Large white space, left-aligned text blocks, and minimal design create clarity and flexibility.
PRO
Clean, minimalist design with three white boxes, each labeled 30, 60, or 90 DAY, and an icon of a walking/running figure increasing in speed.
PRO
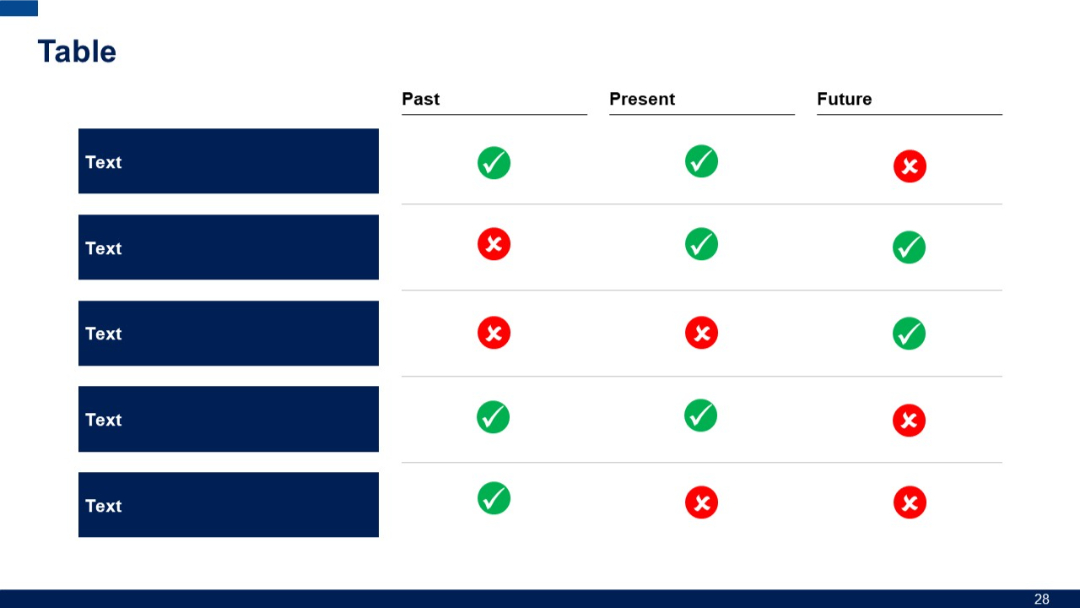
3-column comparison with row headers on the left and top headings labeled "Past", "Present", "Future". Colored check/cross icons used in each cell.
PRO
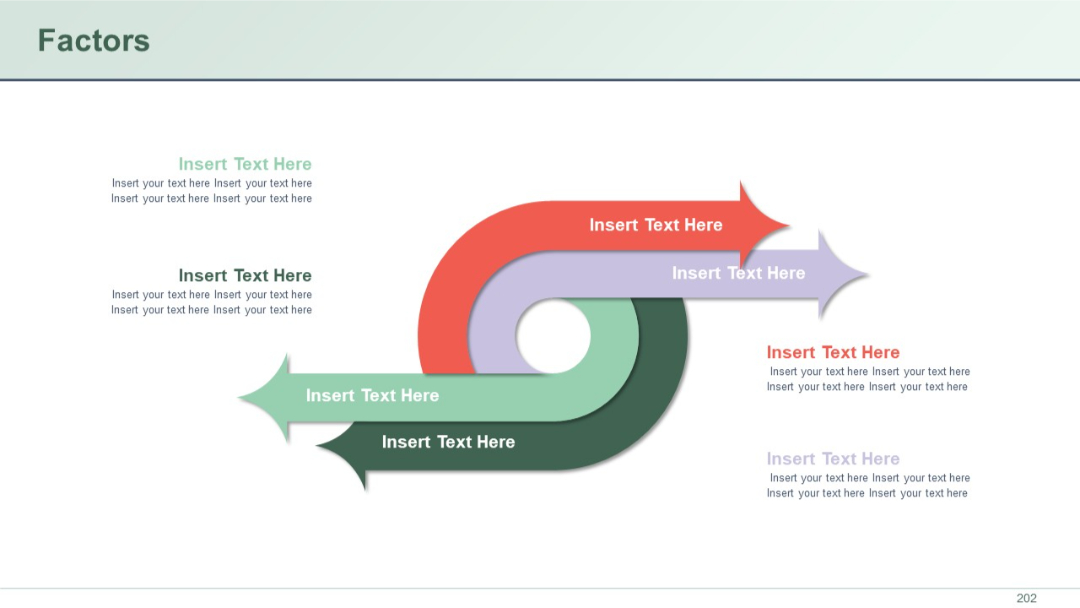
Doughnut chart on the left; 100% stacked horizontal bar chart on the right.