PRO
Starburst layout with seven icons and headers positioned around a star. Icons include thumbs-up, computers, globe, and star.

PRO
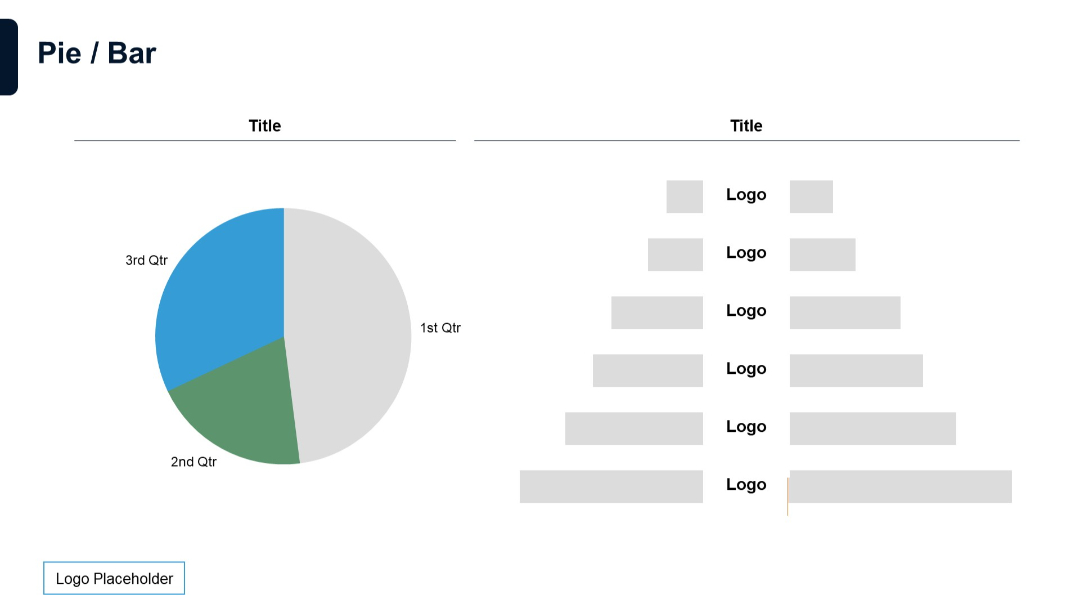
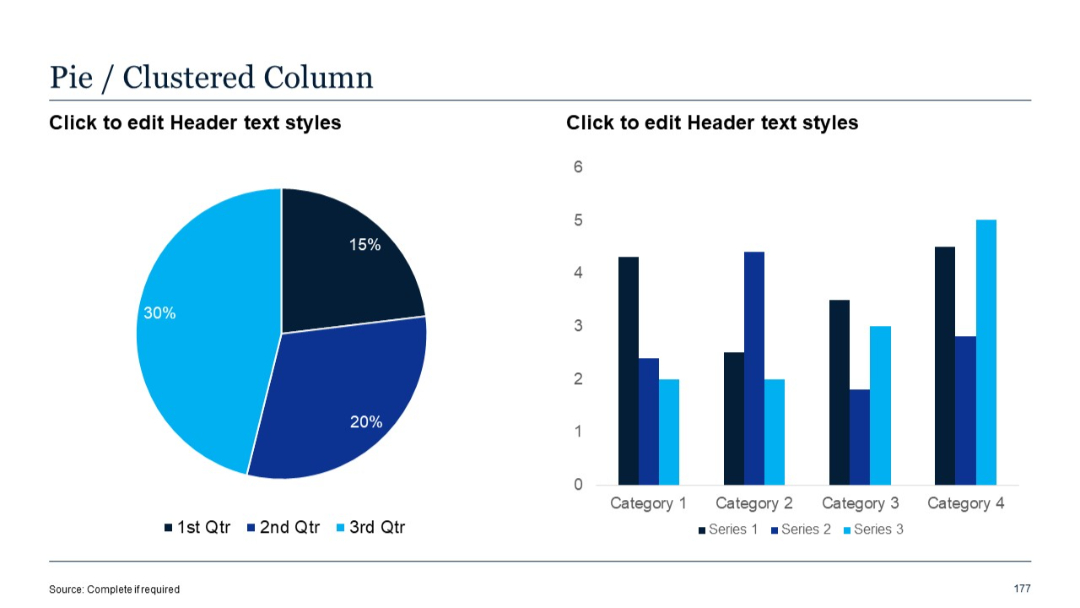
Left side shows a pie chart; right side includes labeled horizontal bars with placeholders.
PRO
Vertical list layout with five sections numbered 1 to 5, each with a bolded title and placeholder text. Color-coded numbering runs alongside the left.
PRO
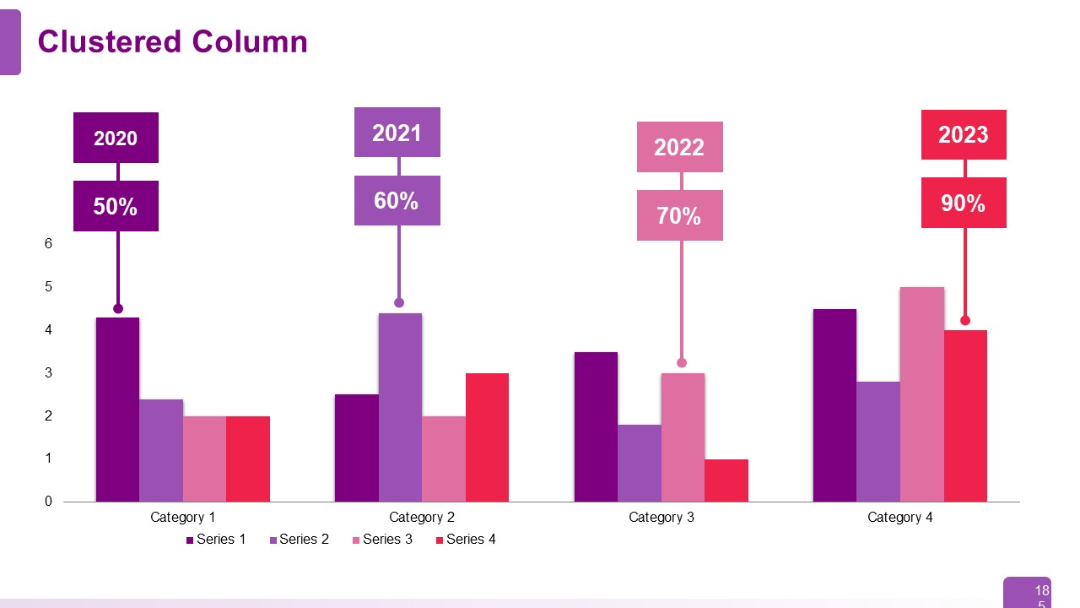
Clustered column chart with labels above each category indicating year (2020–2023) and percentage values. Multi-series with four color bands.
PRO
Rectangular blocks with headers placed on a large horizontal arrow. Bold colors and high contrast. Four-step linear flow design.

PRO
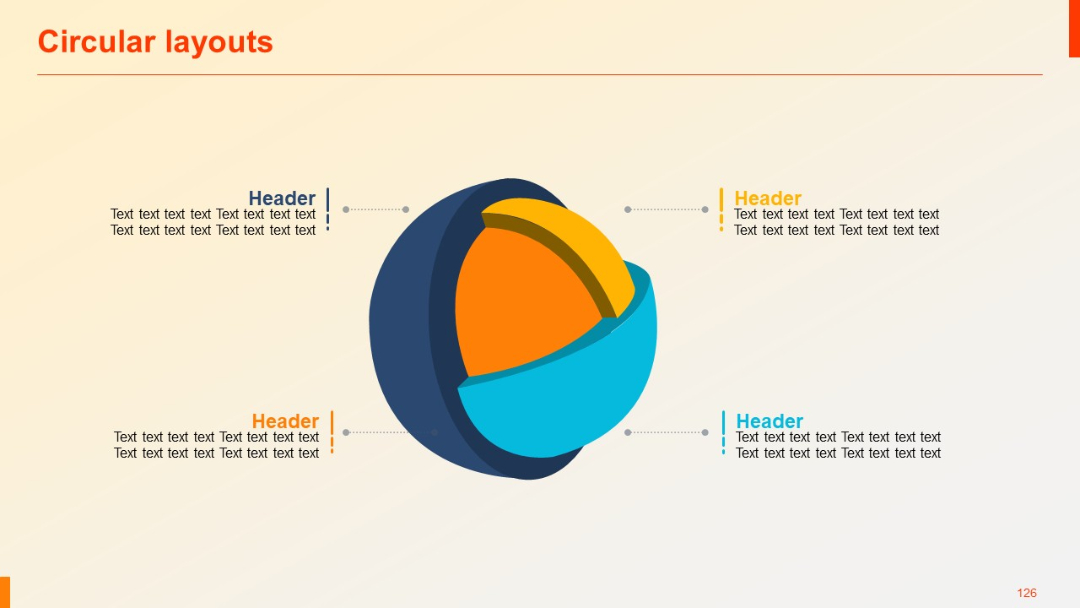
A 3D circular exploded sphere split into four colored segments with dotted lines pointing to headers on both sides.
PRO
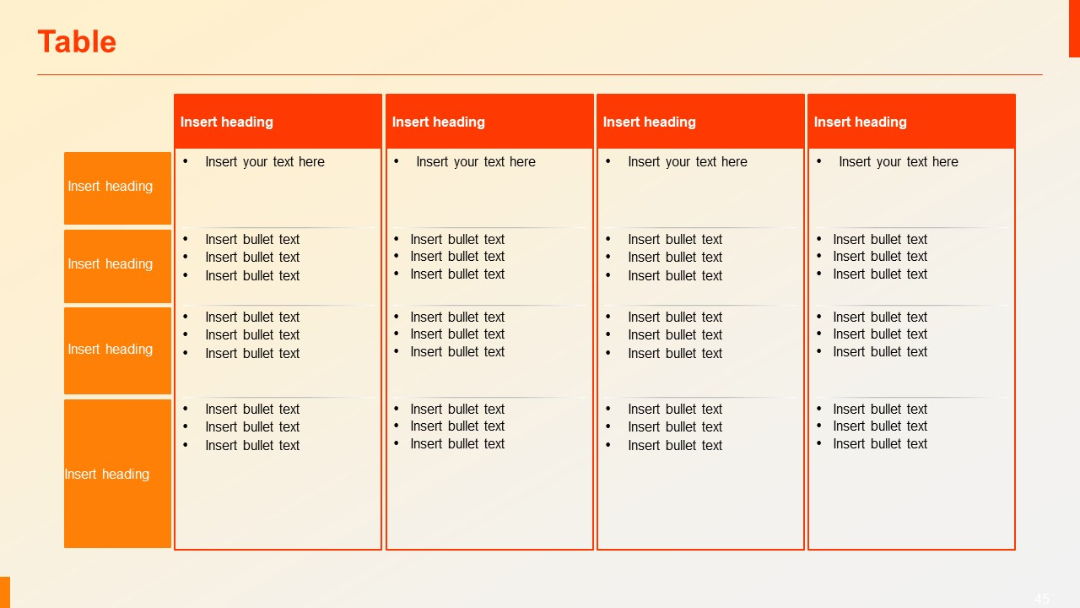
Grid table with vertical side headers and vertical bullet lists in each column. Five columns, four rows. Alternating orange headers.
PRO
Vertical curved line with four circular icons and corresponding text aligned horizontally to the right.

PRO
Grid with four rows; each has a label on the left in a stylized green block and editable text on the right.
PRO
Grid layout with six blocks (01–06), each with a number tab and placeholder text, arranged in two rows.

PRO
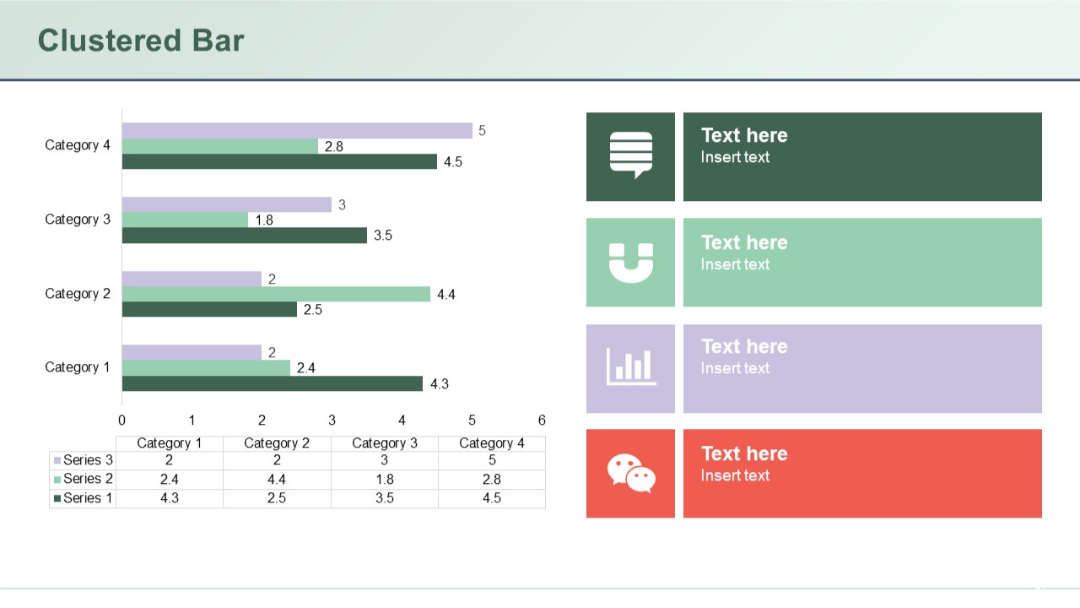
Horizontal clustered bar chart with four categories and three series, accompanied by four icon-labeled text boxes.
PRO
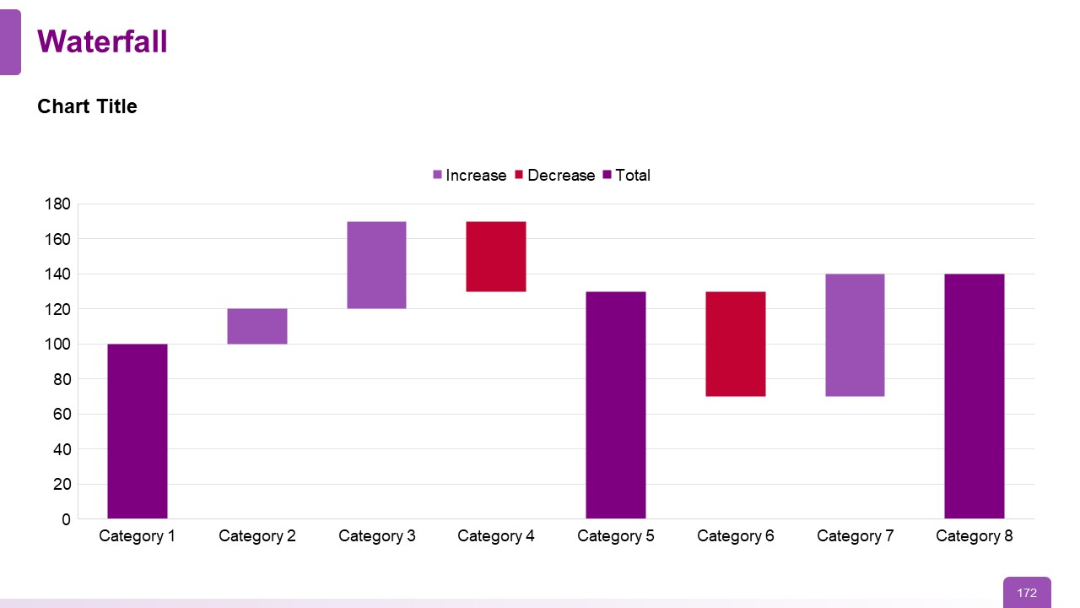
A waterfall chart with bar segments in different colors indicating increase, decrease, and total across eight categories. Minimalistic layout with bold chart bars.
PRO
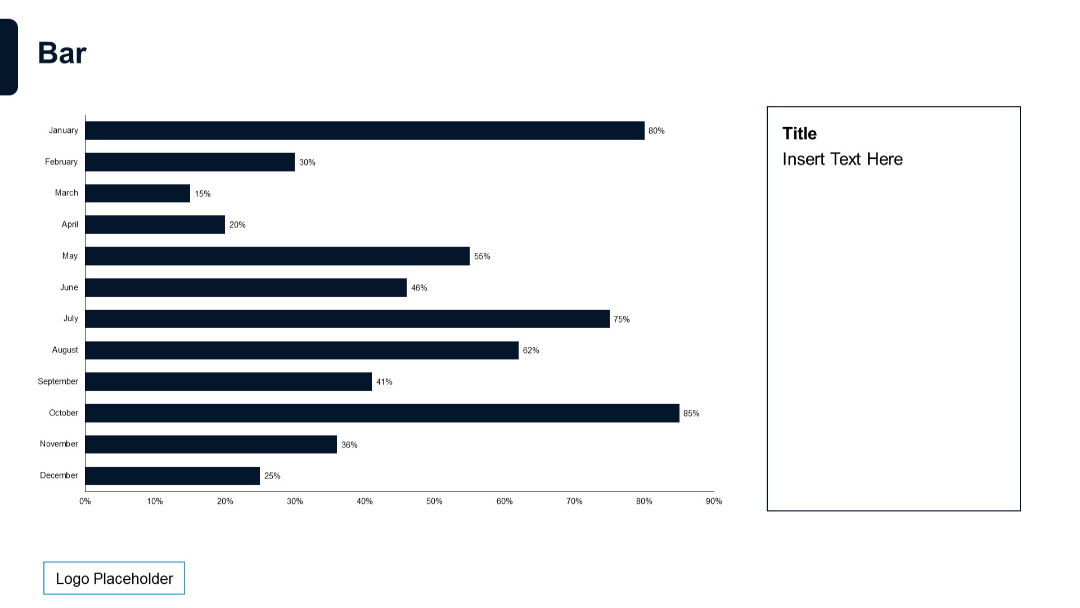
Monthly horizontal bar chart from January to December with percentages on each bar. Right side includes a white box for title and text.
PRO
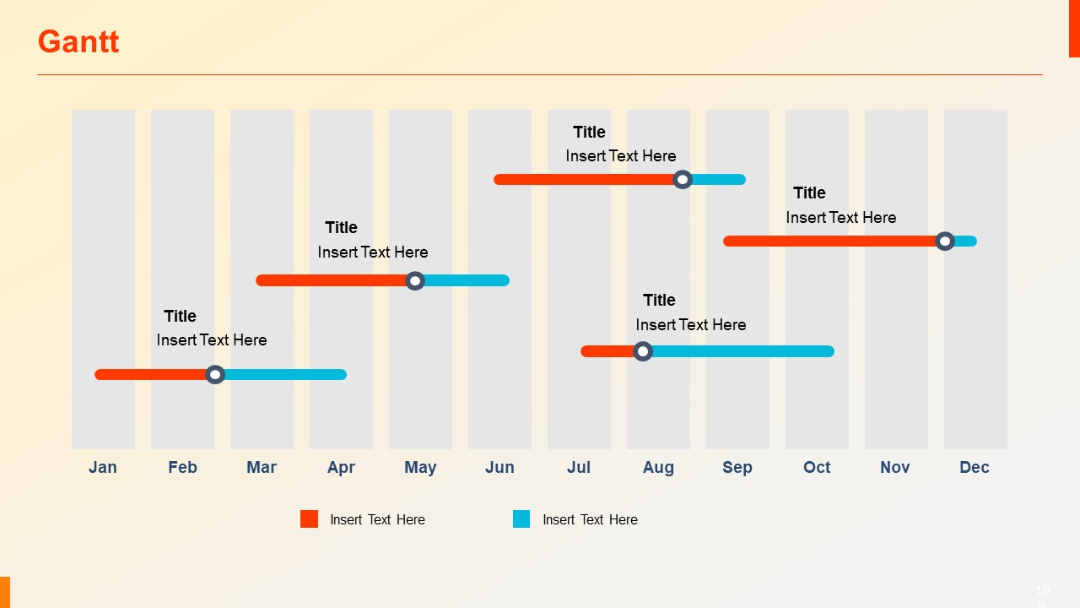
Vertical month-by-month timeline with horizontal bars and circular connectors; includes icons.
PRO
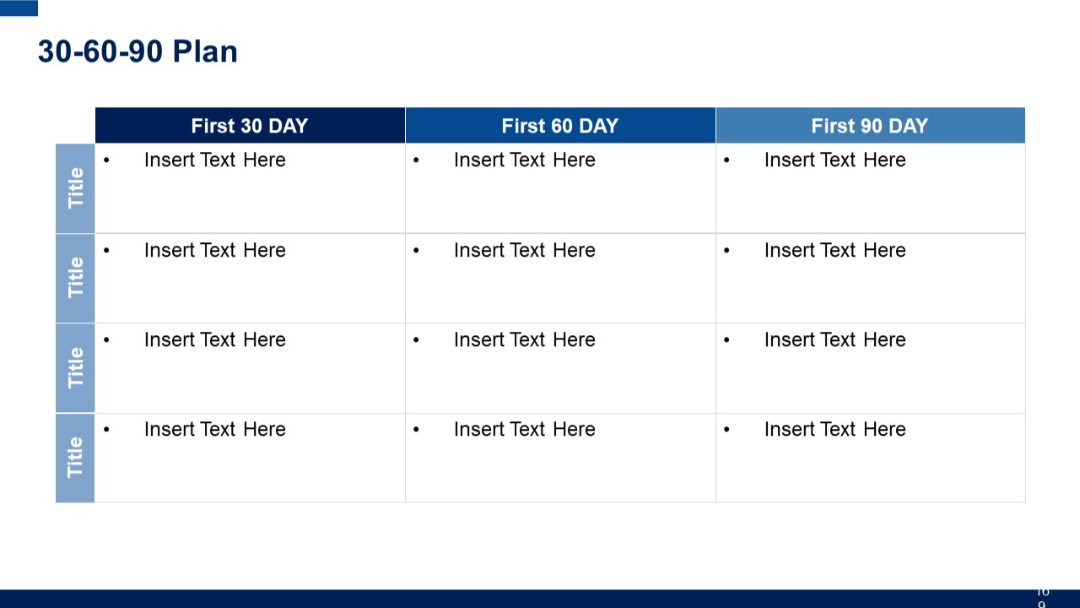
Grid layout with column headers (First 30/60/90 DAY) and row labels ("Title"), forming a matrix to list activities or goals by timeframe.
PRO
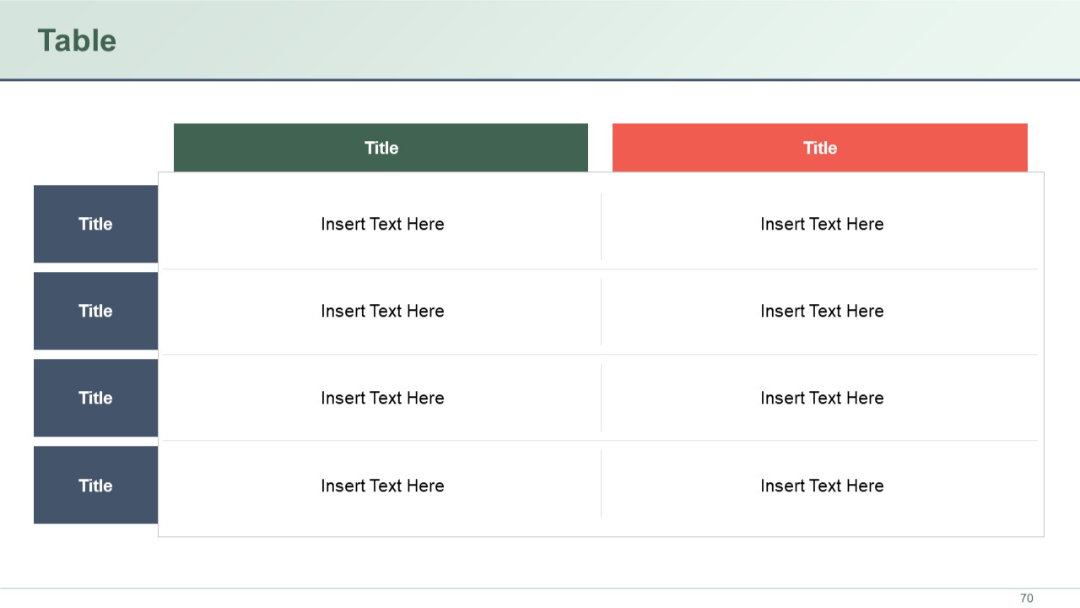
Table layout with dual header columns (green and red) and four rows, each with two descriptive text fields. Blue row headers on the left.
PRO
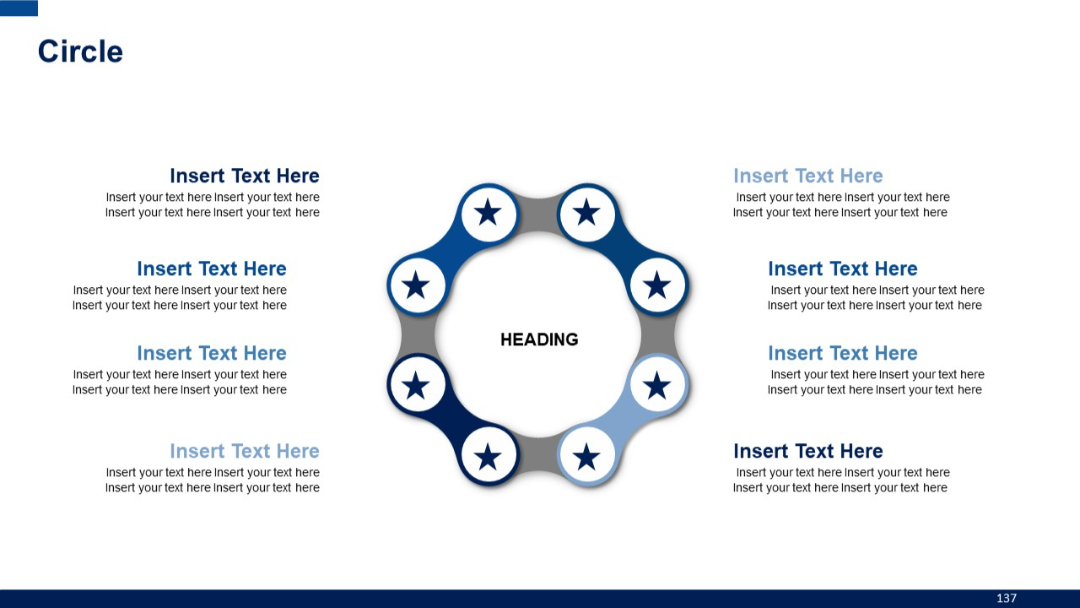
Circular chain-like layout of eight linked star-filled circles around a central heading; text areas surround the graphic.
PRO
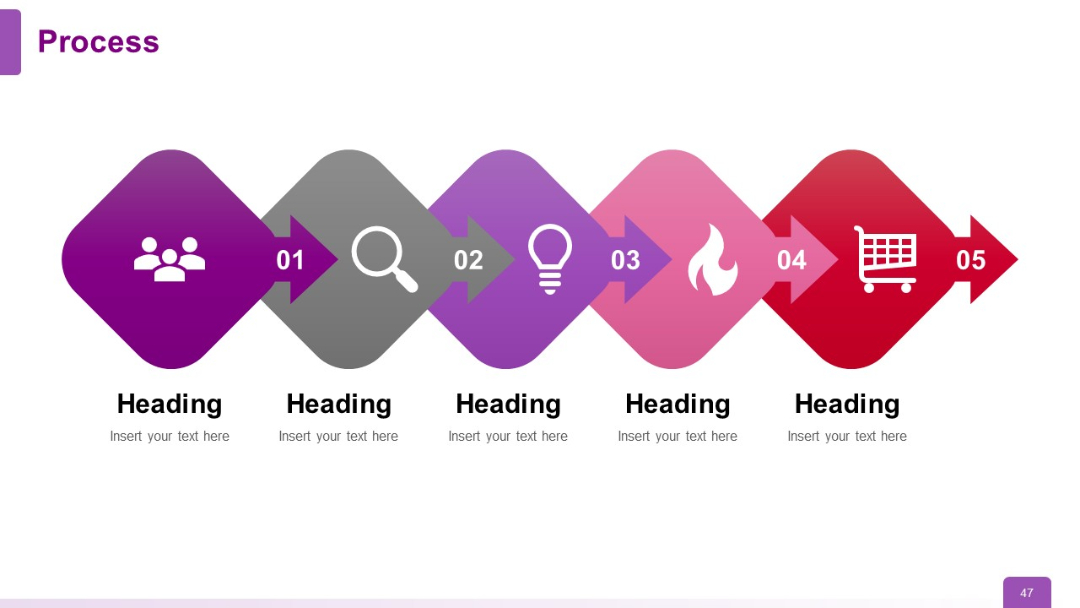
Diagonal zigzag path with five arrows in gradient colors and icons. Each step is numbered and includes a title and space for description text.
PRO
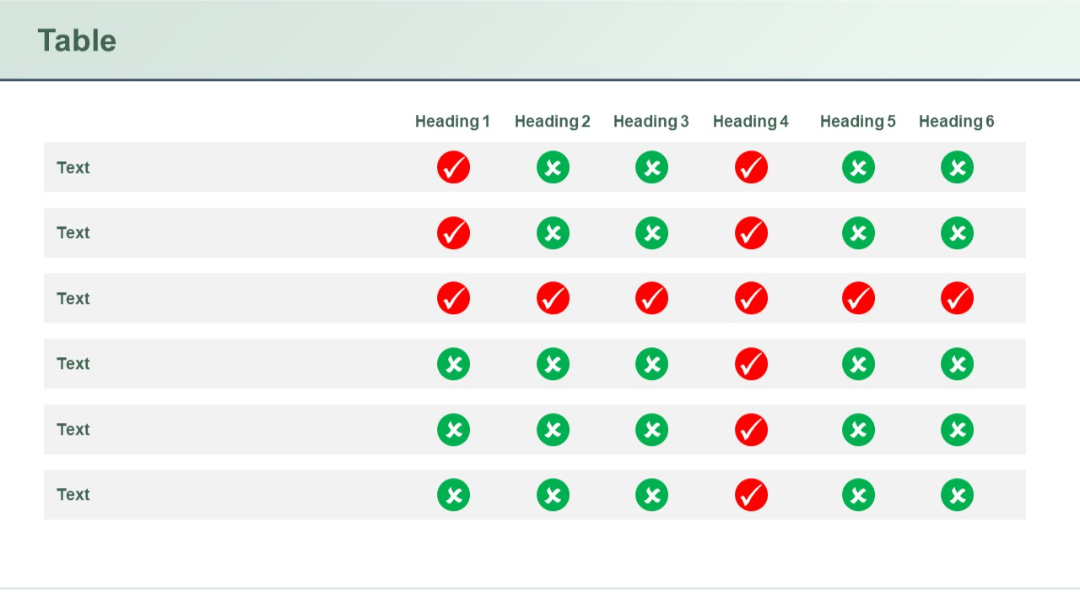
Comparison matrix with colored check/cross icons in a 6-column layout. Clear visual cue system for presence or absence of features.
PRO
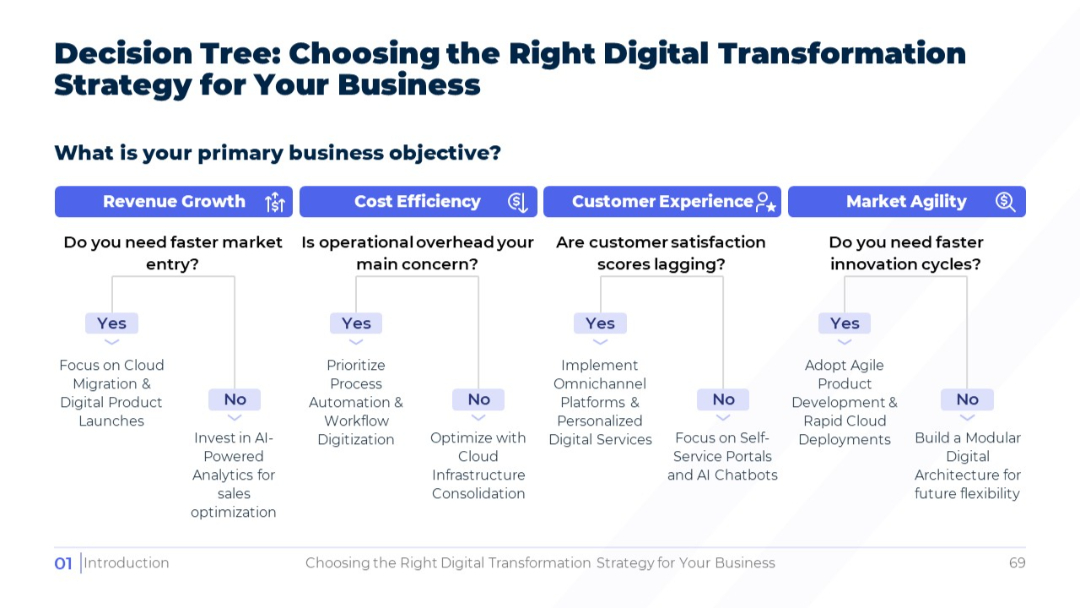
Decision tree layout with four color-coded branches representing business objectives. Each branch leads to yes/no paths and corresponding recommendations.
PRO
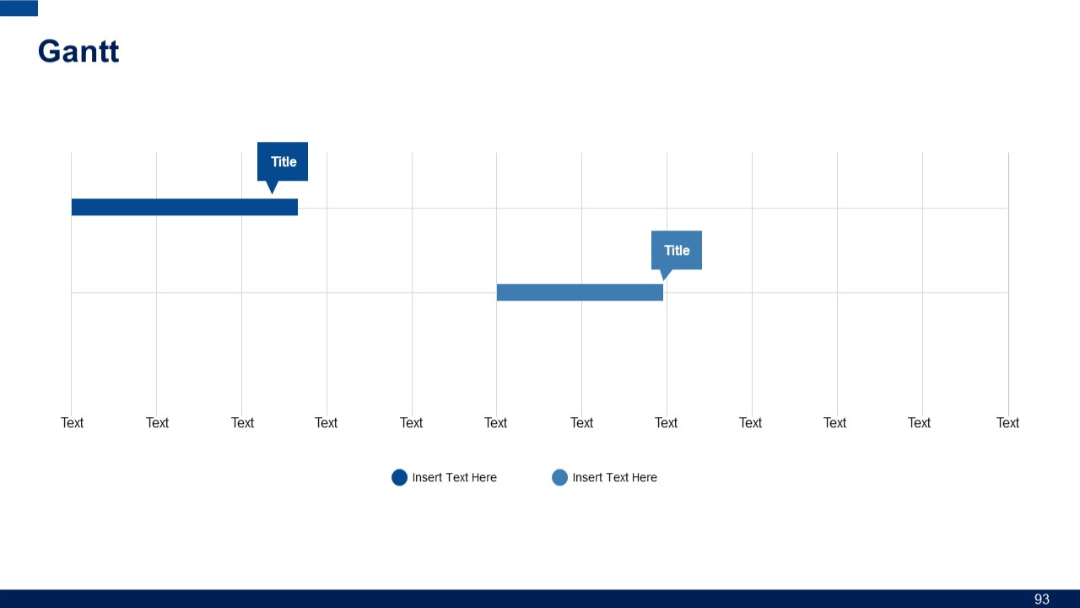
Minimalist Gantt chart with two horizontal task bars, milestone markers, and repeated "Text" labels along the horizontal axis; clean and spacious layout.
PRO
Timeline-based table with “Past,” “Present,” and “Future” columns and left-hand labels in dark green. Icon indicators show status.

PRO
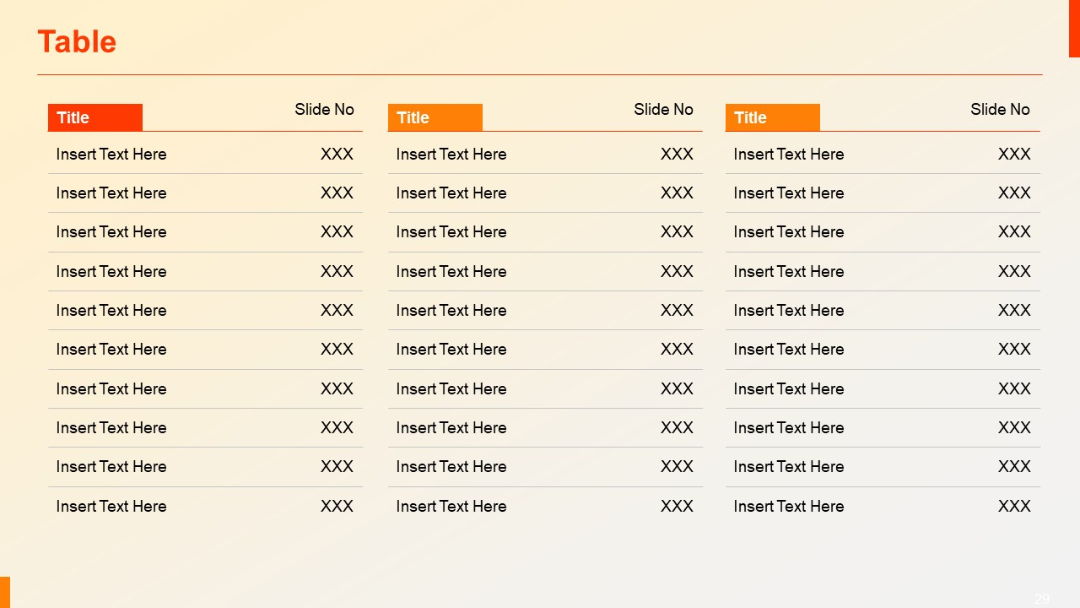
Extended table with three comparison blocks across the slide; each includes a title and multiple content rows with slide numbers for reference.
PRO
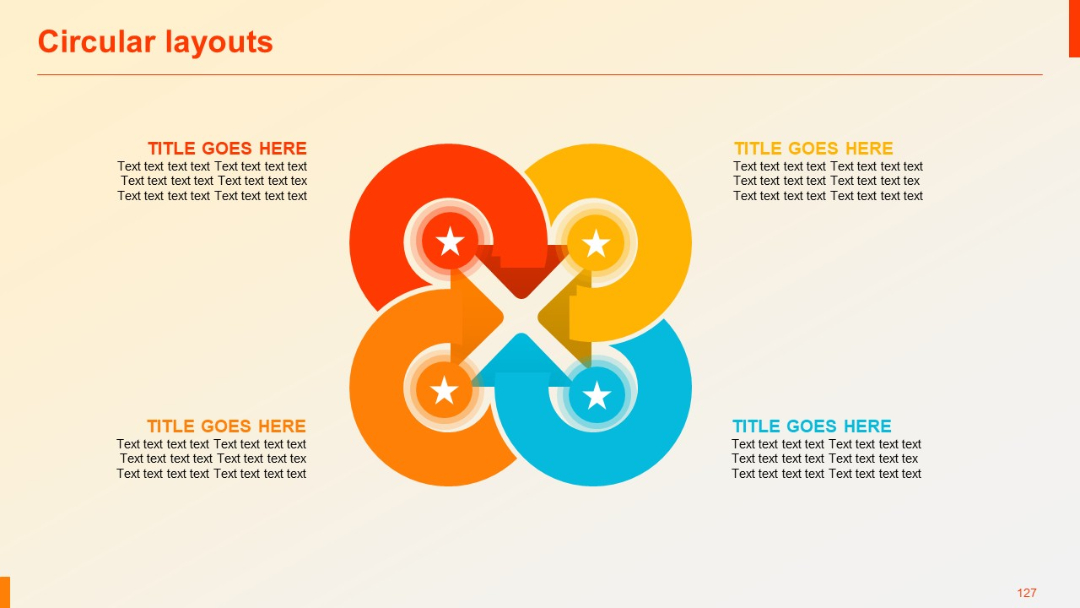
Four circular segments with stars at each point forming an X-shape; each quadrant paired with a header and text.
PRO
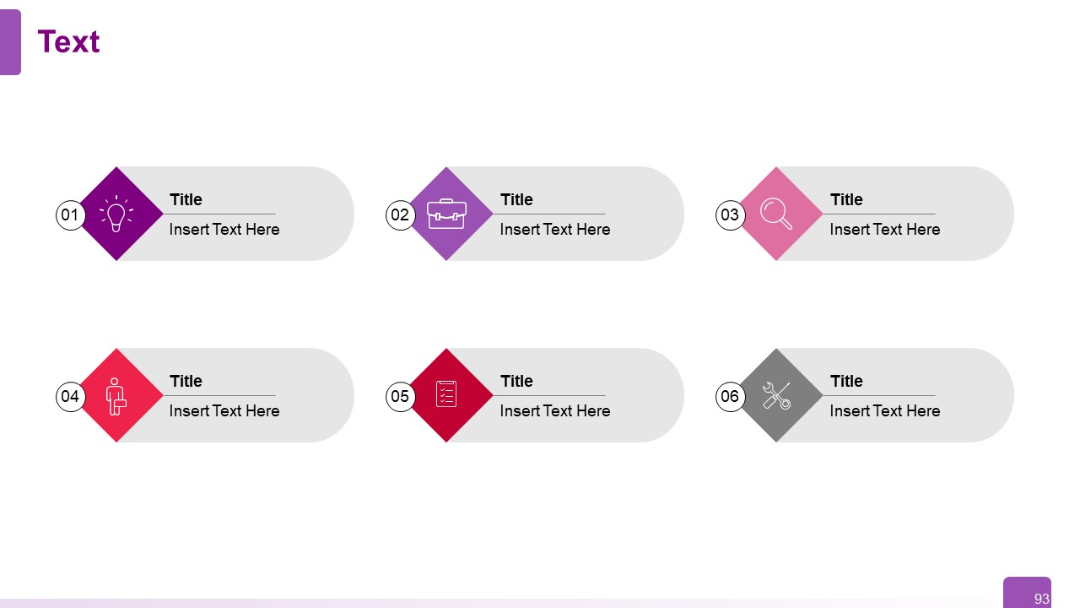
Grid-based layout with six rounded diamond and rectangle shapes in two rows; each has an icon, number, and placeholder text.
PRO
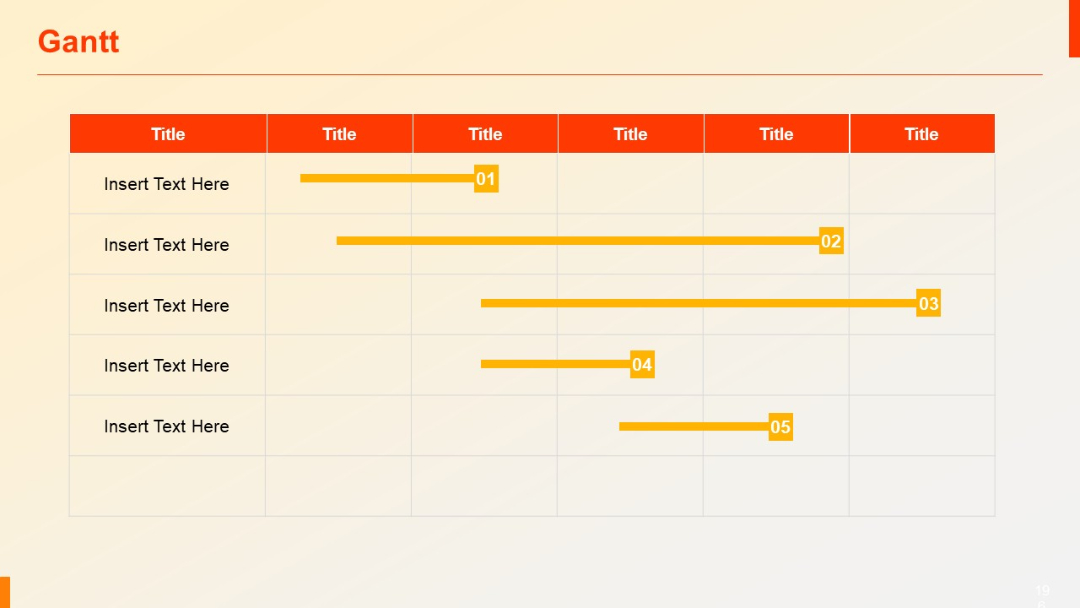
Horizontal bar Gantt chart with labeled milestones; five rows and six time-based columns.
PRO
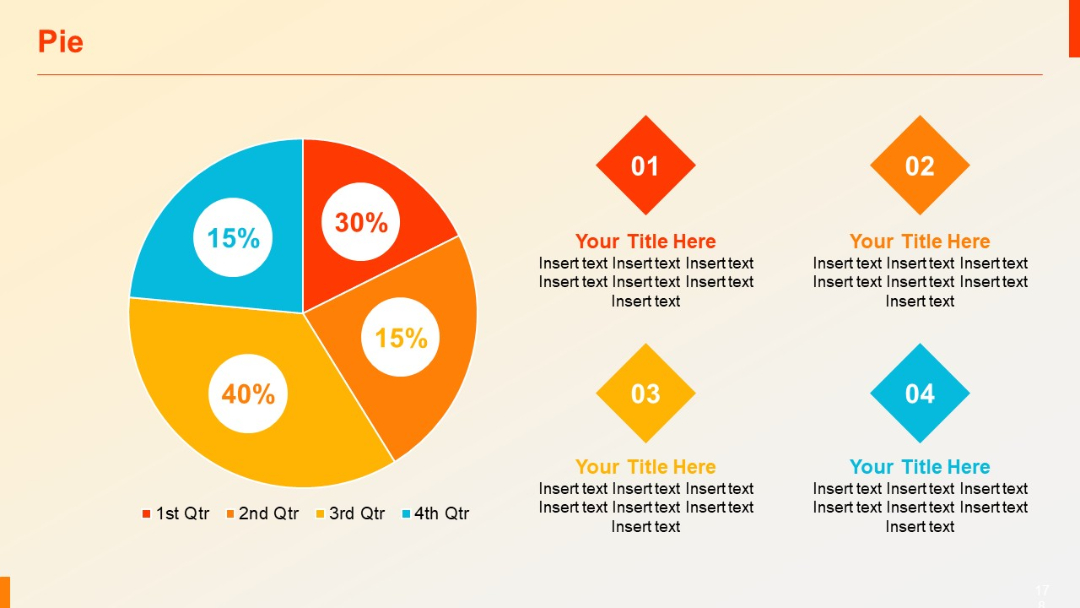
Colorful pie chart (4 segments) with percentages inside each slice. Right side includes four diamond-shaped icons with placeholder text and labels.
PRO
Four interlocked gear icons aligned horizontally. Each gear has a central “Header” and text below. Varying shades of blue.
PRO
Pie chart on the left with a clustered vertical bar chart on the right with three series per category.
PRO
Numbered banner-style blocks in vertical order with modern arrow-tab designs.